Fava Bean Protein Market Outlook (2022 to 2032)

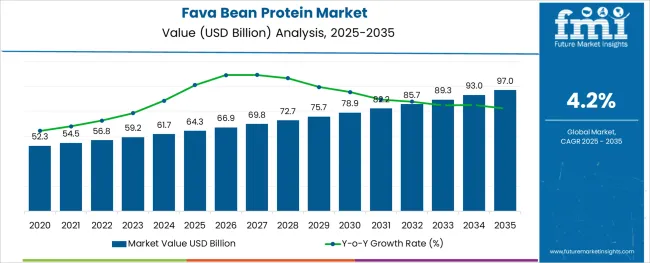
The fava bean protein market is likely to register a CAGR of 4.2% during the forecast period, up from USD 56.79 Billion in 2022 to reach a valuation of USD 85.69 Billion by 2032.

The fava bean protein market is expected to show promising growth prospects during the forecast period.

Attributes Details
Fava Bean Protein Market CAGR (2022 to 2032) 4.2%
Fava Bean Protein Market Value (2022) USD 56.79 Billion
Fava Bean Protein Market Value (2032) USD 85.69 Billion

Sales of fava bean protein is expected to rise due to growing demand for natural and plant-based proteins, evolving consumer behavior, and rising demand for fava bean protein in the nutraceutical sector.

Rising interest in fava bean protein from the nutraceutical sector is also projected to contribute to the growth of the fava bean protein market share.

Some of the key fava bean protein market trends promoting the demand for fava bean protein include the transition from traditional manual agricultural practices to the adoption of automated and modern agricultural equipment and techniques.

The sales of fava bean protein is growing due to these technological advancements that result in higher yield value, improved fava bean quality, and several other benefits. As a result of this factor, the global fava bean protein market share is predicted to grow during the forecast period.

What are the Key Drivers to the Fava Bean Protein Market Share?

As a result, demand for plant-based proteins has increased significantly, fueling demand for fava bean protein over the predicted period. Increased marketing access, improved agronomic practices around the world, and the growing adoption of an integrated approach to crop improvement are some of the other significant factors that are expected to drive the sales of fava bean protein.

The growing emphasis on collaborative research initiatives is projected to play a critical role in enhancing fava bean quality, a factor that is expected to boost the demand for fava bean protein throughout the assessment period. Collaborative research projects all across the world have helped to provide lucrative opportunities for the global fava bean protein market growth.

Due to its low cost, high protein content, and low allergenicity, manufacturers favor fava beans over other plant-based protein sources such as soy protein components and pea protein. As a result, the demand for fava bean protein is projected to grow during the forecast period.

Furthermore, while pea and wheat proteins account for a sizable portion of the vegetable- or plant-based protein market, manufacturers are focusing on expanding their protein portfolio by turning to novel sources. This, in turn, is projected to increase the sales of fava bean protein during the projected period.

In the next few years, the above-mentioned factors are projected to encourage plant protein manufacturers to enter the fava bean protein market.

The use of novel protein sources such as fava beans in the extraction of protein concentrates is increasing in response to the growing sales of fava bean protein and high-quality plant-based proteins.

Consumer processing, nutritional, and specialty demand for fava bean protein are determining manufacturers' and other stakeholders' future plans in the fava bean protein market.

Given the increased demand for fava bean protein in a variety of food and beverage end-uses and applications, major market participants are concentrating on altering product attributes to fulfil specific end-user demands. The sales of fava bean protein is growing as manufacturers are attempting to improve the flavor, texture, and taste of fava bean protein powders to appeal to various types of end users.

Furthermore, rising public knowledge of the fava bean's health benefits is predicted to boost fava bean protein concentrate extraction. In terms of texture, nutrition, and savory profile, fava bean protein powders are predicted to become a popular trend in the fava bean protein market.
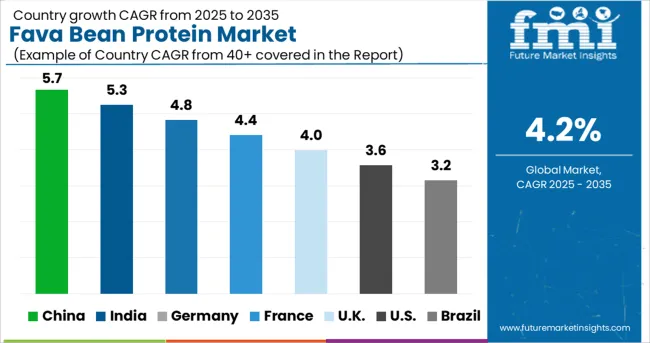
Which is the Leading Region in the Fava Bean Protein Market?

In 2021, Asia Pacific accounted for more than 40.0 percent of the global fava bean protein market. It is an essential element in a range of traditional meals in countries such as India and China. One of the elements fueling demand for fava bean protein in the region is the growing use of roasted seeds as a low-fat snack in India and surrounding countries. China and Australia are two of the world's top producers of fava beans.

From 2022 to 2032, North America is expected to rise by more than 2%. The increased importance of plant-based protein sources in the United States and Canada as a result of rising concerns about glutamate disorders and lactose intolerance is predicted to boost overall fava bean protein consumption.
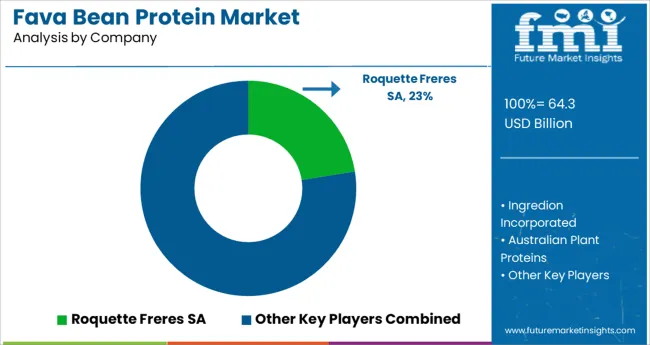
How is the Competitive Landscape in the Fava Bean Protein Market?

Key players in the fava bean protein market are BI Nutraceuticals, Alberta Pulse Growers, Prairie Fava., Puris Proteins, LLC., Dunns (Long Sutton) Limited, Sun Impex B.V., Nuttee Bean Co., Vestkorn Milling AS, Roquette Frères, GrainCorp Limited., Centre State Exports Pty Ltd, Australian Plant Proteins.

Market participants are using innovative ways of extracting fava bean protein concentrates, taking into account the customer preference for pulses as a healthier choice of plant-based protein source. As a result, this is projected to drive the sales of fava bean protein during the forecast period.

Key Developments

  • Vestkorn, a renowned European producer of pea and bean components, announced the launch of new products in November 2019, including textured pea protein and textured fava bean protein. 
  • Roquette Freres SA, a family-owned firm based in France that produces over 650 by-products from the starch extracted from potatoes, peas, corn, and wheat, said in October 2019 that it is exploring expanding outside the pea protein sector and into the fava bean protein market.

Report Scope

Report Attribute Details
Growth rate CAGR of 4.2% from 2022 to 2032
Base year for estimation 2021
Historical data 2014 to 2018
Forecast period 2022 to 2032
Quantitative units Revenue in USD Million and CAGR from 2022 to 2032
Report coverage Revenue forecast, volume forecast, company ranking, competitive landscape, growth factors, and trends, Pricing Analysis
Segments covered Type, Application, End use industries, Region
Regional scope North America; Western Europe; Eastern Europe; Middle East; Africa; ASEAN; South Asia; Rest of Asia; Australia and New Zealand
Country scope USA, Canada, Mexico, Germany, UK., France, Italy, Spain, Russia, Belgium, Poland, Czech Republic, China, India, Japan, Australia, Brazil, Argentina, Colombia, Saudi Arabia, UAE, Iran, South Africa
Key companies profiled BI Nutraceuticals; Alberta Pulse Growers; Prairie Fava.; Puris Proteins; LLC.; Dunns (Long Sutton) Limited; Sun Impex B.V.; Nuttee Bean Co.; Vestkorn Milling AS; Roquette Frères; GrainCorp Limited.; Centre State Exports Pty Ltd; Australian Plant Proteins.
Customization scope Free report customization (equivalent to up to 8 analysts working days) with purchase. Addition or alteration to country, regional & segment scope.
Pricing and purchase options Avail customized purchase options to meet your exact research needs.

Key Segments

By Type:

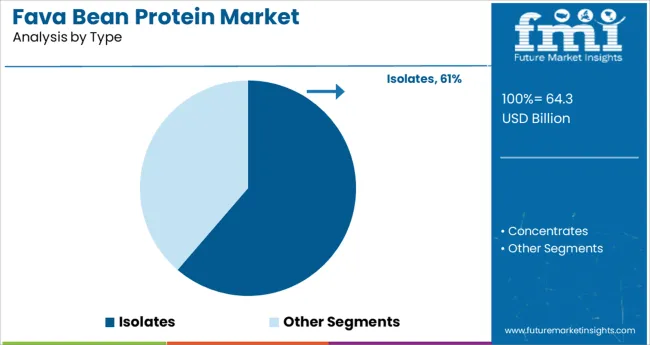
  • Isolates
  • Concentrates

By Application:

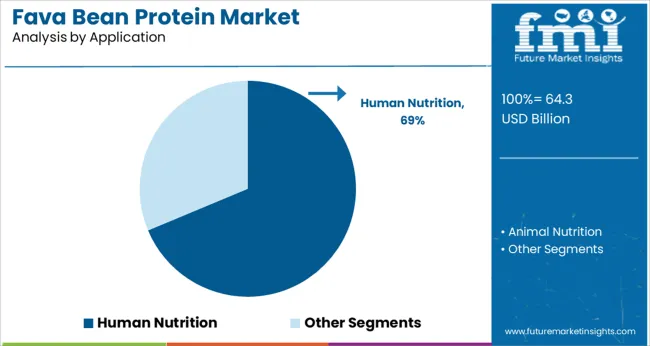
  • Animal Nutrition
  • Human Nutrition

By End-use Industries:

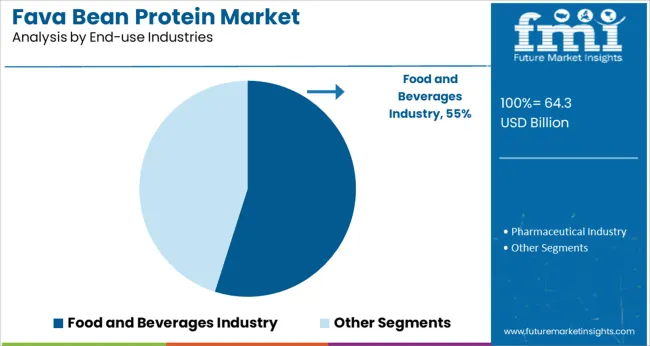
  • Food and Beverages Industry
  • Pharmaceutical Industry

By Region:

  • North America
  • Latin America
  • Asia Pacific
  • MEA
  • Europe

Table of Content

  • 1. Executive Summary
  • 2. Market Overview
  • 3. Market Background
  • 4. Global Fava Bean Protein Market Analysis 2017 to 2021 and Forecast, 2022 to 2032
  • 5. Global Fava Bean Protein Market Analysis 2017 to 2021 and Forecast 2022 to 2032, By Product Type
    • 5.1. Protein Isolate
    • 5.2. Protein Concentrate
    • 5.3. Flour
    • 5.4. Other Product Types
  • 6. Global Fava Bean Protein Market Analysis 2017 to 2021 and Forecast 2022 to 2032, By Process
    • 6.1. Dry Processing
    • 6.2. Wet Processing
  • 7. Global Fava Bean Protein Market Analysis 2017 to 2021 and Forecast 2022 to 2032, By Nature
    • 7.1. Organic
    • 7.2. Conventional
  • 8. Global Fava Bean Protein Market Analysis 2017 to 2021 and Forecast 2022 to 2032, By End-Use
    • 8.1. Food Processing
    • 8.2. Animal Feed
    • 8.3. Nutraceuticals
    • 8.4. Sports Nutrition
    • 8.5. Infant Nutrition
  • 9. Global Fava Bean Protein Market Analysis 2017 to 2021 and Forecast 2022 to 2032, By Region
    • 9.1. North America
    • 9.2. Latin America
    • 9.3. Europe
    • 9.4. East Asia
    • 9.5. South Asia & Pacific
    • 9.6. MEA
  • 10. North America Fava Bean Protein Market Analysis 2017 to 2021 and Forecast 2022 to 2032, By Country
  • 11. Latin America Fava Bean Protein Market Analysis 2017 to 2021 and Forecast 2022 to 2032, By Country
  • 12. Europe Fava Bean Protein Market Analysis 2017 to 2021 and Forecast 2022 to 2032, By Country
  • 13. East Asia Fava Bean Protein Market Analysis 2017 to 2021 and Forecast 2022 to 2032, By Country
  • 14. South Asia & Pacific Fava Bean Protein Market Analysis 2017 to 2021 and Forecast 2022 to 2032, By Country
  • 15. MEA Fava Bean Protein Market Analysis 2017 to 2021 and Forecast 2022 to 2032, By Country
  • 16. Key Countries Fava Bean Protein Market Analysis
  • 17. Market Structure Analysis
  • 18. Competition Analysis
    • 18.1. Roquette Freres SA
    • 18.2. Ingredion Incorporated
    • 18.3. Australian Plant Proteins
    • 18.4. Puris
    • 18.5. Vestkorn
    • 18.6. Nuttee Bean Company
    • 18.7. GrainCorp Limited
    • 18.8. Dunns (Long Sutton) Limited
    • 18.9. Sun Impex B.V.
    • 18.10. Martin Bauer Group
    • 18.11. Prairie Fava
  • 19. Assumptions & Acronyms Used
  • 20. Research Methodology

List of Tables

Table 1: Global Fava Bean Protein Market Value (US$ Mn) Forecast by Region, 2017-2032

Table 2: Global Fava Bean Protein Market Volume (MT) Forecast by Region, 2017-2032

Table 3: Global Fava Bean Protein Market Value (US$ Mn) Forecast by Product Type, 2017-2032

Table 4: Global Fava Bean Protein Market Volume (MT) Forecast by Product Type, 2017-2032

Table 5: Global Fava Bean Protein Market Value (US$ Mn) Forecast by Process, 2017-2032

Table 6: Global Fava Bean Protein Market Volume (MT) Forecast by Process, 2017-2032

Table 7: Global Fava Bean Protein Market Value (US$ Mn) Forecast by Nature, 2017-2032

Table 8: Global Fava Bean Protein Market Volume (MT) Forecast by Nature, 2017-2032

Table 9: Global Fava Bean Protein Market Value (US$ Mn) Forecast by End-Use, 2017-2032

Table 10: Global Fava Bean Protein Market Volume (MT) Forecast by End-Use, 2017-2032

Table 11: North America Fava Bean Protein Market Value (US$ Mn) Forecast by Country, 2017-2032

Table 12: North America Fava Bean Protein Market Volume (MT) Forecast by Country, 2017-2032

Table 13: North America Fava Bean Protein Market Value (US$ Mn) Forecast by Product Type, 2017-2032

Table 14: North America Fava Bean Protein Market Volume (MT) Forecast by Product Type, 2017-2032

Table 15: North America Fava Bean Protein Market Value (US$ Mn) Forecast by Process, 2017-2032

Table 16: North America Fava Bean Protein Market Volume (MT) Forecast by Process, 2017-2032

Table 17: North America Fava Bean Protein Market Value (US$ Mn) Forecast by Nature, 2017-2032

Table 18: North America Fava Bean Protein Market Volume (MT) Forecast by Nature, 2017-2032

Table 19: North America Fava Bean Protein Market Value (US$ Mn) Forecast by End-Use, 2017-2032

Table 20: North America Fava Bean Protein Market Volume (MT) Forecast by End-Use, 2017-2032

Table 21: Latin America Fava Bean Protein Market Value (US$ Mn) Forecast by Country, 2017-2032

Table 22: Latin America Fava Bean Protein Market Volume (MT) Forecast by Country, 2017-2032

Table 23: Latin America Fava Bean Protein Market Value (US$ Mn) Forecast by Product Type, 2017-2032

Table 24: Latin America Fava Bean Protein Market Volume (MT) Forecast by Product Type, 2017-2032

Table 25: Latin America Fava Bean Protein Market Value (US$ Mn) Forecast by Process, 2017-2032

Table 26: Latin America Fava Bean Protein Market Volume (MT) Forecast by Process, 2017-2032

Table 27: Latin America Fava Bean Protein Market Value (US$ Mn) Forecast by Nature, 2017-2032

Table 28: Latin America Fava Bean Protein Market Volume (MT) Forecast by Nature, 2017-2032

Table 29: Latin America Fava Bean Protein Market Value (US$ Mn) Forecast by End-Use, 2017-2032

Table 30: Latin America Fava Bean Protein Market Volume (MT) Forecast by End-Use, 2017-2032

Table 31: Europe Fava Bean Protein Market Value (US$ Mn) Forecast by Country, 2017-2032

Table 32: Europe Fava Bean Protein Market Volume (MT) Forecast by Country, 2017-2032

Table 33: Europe Fava Bean Protein Market Value (US$ Mn) Forecast by Product Type, 2017-2032

Table 34: Europe Fava Bean Protein Market Volume (MT) Forecast by Product Type, 2017-2032

Table 35: Europe Fava Bean Protein Market Value (US$ Mn) Forecast by Process, 2017-2032

Table 36: Europe Fava Bean Protein Market Volume (MT) Forecast by Process, 2017-2032

Table 37: Europe Fava Bean Protein Market Value (US$ Mn) Forecast by Nature, 2017-2032

Table 38: Europe Fava Bean Protein Market Volume (MT) Forecast by Nature, 2017-2032

Table 39: Europe Fava Bean Protein Market Value (US$ Mn) Forecast by End-Use, 2017-2032

Table 40: Europe Fava Bean Protein Market Volume (MT) Forecast by End-Use, 2017-2032

Table 41: East Asia Fava Bean Protein Market Value (US$ Mn) Forecast by Country, 2017-2032

Table 42: East Asia Fava Bean Protein Market Volume (MT) Forecast by Country, 2017-2032

Table 43: East Asia Fava Bean Protein Market Value (US$ Mn) Forecast by Product Type, 2017-2032

Table 44: East Asia Fava Bean Protein Market Volume (MT) Forecast by Product Type, 2017-2032

Table 45: East Asia Fava Bean Protein Market Value (US$ Mn) Forecast by Process, 2017-2032

Table 46: East Asia Fava Bean Protein Market Volume (MT) Forecast by Process, 2017-2032

Table 47: East Asia Fava Bean Protein Market Value (US$ Mn) Forecast by Nature, 2017-2032

Table 48: East Asia Fava Bean Protein Market Volume (MT) Forecast by Nature, 2017-2032

Table 49: East Asia Fava Bean Protein Market Value (US$ Mn) Forecast by End-Use, 2017-2032

Table 50: East Asia Fava Bean Protein Market Volume (MT) Forecast by End-Use, 2017-2032

Table 51: South Asia & Pacific Fava Bean Protein Market Value (US$ Mn) Forecast by Country, 2017-2032

Table 52: South Asia & Pacific Fava Bean Protein Market Volume (MT) Forecast by Country, 2017-2032

Table 53: South Asia & Pacific Fava Bean Protein Market Value (US$ Mn) Forecast by Product Type, 2017-2032

Table 54: South Asia & Pacific Fava Bean Protein Market Volume (MT) Forecast by Product Type, 2017-2032

Table 55: South Asia & Pacific Fava Bean Protein Market Value (US$ Mn) Forecast by Process, 2017-2032

Table 56: South Asia & Pacific Fava Bean Protein Market Volume (MT) Forecast by Process, 2017-2032

Table 57: South Asia & Pacific Fava Bean Protein Market Value (US$ Mn) Forecast by Nature, 2017-2032

Table 58: South Asia & Pacific Fava Bean Protein Market Volume (MT) Forecast by Nature, 2017-2032

Table 59: South Asia & Pacific Fava Bean Protein Market Value (US$ Mn) Forecast by End-Use, 2017-2032

Table 60: South Asia & Pacific Fava Bean Protein Market Volume (MT) Forecast by End-Use, 2017-2032

Table 61: MEA Fava Bean Protein Market Value (US$ Mn) Forecast by Country, 2017-2032

Table 62: MEA Fava Bean Protein Market Volume (MT) Forecast by Country, 2017-2032

Table 63: MEA Fava Bean Protein Market Value (US$ Mn) Forecast by Product Type, 2017-2032

Table 64: MEA Fava Bean Protein Market Volume (MT) Forecast by Product Type, 2017-2032

Table 65: MEA Fava Bean Protein Market Value (US$ Mn) Forecast by Process, 2017-2032

Table 66: MEA Fava Bean Protein Market Volume (MT) Forecast by Process, 2017-2032

Table 67: MEA Fava Bean Protein Market Value (US$ Mn) Forecast by Nature, 2017-2032

Table 68: MEA Fava Bean Protein Market Volume (MT) Forecast by Nature, 2017-2032

Table 69: MEA Fava Bean Protein Market Value (US$ Mn) Forecast by End-Use, 2017-2032

Table 70: MEA Fava Bean Protein Market Volume (MT) Forecast by End-Use, 2017-2032

List of Figures

Figure 1: Global Fava Bean Protein Market Value (US$ Mn) by Product Type, 2022-2032

Figure 2: Global Fava Bean Protein Market Value (US$ Mn) by Process, 2022-2032

Figure 3: Global Fava Bean Protein Market Value (US$ Mn) by Nature, 2022-2032

Figure 4: Global Fava Bean Protein Market Value (US$ Mn) by End-Use, 2022-2032

Figure 5: Global Fava Bean Protein Market Value (US$ Mn) by Region, 2022-2032

Figure 6: Global Fava Bean Protein Market Value (US$ Mn) Analysis by Region, 2017-2032

Figure 7: Global Fava Bean Protein Market Volume (MT) Analysis by Region, 2017-2032

Figure 8: Global Fava Bean Protein Market Value Share (%) and BPS Analysis by Region, 2022-2032

Figure 9: Global Fava Bean Protein Market Y-o-Y Growth (%) Projections by Region, 2022-2032

Figure 10: Global Fava Bean Protein Market Value (US$ Mn) Analysis by Product Type, 2017-2032

Figure 11: Global Fava Bean Protein Market Volume (MT) Analysis by Product Type, 2017-2032

Figure 12: Global Fava Bean Protein Market Value Share (%) and BPS Analysis by Product Type, 2022-2032

Figure 13: Global Fava Bean Protein Market Y-o-Y Growth (%) Projections by Product Type, 2022-2032

Figure 14: Global Fava Bean Protein Market Value (US$ Mn) Analysis by Process, 2017-2032

Figure 15: Global Fava Bean Protein Market Volume (MT) Analysis by Process, 2017-2032

Figure 16: Global Fava Bean Protein Market Value Share (%) and BPS Analysis by Process, 2022-2032

Figure 17: Global Fava Bean Protein Market Y-o-Y Growth (%) Projections by Process, 2022-2032

Figure 18: Global Fava Bean Protein Market Value (US$ Mn) Analysis by Nature, 2017-2032

Figure 19: Global Fava Bean Protein Market Volume (MT) Analysis by Nature, 2017-2032

Figure 20: Global Fava Bean Protein Market Value Share (%) and BPS Analysis by Nature, 2022-2032

Figure 21: Global Fava Bean Protein Market Y-o-Y Growth (%) Projections by Nature, 2022-2032

Figure 22: Global Fava Bean Protein Market Value (US$ Mn) Analysis by End-Use, 2017-2032

Figure 23: Global Fava Bean Protein Market Volume (MT) Analysis by End-Use, 2017-2032

Figure 24: Global Fava Bean Protein Market Value Share (%) and BPS Analysis by End-Use, 2022-2032

Figure 25: Global Fava Bean Protein Market Y-o-Y Growth (%) Projections by End-Use, 2022-2032

Figure 26: Global Fava Bean Protein Market Attractiveness by Product Type, 2022-2032

Figure 27: Global Fava Bean Protein Market Attractiveness by Process, 2022-2032

Figure 28: Global Fava Bean Protein Market Attractiveness by Nature, 2022-2032

Figure 29: Global Fava Bean Protein Market Attractiveness by End-Use, 2022-2032

Figure 30: Global Fava Bean Protein Market Attractiveness by Region, 2022-2032

Figure 31: North America Fava Bean Protein Market Value (US$ Mn) by Product Type, 2022-2032

Figure 32: North America Fava Bean Protein Market Value (US$ Mn) by Process, 2022-2032

Figure 33: North America Fava Bean Protein Market Value (US$ Mn) by Nature, 2022-2032

Figure 34: North America Fava Bean Protein Market Value (US$ Mn) by End-Use, 2022-2032

Figure 35: North America Fava Bean Protein Market Value (US$ Mn) by Country, 2022-2032

Figure 36: North America Fava Bean Protein Market Value (US$ Mn) Analysis by Country, 2017-2032

Figure 37: North America Fava Bean Protein Market Volume (MT) Analysis by Country, 2017-2032

Figure 38: North America Fava Bean Protein Market Value Share (%) and BPS Analysis by Country, 2022-2032

Figure 39: North America Fava Bean Protein Market Y-o-Y Growth (%) Projections by Country, 2022-2032

Figure 40: North America Fava Bean Protein Market Value (US$ Mn) Analysis by Product Type, 2017-2032

Figure 41: North America Fava Bean Protein Market Volume (MT) Analysis by Product Type, 2017-2032

Figure 42: North America Fava Bean Protein Market Value Share (%) and BPS Analysis by Product Type, 2022-2032

Figure 43: North America Fava Bean Protein Market Y-o-Y Growth (%) Projections by Product Type, 2022-2032

Figure 44: North America Fava Bean Protein Market Value (US$ Mn) Analysis by Process, 2017-2032

Figure 45: North America Fava Bean Protein Market Volume (MT) Analysis by Process, 2017-2032

Figure 46: North America Fava Bean Protein Market Value Share (%) and BPS Analysis by Process, 2022-2032

Figure 47: North America Fava Bean Protein Market Y-o-Y Growth (%) Projections by Process, 2022-2032

Figure 48: North America Fava Bean Protein Market Value (US$ Mn) Analysis by Nature, 2017-2032

Figure 49: North America Fava Bean Protein Market Volume (MT) Analysis by Nature, 2017-2032

Figure 50: North America Fava Bean Protein Market Value Share (%) and BPS Analysis by Nature, 2022-2032

Figure 51: North America Fava Bean Protein Market Y-o-Y Growth (%) Projections by Nature, 2022-2032

Figure 52: North America Fava Bean Protein Market Value (US$ Mn) Analysis by End-Use, 2017-2032

Figure 53: North America Fava Bean Protein Market Volume (MT) Analysis by End-Use, 2017-2032

Figure 54: North America Fava Bean Protein Market Value Share (%) and BPS Analysis by End-Use, 2022-2032

Figure 55: North America Fava Bean Protein Market Y-o-Y Growth (%) Projections by End-Use, 2022-2032

Figure 56: North America Fava Bean Protein Market Attractiveness by Product Type, 2022-2032

Figure 57: North America Fava Bean Protein Market Attractiveness by Process, 2022-2032

Figure 58: North America Fava Bean Protein Market Attractiveness by Nature, 2022-2032

Figure 59: North America Fava Bean Protein Market Attractiveness by End-Use, 2022-2032

Figure 60: North America Fava Bean Protein Market Attractiveness by Country, 2022-2032

Figure 61: Latin America Fava Bean Protein Market Value (US$ Mn) by Product Type, 2022-2032

Figure 62: Latin America Fava Bean Protein Market Value (US$ Mn) by Process, 2022-2032

Figure 63: Latin America Fava Bean Protein Market Value (US$ Mn) by Nature, 2022-2032

Figure 64: Latin America Fava Bean Protein Market Value (US$ Mn) by End-Use, 2022-2032

Figure 65: Latin America Fava Bean Protein Market Value (US$ Mn) by Country, 2022-2032

Figure 66: Latin America Fava Bean Protein Market Value (US$ Mn) Analysis by Country, 2017-2032

Figure 67: Latin America Fava Bean Protein Market Volume (MT) Analysis by Country, 2017-2032

Figure 68: Latin America Fava Bean Protein Market Value Share (%) and BPS Analysis by Country, 2022-2032

Figure 69: Latin America Fava Bean Protein Market Y-o-Y Growth (%) Projections by Country, 2022-2032

Figure 70: Latin America Fava Bean Protein Market Value (US$ Mn) Analysis by Product Type, 2017-2032

Figure 71: Latin America Fava Bean Protein Market Volume (MT) Analysis by Product Type, 2017-2032

Figure 72: Latin America Fava Bean Protein Market Value Share (%) and BPS Analysis by Product Type, 2022-2032

Figure 73: Latin America Fava Bean Protein Market Y-o-Y Growth (%) Projections by Product Type, 2022-2032

Figure 74: Latin America Fava Bean Protein Market Value (US$ Mn) Analysis by Process, 2017-2032

Figure 75: Latin America Fava Bean Protein Market Volume (MT) Analysis by Process, 2017-2032

Figure 76: Latin America Fava Bean Protein Market Value Share (%) and BPS Analysis by Process, 2022-2032

Figure 77: Latin America Fava Bean Protein Market Y-o-Y Growth (%) Projections by Process, 2022-2032

Figure 78: Latin America Fava Bean Protein Market Value (US$ Mn) Analysis by Nature, 2017-2032

Figure 79: Latin America Fava Bean Protein Market Volume (MT) Analysis by Nature, 2017-2032

Figure 80: Latin America Fava Bean Protein Market Value Share (%) and BPS Analysis by Nature, 2022-2032

Figure 81: Latin America Fava Bean Protein Market Y-o-Y Growth (%) Projections by Nature, 2022-2032

Figure 82: Latin America Fava Bean Protein Market Value (US$ Mn) Analysis by End-Use, 2017-2032

Figure 83: Latin America Fava Bean Protein Market Volume (MT) Analysis by End-Use, 2017-2032

Figure 84: Latin America Fava Bean Protein Market Value Share (%) and BPS Analysis by End-Use, 2022-2032

Figure 85: Latin America Fava Bean Protein Market Y-o-Y Growth (%) Projections by End-Use, 2022-2032

Figure 86: Latin America Fava Bean Protein Market Attractiveness by Product Type, 2022-2032

Figure 87: Latin America Fava Bean Protein Market Attractiveness by Process, 2022-2032

Figure 88: Latin America Fava Bean Protein Market Attractiveness by Nature, 2022-2032

Figure 89: Latin America Fava Bean Protein Market Attractiveness by End-Use, 2022-2032

Figure 90: Latin America Fava Bean Protein Market Attractiveness by Country, 2022-2032

Figure 91: Europe Fava Bean Protein Market Value (US$ Mn) by Product Type, 2022-2032

Figure 92: Europe Fava Bean Protein Market Value (US$ Mn) by Process, 2022-2032

Figure 93: Europe Fava Bean Protein Market Value (US$ Mn) by Nature, 2022-2032

Figure 94: Europe Fava Bean Protein Market Value (US$ Mn) by End-Use, 2022-2032

Figure 95: Europe Fava Bean Protein Market Value (US$ Mn) by Country, 2022-2032

Figure 96: Europe Fava Bean Protein Market Value (US$ Mn) Analysis by Country, 2017-2032

Figure 97: Europe Fava Bean Protein Market Volume (MT) Analysis by Country, 2017-2032

Figure 98: Europe Fava Bean Protein Market Value Share (%) and BPS Analysis by Country, 2022-2032

Figure 99: Europe Fava Bean Protein Market Y-o-Y Growth (%) Projections by Country, 2022-2032

Figure 100: Europe Fava Bean Protein Market Value (US$ Mn) Analysis by Product Type, 2017-2032

Figure 101: Europe Fava Bean Protein Market Volume (MT) Analysis by Product Type, 2017-2032

Figure 102: Europe Fava Bean Protein Market Value Share (%) and BPS Analysis by Product Type, 2022-2032

Figure 103: Europe Fava Bean Protein Market Y-o-Y Growth (%) Projections by Product Type, 2022-2032

Figure 104: Europe Fava Bean Protein Market Value (US$ Mn) Analysis by Process, 2017-2032

Figure 105: Europe Fava Bean Protein Market Volume (MT) Analysis by Process, 2017-2032

Figure 106: Europe Fava Bean Protein Market Value Share (%) and BPS Analysis by Process, 2022-2032

Figure 107: Europe Fava Bean Protein Market Y-o-Y Growth (%) Projections by Process, 2022-2032

Figure 108: Europe Fava Bean Protein Market Value (US$ Mn) Analysis by Nature, 2017-2032

Figure 109: Europe Fava Bean Protein Market Volume (MT) Analysis by Nature, 2017-2032

Figure 110: Europe Fava Bean Protein Market Value Share (%) and BPS Analysis by Nature, 2022-2032

Figure 111: Europe Fava Bean Protein Market Y-o-Y Growth (%) Projections by Nature, 2022-2032

Figure 112: Europe Fava Bean Protein Market Value (US$ Mn) Analysis by End-Use, 2017-2032

Figure 113: Europe Fava Bean Protein Market Volume (MT) Analysis by End-Use, 2017-2032

Figure 114: Europe Fava Bean Protein Market Value Share (%) and BPS Analysis by End-Use, 2022-2032

Figure 115: Europe Fava Bean Protein Market Y-o-Y Growth (%) Projections by End-Use, 2022-2032

Figure 116: Europe Fava Bean Protein Market Attractiveness by Product Type, 2022-2032

Figure 117: Europe Fava Bean Protein Market Attractiveness by Process, 2022-2032

Figure 118: Europe Fava Bean Protein Market Attractiveness by Nature, 2022-2032

Figure 119: Europe Fava Bean Protein Market Attractiveness by End-Use, 2022-2032

Figure 120: Europe Fava Bean Protein Market Attractiveness by Country, 2022-2032

Figure 121: East Asia Fava Bean Protein Market Value (US$ Mn) by Product Type, 2022-2032

Figure 122: East Asia Fava Bean Protein Market Value (US$ Mn) by Process, 2022-2032

Figure 123: East Asia Fava Bean Protein Market Value (US$ Mn) by Nature, 2022-2032

Figure 124: East Asia Fava Bean Protein Market Value (US$ Mn) by End-Use, 2022-2032

Figure 125: East Asia Fava Bean Protein Market Value (US$ Mn) by Country, 2022-2032

Figure 126: East Asia Fava Bean Protein Market Value (US$ Mn) Analysis by Country, 2017-2032

Figure 127: East Asia Fava Bean Protein Market Volume (MT) Analysis by Country, 2017-2032

Figure 128: East Asia Fava Bean Protein Market Value Share (%) and BPS Analysis by Country, 2022-2032

Figure 129: East Asia Fava Bean Protein Market Y-o-Y Growth (%) Projections by Country, 2022-2032

Figure 130: East Asia Fava Bean Protein Market Value (US$ Mn) Analysis by Product Type, 2017-2032

Figure 131: East Asia Fava Bean Protein Market Volume (MT) Analysis by Product Type, 2017-2032

Figure 132: East Asia Fava Bean Protein Market Value Share (%) and BPS Analysis by Product Type, 2022-2032

Figure 133: East Asia Fava Bean Protein Market Y-o-Y Growth (%) Projections by Product Type, 2022-2032

Figure 134: East Asia Fava Bean Protein Market Value (US$ Mn) Analysis by Process, 2017-2032

Figure 135: East Asia Fava Bean Protein Market Volume (MT) Analysis by Process, 2017-2032

Figure 136: East Asia Fava Bean Protein Market Value Share (%) and BPS Analysis by Process, 2022-2032

Figure 137: East Asia Fava Bean Protein Market Y-o-Y Growth (%) Projections by Process, 2022-2032

Figure 138: East Asia Fava Bean Protein Market Value (US$ Mn) Analysis by Nature, 2017-2032

Figure 139: East Asia Fava Bean Protein Market Volume (MT) Analysis by Nature, 2017-2032

Figure 140: East Asia Fava Bean Protein Market Value Share (%) and BPS Analysis by Nature, 2022-2032

Figure 141: East Asia Fava Bean Protein Market Y-o-Y Growth (%) Projections by Nature, 2022-2032

Figure 142: East Asia Fava Bean Protein Market Value (US$ Mn) Analysis by End-Use, 2017-2032

Figure 143: East Asia Fava Bean Protein Market Volume (MT) Analysis by End-Use, 2017-2032

Figure 144: East Asia Fava Bean Protein Market Value Share (%) and BPS Analysis by End-Use, 2022-2032

Figure 145: East Asia Fava Bean Protein Market Y-o-Y Growth (%) Projections by End-Use, 2022-2032

Figure 146: East Asia Fava Bean Protein Market Attractiveness by Product Type, 2022-2032

Figure 147: East Asia Fava Bean Protein Market Attractiveness by Process, 2022-2032

Figure 148: East Asia Fava Bean Protein Market Attractiveness by Nature, 2022-2032

Figure 149: East Asia Fava Bean Protein Market Attractiveness by End-Use, 2022-2032

Figure 150: East Asia Fava Bean Protein Market Attractiveness by Country, 2022-2032

Figure 151: South Asia & Pacific Fava Bean Protein Market Value (US$ Mn) by Product Type, 2022-2032

Figure 152: South Asia & Pacific Fava Bean Protein Market Value (US$ Mn) by Process, 2022-2032

Figure 153: South Asia & Pacific Fava Bean Protein Market Value (US$ Mn) by Nature, 2022-2032

Figure 154: South Asia & Pacific Fava Bean Protein Market Value (US$ Mn) by End-Use, 2022-2032

Figure 155: South Asia & Pacific Fava Bean Protein Market Value (US$ Mn) by Country, 2022-2032

Figure 156: South Asia & Pacific Fava Bean Protein Market Value (US$ Mn) Analysis by Country, 2017-2032

Figure 157: South Asia & Pacific Fava Bean Protein Market Volume (MT) Analysis by Country, 2017-2032

Figure 158: South Asia & Pacific Fava Bean Protein Market Value Share (%) and BPS Analysis by Country, 2022-2032

Figure 159: South Asia & Pacific Fava Bean Protein Market Y-o-Y Growth (%) Projections by Country, 2022-2032

Figure 160: South Asia & Pacific Fava Bean Protein Market Value (US$ Mn) Analysis by Product Type, 2017-2032

Figure 161: South Asia & Pacific Fava Bean Protein Market Volume (MT) Analysis by Product Type, 2017-2032

Figure 162: South Asia & Pacific Fava Bean Protein Market Value Share (%) and BPS Analysis by Product Type, 2022-2032

Figure 163: South Asia & Pacific Fava Bean Protein Market Y-o-Y Growth (%) Projections by Product Type, 2022-2032

Figure 164: South Asia & Pacific Fava Bean Protein Market Value (US$ Mn) Analysis by Process, 2017-2032

Figure 165: South Asia & Pacific Fava Bean Protein Market Volume (MT) Analysis by Process, 2017-2032

Figure 166: South Asia & Pacific Fava Bean Protein Market Value Share (%) and BPS Analysis by Process, 2022-2032

Figure 167: South Asia & Pacific Fava Bean Protein Market Y-o-Y Growth (%) Projections by Process, 2022-2032

Figure 168: South Asia & Pacific Fava Bean Protein Market Value (US$ Mn) Analysis by Nature, 2017-2032

Figure 169: South Asia & Pacific Fava Bean Protein Market Volume (MT) Analysis by Nature, 2017-2032

Figure 170: South Asia & Pacific Fava Bean Protein Market Value Share (%) and BPS Analysis by Nature, 2022-2032

Figure 171: South Asia & Pacific Fava Bean Protein Market Y-o-Y Growth (%) Projections by Nature, 2022-2032

Figure 172: South Asia & Pacific Fava Bean Protein Market Value (US$ Mn) Analysis by End-Use, 2017-2032

Figure 173: South Asia & Pacific Fava Bean Protein Market Volume (MT) Analysis by End-Use, 2017-2032

Figure 174: South Asia & Pacific Fava Bean Protein Market Value Share (%) and BPS Analysis by End-Use, 2022-2032

Figure 175: South Asia & Pacific Fava Bean Protein Market Y-o-Y Growth (%) Projections by End-Use, 2022-2032

Figure 176: South Asia & Pacific Fava Bean Protein Market Attractiveness by Product Type, 2022-2032

Figure 177: South Asia & Pacific Fava Bean Protein Market Attractiveness by Process, 2022-2032

Figure 178: South Asia & Pacific Fava Bean Protein Market Attractiveness by Nature, 2022-2032

Figure 179: South Asia & Pacific Fava Bean Protein Market Attractiveness by End-Use, 2022-2032

Figure 180: South Asia & Pacific Fava Bean Protein Market Attractiveness by Country, 2022-2032

Figure 181: MEA Fava Bean Protein Market Value (US$ Mn) by Product Type, 2022-2032

Figure 182: MEA Fava Bean Protein Market Value (US$ Mn) by Process, 2022-2032

Figure 183: MEA Fava Bean Protein Market Value (US$ Mn) by Nature, 2022-2032

Figure 184: MEA Fava Bean Protein Market Value (US$ Mn) by End-Use, 2022-2032

Figure 185: MEA Fava Bean Protein Market Value (US$ Mn) by Country, 2022-2032

Figure 186: MEA Fava Bean Protein Market Value (US$ Mn) Analysis by Country, 2017-2032

Figure 187: MEA Fava Bean Protein Market Volume (MT) Analysis by Country, 2017-2032

Figure 188: MEA Fava Bean Protein Market Value Share (%) and BPS Analysis by Country, 2022-2032

Figure 189: MEA Fava Bean Protein Market Y-o-Y Growth (%) Projections by Country, 2022-2032

Figure 190: MEA Fava Bean Protein Market Value (US$ Mn) Analysis by Product Type, 2017-2032

Figure 191: MEA Fava Bean Protein Market Volume (MT) Analysis by Product Type, 2017-2032

Figure 192: MEA Fava Bean Protein Market Value Share (%) and BPS Analysis by Product Type, 2022-2032

Figure 193: MEA Fava Bean Protein Market Y-o-Y Growth (%) Projections by Product Type, 2022-2032

Figure 194: MEA Fava Bean Protein Market Value (US$ Mn) Analysis by Process, 2017-2032

Figure 195: MEA Fava Bean Protein Market Volume (MT) Analysis by Process, 2017-2032

Figure 196: MEA Fava Bean Protein Market Value Share (%) and BPS Analysis by Process, 2022-2032

Figure 197: MEA Fava Bean Protein Market Y-o-Y Growth (%) Projections by Process, 2022-2032

Figure 198: MEA Fava Bean Protein Market Value (US$ Mn) Analysis by Nature, 2017-2032

Figure 199: MEA Fava Bean Protein Market Volume (MT) Analysis by Nature, 2017-2032

Figure 200: MEA Fava Bean Protein Market Value Share (%) and BPS Analysis by Nature, 2022-2032

Figure 201: MEA Fava Bean Protein Market Y-o-Y Growth (%) Projections by Nature, 2022-2032

Figure 202: MEA Fava Bean Protein Market Value (US$ Mn) Analysis by End-Use, 2017-2032

Figure 203: MEA Fava Bean Protein Market Volume (MT) Analysis by End-Use, 2017-2032

Figure 204: MEA Fava Bean Protein Market Value Share (%) and BPS Analysis by End-Use, 2022-2032

Figure 205: MEA Fava Bean Protein Market Y-o-Y Growth (%) Projections by End-Use, 2022-2032

Figure 206: MEA Fava Bean Protein Market Attractiveness by Product Type, 2022-2032

Figure 207: MEA Fava Bean Protein Market Attractiveness by Process, 2022-2032

Figure 208: MEA Fava Bean Protein Market Attractiveness by Nature, 2022-2032

Figure 209: MEA Fava Bean Protein Market Attractiveness by End-Use, 2022-2032

Figure 210: MEA Fava Bean Protein Market Attractiveness by Country, 2022-2032

Frequently Asked Questions

What is the Growth Outlook for the Fava Bean Protein Market?

The fava bean protein market is predicted to register a CAGR of 4.2% during the forecast period.

Who are the Key Players in the Fava Bean Protein Market?

Key players holding substantial fava bean protein market share include BI Nutraceuticals, Alberta Pulse Growers, Prairie Fava., Puris Proteins, LLC., Dunns (Long Sutton) Limited, Sun Impex B.V., Nuttee Bean Co., Vestkorn Milling AS, Roquette Frères, GrainCorp Limited., Centre State Exports Pty Ltd, Australian Plant Proteins.

What is the Future of the Fava Bean Protein Market?

As per the analysis, the fava bean protein market share is likely to be USD 85.69 Billion by 2032.

Which is the Key Driver in the Fava Bean Protein Market?

Demand for fava bean protein is likely to rise due to demand for natural and plant-based proteins and evolving consumer behavior.

Explore Protein Insights

Future Market Insights

Fava Bean Protein Market