Cacao Beans Market Size, Share, and Forecast Outlook 2025 to 2035

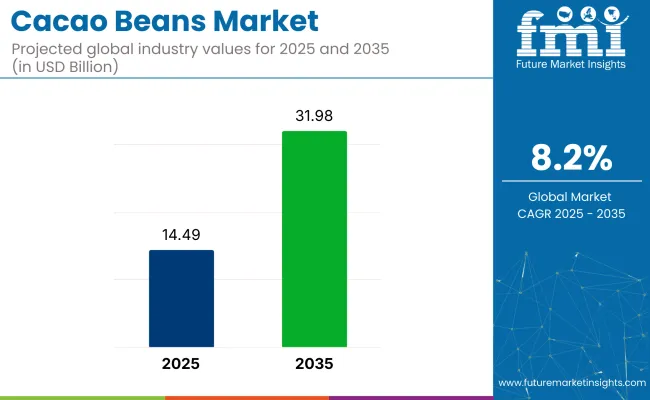
The cacao beans market is expected to reach USD 14.49 billion in 2025, with projected growth to USD 31.98 billion by 2035, reflecting a CAGR of 8.2% over the forecast period. Expansion is supported by stricter traceability regulations and growing investments in premium-grade, high-fermentation cacao types.
Quick Stats for Cacao Beans Market

  • Market Value (2025): USD 14.49 billion
  • Forecast Value (2035): USD 31.98 billion
  • Forecast CAGR (2025 to 2035): 8.2%
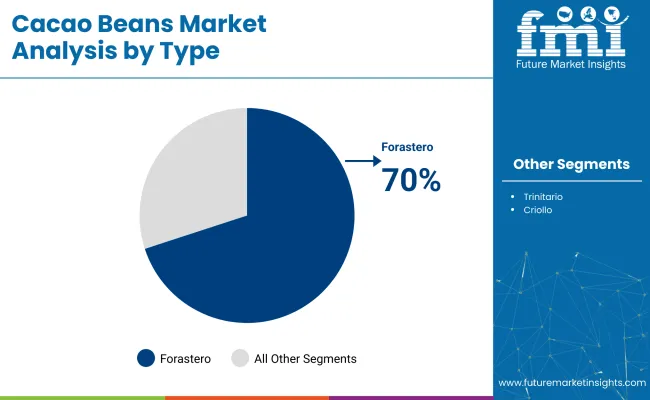
  • Leading Segment in 2035: Forastero cacao beans (70% share)
  • Key Growth Region: North America
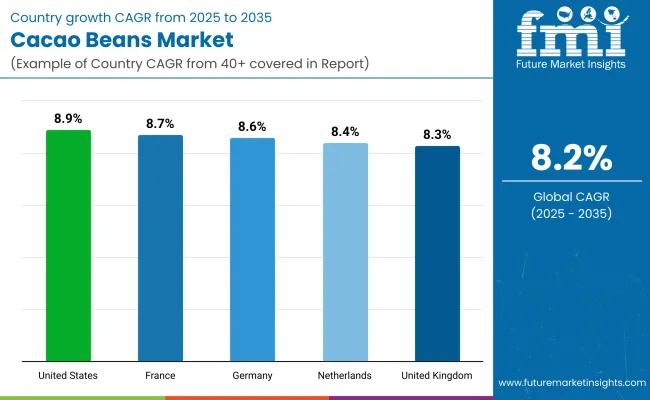
  • Leading Country: United States (CAGR 8.9%)
  • Key Players: Barry Callebaut AG, Cargill, Inc., Olam International, Nestlé S.A., Blommer Chocolate Company, Mars, Inc.

Cacao Beans Market

Metric Value
Industry Size (2025E) USD 14.49 billion
Industry Value (2035F) USD 31.98 billion
CAGR (2025 to 2035) 8.2%

Manufacturers in the chocolate industry are now favoring Forastero beans for their stable fat content and predictable roasting outcomes, securing a dominant share by 2035. The segment for fermented beans is also rising, expected to comprise 60% of total demand, as flavor-enhancing volatile compounds gain preference among bean-to-bar makers and industrial processors alike. In the United States and parts of Western Europe, vertically integrated sourcing models have gained pace, linking cooperatives and midstream processors directly with premium retail chocolate labels.

Despite the expansion of organic and specialty varieties, conventional cacao continues to lead-accounting for nearly 70% of total use-due to its high availability and lower input costs. Côte d'Ivoire, Ghana, and Ecuador remain at the center of supply-side transformation, where investments are flowing into controlled fermentation, trace-tagging of smallholder output, and quality-aligned drying systems. These changes are helping stabilize quality consistency across batches exported to North America and Europe.

Cacao beans contribute only 1-2% to the total agricultural products market, given their crop-specific nature and concentrated growing regions. In the food and beverage segment, their share rises to around 4-6%, fueled by their integral function in chocolate, flavored beverages, and baked goods.

The chocolate industry remains heavily dependent on cacao beans, with the product commanding a 20-30% share of input value. In cosmetics and personal care, cacao-derived actives are gaining ground for their antioxidant profiles, leading to a modest 1-2% share. In the nutraceuticals sector, the share is estimated at 2-3%, with cacao powders and extracts incorporated into supplements marketed for mood, cardiovascular support, and energy metabolism.

Analyzing Cacao Beans Market by Top Investment Segments

The cacao beans market has been segmented by type into criollo, forastero, and trinitario. It has been segmented by application into chocolate and confectionery, food and beverages, cosmetics, and pharmaceuticals. It has been segmented by processing into fermented and unfermented.

It has been segmented by nature into conventional and organic. It has been segmented by region into North America, Latin America, Western Europe, Eastern Europe, Balkans and Baltic, Russia and Belarus, Central Asia, East Asia, South Asia and Pacific, and Middle East and Africa.

Forastero Beans Drive Industrial Bean Selection

Forastero beans are projected to account for 70% of total volume in 2025. Their dominance is supported by high yield, disease resistance, and compatibility with mass processing. These attributes make them the default choice for large-scale cocoa processors and chocolate manufacturers.
  • Bean structure enables low breakage during automated sorting and nib extraction in large-scale grinders.
  • High polyphenol content allows cost-effective use in blends that require antioxidant preservation.
  • Moisture stabilization and lower fermentation loss make them more commercially viable than trinitario or criollo.
  • Industry operators favor forastero due to ease of scale-up in fermentation and roasting.
  • Their compatibility with various alkalization processes supports powder production for low-flavor applications.

Cacao Beans Market Analysis By Type

Chocolate and Confectionery Dominate Bean Usage

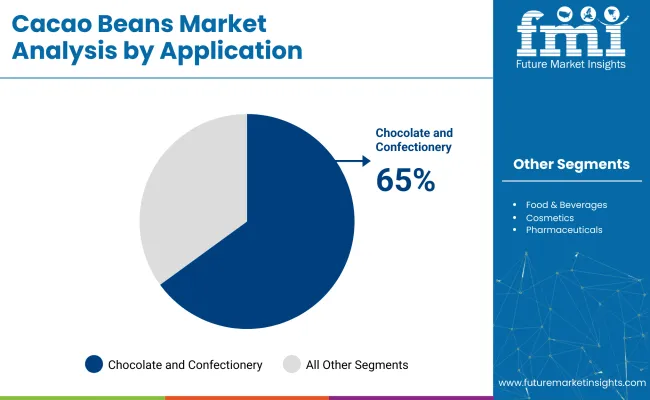
Chocolate and confectionery are projected to account for 65% of total cacao bean applications in 2025. The segment benefits from high-frequency production cycles, standardized formulation needs, and strong consumer preference for cocoa-based products.
  • Continuous tempering systems are optimized around the physical properties of fermented cacao mass.
  • Molded chocolate products demand precise viscosity that is dependent on bean quality and processing.
  • Flavor consistency is maintained through controlled bean roasting. This is needed for branded confectionery recipes.
  • Confectionery fillers require non-gritty textures that rely on fine bean particle size achieved through liquor refining.
  • Consumer-facing innovations in bars, truffles, and inclusions depend on predictable bean chemistry.

Cacao Beans Market Analysis By Application

Fermentation Remains Essential for Flavor Development

Fermented beans are expected to dominate with a 60% share by processing, due to their role in flavor precursors and reducing bitterness. Manufacturers of premium and mainstream chocolate require fermented beans to ensure consistency in product taste and aroma.

  • Fermented beans develop flavor precursors like aldehydes and esters needed for premium chocolate notes.
  • Control over pH and temperature during fermentation ensures minimal off-flavor production.
  • Roasting response is improved when beans are evenly fermented, reducing burnt or sour batches.
  • Increased demand for origin-specific flavor profiles depends on fermentation traceability.
  • Fermented lots enable bean-to-bar makers to market complexity and terroir more effectively.

Conventional Sourcing Supports Volume-Based Operations

Conventional cacao beans are projected to hold 70% share in 2025, largely due to their scalability, cost advantages, and compatibility with global sourcing systems. These beans serve the requirements of commercial processors operating across multiple geographies.

  • Bulk procurement systems are designed around conventional bean specifications.
  • Consistent pesticide management and standardized grading simplify inbound quality checks.
  • Commodity exchanges support hedging strategies tied to conventional bean contracts.
  • Roasting and winnowing lines are calibrated to conventional moisture and shell-to-nib ratios.
  • Organic certification challenges, including residue testing and segregated transport, deter large-scale switching.

Top Cacao Beans Market Dynamics

Innovation in hybrid propagation and regulatory traceability protocols are reshaping sourcing models and production outcomes in the cacao beans market. Yield stabilization, compliance mandates, and technological traceability systems are emerging as defining levers of structural change.

Hybrid Bean Development Reshaping Yield Strategies

Hybrid varietals are being prioritized to overcome crop variability and improve yield density. Trinitario cultivars, blending Forastero durability with Criollo flavor, are being introduced in Ghana, Ecuador, and Nigeria. Genetic trials by Barry Callebaut and Mars are accelerating commercial rollouts, with propagation packs distributed through public-private partnership schemes. Certification-linked premiums are being tied to hybrid performance, compelling commercial farms to abandon legacy types.

  • Genomic-assisted selection is guiding nursery development in R&D-linked territories.
  • Export-driven certification bodies are requiring varietal data disclosure.
  • National extension programs are being retooled to support adoption across fragmented plots.

Traceability Enforcement Altering Supplier Practices Globally

EU deforestation-linked legislation is mandating geo-tagged farm mapping and timestamped harvest logs, pressuring producers to overhaul documentation protocols. Cooperatives in Ghana and Côte d’Ivoire are digitizing compliance using platforms like Farmforce and Sourcemap. Untraceable lots are facing exclusion from premium import pipelines.
  • Medium-scale exporters are adopting blockchain for export authentication.
  • QR-coded tagging is becoming a standard in origin documentation workflows.
  • Supply intermediaries lacking digital traceability are being phased out from formalized trade.

Top Countries Cultivating, Processing, and Exporting Cacao Beans

Cacao Beans Market Country Wise Analysis

Country CAGR (2025 to 2035)
United States 8.9%
France 8.7%
Germany 8.6%
Netherlands 8.4%
United Kingdom 8.3%

The United States cacao beans market is growing at a CAGR of 8.9%, driven by the rising demand for high-quality, direct trade cacao and artisanal chocolate products. With California and Oregon fostering small-scale roasters and bean-to-bar ventures, the shift toward quality-first sourcing is reshaping the industry.

France, growing at 8.7% CAGR, benefits from strong sourcing agreements with Ghana and Ivory Coast, alongside INRAE-supported post-harvest improvements that help enhance single-origin French chocolate. In Germany, the cacao bean market is expanding at 8.6% CAGR, with Hamburg as Europe’s largest import hub. Key players like Barry Callebaut focus on stabilizing supply chains through forward contracting and customs facilitation.

In ASEAN, the Netherlands is emerging as a key player, with Amsterdam handling over 600,000 MT annually. The country’s focus on advanced processing and strong trade ties with Ghana and Cameroon positions it for continued growth at 8.4% CAGR. The United Kingdom also sees strong growth at 8.3% CAGR, leveraging post-Brexit trade deals with Peru for premium cacao beans and fostering innovation with grants for small-scale processors.

The report covers in-depth analysis of 40+ countries. The top five countries have been shared as a reference.

United States Cacao Beans Market Expansion

The USA cacao beans market is expected to grow at a CAGR of 8.9% from 2025 to 2035. Latin America remains the primary supply source, with consistent bean volumes arriving through Gulf Coast ports. California and Oregon are seeing a build-out of small-scale roasters and bean-to-bar manufacturers. They receive favorable state-level food processing grants. USDA programs have lowered inspection delays, encouraging higher import turnover. These trends are reshaping USA bean procurement from a commodity model to a quality-first approach that favors direct trade.

  • USDA's Quality Monitoring Program eases bean traceability and certifies premium imports
  • Rising adoption of direct trade by artisanal chocolate brands bypasses commodity channels
  • Investments into cold chain logistics improve bean freshness during Latin America-USA transit

France Cacao Beans Market Growth Prospects

France’s cacao beans market is projected to expand at a CAGR of 8.7% through 2035. Leading processors based in Normandy and Nouvelle-Aquitaine maintain exclusive sourcing agreements with Ghanaian and Ivorian cooperatives. Support from INRAE for post-harvest fermentation improvement projects aligns with rising demand for terroir-specific chocolate. Government trade missions have prioritized long-term bean security through diplomatic cacao accords. France’s domestic consumption of high-flavor craft chocolate remains strong, driving bean imports toward higher-quality origins.

  • Bilateral trade missions help maintain bean supply stability from West African nations
  • INRAE-supported research enhances fermentation methods for single-origin French chocolate makers
  • Expansion of organic-certified cacao import terminals at Port of Le Havre underway

Germany Cacao Beans Market Analysis and Trajectory

Germany’s cacao beans industry is forecast to grow at a CAGR of 8.6% from 2025 to 2035. Hamburg serves as the central import gateway, accounting for the largest cacao bean volume in continental Europe. Key processors such as Barry Callebaut and ADM continue forward contracting with West African growers to mitigate price fluctuations. The government’s foreign trade strategy recognizes cacao as a strategic raw material, easing custom procedures for certified beans. Domestic demand for couverture and industrial chocolate supports bean throughput throughout the year.

  • Hamburg Port Authority expands bonded warehouse zones dedicated to raw cacao bean shipments
  • ADM and Barry Callebaut scale up grinding operations for industrial chocolate use
  • National customs allow expedited pre-clearance of beans under origin-specific fast-track schemes

Growth Analysis of the Netherlands Cacao Beans Industry

The Netherlands’ cacao beans market is anticipated to grow at a CAGR of 8.4% between 2025 and 2035. Amsterdam handles the highest volume of imported cacao beans in the EU, exceeding 600,000 MT annually. Zaanstad continues to attract investment in advanced processing units tailored for high-grade fermentation profiles. The Ministry of Foreign Affairs provides strategic funding to support sourcing agreements with cooperatives in Ghana and Cameroon. Dutch ports are benefitting from procedural upgrades that improve turnaround for bean imports and intra-EU shipments.

  • Cargill's Amsterdam facility expands capacity to handle over 270,000 MT/year of fermented beans
  • Dutch Trade and Development Cooperation promotes value-chain partnerships with Ghanaian cooperatives
  • Customs exemption for bonded intra-EU cacao movement increases cross-border processing flexibility

United Kingdom Cacao Beans Industry Performance Outlook

The United Kingdom’s cacao beans market is expected to grow at a CAGR of 8.3% through 2035. Post-Brexit trade frameworks have removed tariffs on premium cacao sourced from Central and South America. Scotland has emerged as a hub for bean-to-bar manufacturing, backed by regional enterprise grants. Import routes via Bristol and Felixstowe have been optimized for temperature-sensitive beans. Industry associations have expanded training initiatives on fermentation and drying methods for new chocolate brands entering the UK market.

  • UK-Peru trade agreement includes special access clauses for fermented fine cacao beans
  • Scotland's Food & Drink Federation launches cacao innovation grants for micro-processors
  • Bean-to-bar brands rely on small-batch imports through Bristol and Felixstowe terminals

Leading Suppliers in the Cacao Beans Market

The cacao beans market has an intense competition, with companies like Barry Callebaut AG, Cargill, Inc., Olam International, Nestlé S.A., Blommer Chocolate Company, and Mars, Inc. dominating the space. These players leverage strategic acquisitions and cutting-edge processing technologies to maintain their foothold in the industry. Emerging players like Meiji Holdings Co., Ltd., Puratos Group, and Touton S.A. also carve out their niches through regional expansions and specialized product offerings.

Despite the strong presence of global giants, the market remains fragmented due to ongoing innovation, regional market dynamics, and the diverse needs of the chocolate and confectionery industries. Competitive strategies vary, focusing on product differentiation and growing demand for high-quality cocoa.

Key Players

  • Barry Callebaut AG
  • Cargill, Inc.
  • Olam International
  • Nestlé S.A.
  • Blommer Chocolate Company
  • Mars, Inc.
  • Meiji Holdings Co., Ltd.
  • Puratos Group
  • ECOM Agroindustrial Corp.
  • Touton S.A.
  • Others

Report Scope - Cacao Beans Market

Report Attributes Key Insights
Estimated Market Value (2025) USD 14.49 billion
Projected Market Value (2035) USD 31.98 billion
CAGR (2025 to 2035) 8.2%
Base Year for Estimation 2024
Historical Period 2020 to 2024
Forecast Period 2025 to 2035
Quantitative Units Revenue in USD billion
Type Criollo, Forastero, Trinitario
Application Chocolate & Confectionery, Food & Beverages, Cosmetics, Pharmaceuticals
Processing Fermented, Unfermented
Nature Conventional, Organic
Region North America, Latin America, Western Europe, Eastern Europe, Balkans & Baltic, Russia & Belarus, Central Asia, East Asia, South Asia & Pacific, Middle East & Africa
Countries Covered United States, Canada, Mexico, Brazil, Argentina, Germany, France, United Kingdom, Italy, Spain, Netherlands, China, India, Japan, South Korea, ANZ, GCC Countries, South Africa
Key Players Barry Callebaut AG, Cargill, Inc., Olam International, Nestlé S.A., Blommer Chocolate Company, Mars, Inc., Meiji Holdings Co., Ltd., Puratos Group, ECOM Agroindustrial Corp., Touton S.A., Others
Additional Attributes Dollar sales, CAGR trends, type distribution, application demand, processing trends, organic vs. conventional, competitor dollar sales & market share, regional growth patterns, size preferences

Key Segments

By Type:

As per Type, the industry has been categorized into criollo, forastero, and trinitario.

By Application:

As per Application, the industry has been categorized into chocolate & confectionery, food & beverages, cosmetics, and pharmaceuticals.

By Processing:

As per Processing, the industry has been categorized into fermented and unfermented.

By Nature:

As per Nature, the industry has been categorized into conventional and organic.

By Region:

Industry analysis has been carried out in key countries of North America, Latin America, Western Europe, Eastern Europe, Balkans & Baltic, Russia & Belarus, Central Asia, East Asia, South Asia & Pacific, and Middle East & Africa.

Table of Content

  1. Executive Summary
    • Global Market Outlook
    • Demand-side Trends
    • Supply-side Trends
    • Technology Roadmap Analysis
    • Analysis and Recommendations
  2. Market Overview
    • Market Coverage / Taxonomy
    • Market Definition / Scope / Limitations
  3. Market Background
    • Market Dynamics
      • Drivers
      • Restraints
      • Opportunity
      • Trends
    • Scenario Forecast
      • Demand in Optimistic Scenario
      • Demand in Likely Scenario
      • Demand in Conservative Scenario
    • Opportunity Map Analysis
    • Product Life Cycle Analysis
    • Supply Chain Analysis
      • Supply Side Participants and their Roles
        • Producers
        • Mid-Level Participants (Traders/ Agents/ Brokers)
        • Wholesalers and Distributors
      • Value Added and Value Created at Node in the Supply Chain
      • List of Raw Material Suppliers
      • List of Existing and Potential Buyer’s
    • Investment Feasibility Matrix
    • Value Chain Analysis
      • Profit Margin Analysis
      • Wholesalers and Distributors
      • Retailers
    • PESTLE and Porter’s Analysis
    • Regulatory Landscape
      • By Key Regions
      • By Key Countries
    • Regional Parent Market Outlook
    • Production and Consumption Statistics
    • Import and Export Statistics
  4. Global Market Analysis 2020 to 2024 and Forecast, 2025 to 2035
    • Historical Market Size Value (USD Billion) & Metric Tons Analysis, 2020 to 2024
    • Current and Future Market Size Value (USD Billion) & Metric Tons Projections, 2025 to 2035
      • Y-o-Y Growth Trend Analysis
      • Absolute $ Opportunity Analysis
  5. Global Market Pricing Analysis 2020 to 2024 and Forecast 2025 to 2035
  6. Global Market Analysis 2020 to 2024 and Forecast 2025 to 2035, By Type
    • Introduction / Key Findings
    • Historical Market Size Value (USD Billion) & Metric Tons Analysis By Type, 2020 to 2024
    • Current and Future Market Size Value (USD Billion) & Metric Tons Analysis and Forecast By Type, 2025 to 2035
      • Criollo
      • Forastero
      • Trinitario
    • Y-o-Y Growth Trend Analysis By Type, 2020 to 2024
    • Absolute $ Opportunity Analysis By Type, 2025 to 2035
  7. Global Market Analysis 2020 to 2024 and Forecast 2025 to 2035, By Application
    • Introduction / Key Findings
    • Historical Market Size Value (USD Billion) & Metric Tons Analysis By Application, 2020 to 2024
    • Current and Future Market Size Value (USD Billion) & Metric Tons Analysis and Forecast By Application, 2025 to 2035
      • Chocolate & Confectionery
      • Food & Beverages
      • Cosmetics
      • Pharmaceuticals
    • Y-o-Y Growth Trend Analysis By Application, 2020 to 2024
    • Absolute $ Opportunity Analysis By Application, 2025 to 2035
  8. Global Market Analysis 2020 to 2024 and Forecast 2025 to 2035, By Processing
    • Introduction / Key Findings
    • Historical Market Size Value (USD Billion) & Metric Tons Analysis By Processing, 2020 to 2024
    • Current and Future Market Size Value (USD Billion) & Metric Tons Analysis and Forecast By Processing, 2025 to 2035
      • Fermented
      • Unfermented
    • Y-o-Y Growth Trend Analysis By Processing, 2020 to 2024
    • Absolute $ Opportunity Analysis By Processing, 2025 to 2035
  9. Global Market Analysis 2020 to 2024 and Forecast 2025 to 2035, By Nature
    • Introduction / Key Findings
    • Historical Market Size Value (USD Billion) & Metric Tons Analysis By Nature, 2020 to 2024
    • Current and Future Market Size Value (USD Billion) & Metric Tons Analysis and Forecast By Nature, 2025 to 2035
      • Conventional
      • Organic
    • Y-o-Y Growth Trend Analysis By Nature, 2020 to 2024
    • Absolute $ Opportunity Analysis By Nature, 2025 to 2035
  10. Global Market Analysis 2020 to 2024 and Forecast 2025 to 2035, By Region
    • Introduction
    • Historical Market Size Value (USD Billion) & Metric Tons Analysis By Region, 2020 to 2024
    • Current Market Size Value (USD Billion) & Metric Tons Analysis and Forecast By Region, 2025 to 2035
      • North America
      • Latin America
      • Western Europe
      • Eastern Europe
      • East Asia
      • South Asia & Pacific
      • Middle East and Africa
    • Market Attractiveness Analysis By Region
  11. North America Market Analysis 2020 to 2024 and Forecast 2025 to 2035, By Country
    • Historical Market Size Value (USD Billion) & Metric Tons Trend Analysis By Market Taxonomy, 2020 to 2024
    • Market Size Value (USD Billion) & Metric Tons Forecast By Market Taxonomy, 2025 to 2035
      • By Country
        • USA
        • Canada
        • Mexico
      • By Type
      • By Application
      • By Processing
      • By Nature
    • Market Attractiveness Analysis
      • By Country
      • By Type
      • By Application
      • By Processing
      • By Nature
    • Key Takeaways
  12. Latin America Market Analysis 2020 to 2024 and Forecast 2025 to 2035, By Country
    • Historical Market Size Value (USD Billion) & Metric Tons Trend Analysis By Market Taxonomy, 2020 to 2024
    • Market Size Value (USD Billion) & Metric Tons Forecast By Market Taxonomy, 2025 to 2035
      • By Country
        • Brazil
        • Argentina
        • Rest of LATAM
      • By Type
      • By Application
      • By Processing
      • By Nature
    • Market Attractiveness Analysis
      • By Country
      • By Type
      • By Application
      • By Processing
      • By Nature
    • Key Takeaways
  13. Western Europe Market Analysis 2020 to 2024 and Forecast 2025 to 2035, By Country
    • Historical Market Size Value (USD Billion) & Metric Tons Trend Analysis By Market Taxonomy, 2020 to 2024
    • Market Size Value (USD Billion) & Metric Tons Forecast By Market Taxonomy, 2025 to 2035
      • By Country
        • Germany
        • Italy
        • France
        • UK
        • Spain
        • BENELUX
        • Nordic
        • Rest of W.Europe
      • By Type
      • By Application
      • By Processing
      • By Nature
    • Market Attractiveness Analysis
      • By Country
      • By Type
      • By Application
      • By Processing
      • By Nature
    • Key Takeaways
  14. Eastern Europe Market Analysis 2020 to 2024 and Forecast 2025 to 2035, By Country
    • Historical Market Size Value (USD Billion) & Metric Tons Trend Analysis By Market Taxonomy, 2020 to 2024
    • Market Size Value (USD Billion) & Metric Tons Forecast By Market Taxonomy, 2025 to 2035
      • By Country
        • Russia
        • Hungary
        • Poland
        • Balkan & Baltics
        • Rest of E. Europe
      • By Type
      • By Application
      • By Processing
      • By Nature
    • Market Attractiveness Analysis
      • By Country
      • By Type
      • By Application
      • By Processing
      • By Nature
    • Key Takeaways
  15. East Asia Market Analysis 2020 to 2024 and Forecast 2025 to 2035, By Country
    • Historical Market Size Value (USD Billion) & Metric Tons Trend Analysis By Market Taxonomy, 2020 to 2024
    • Market Size Value (USD Billion) & Metric Tons Forecast By Market Taxonomy, 2025 to 2035
      • By Country
        • China
        • Japan
        • South Korea
      • By Type
      • By Application
      • By Processing
      • By Nature
    • Market Attractiveness Analysis
      • By Country
      • By Type
      • By Application
      • By Processing
      • By Nature
    • Key Takeaways
  16. South Asia & Pacific Market Analysis 2020 to 2024 and Forecast 2025 to 2035, By Country
    • Historical Market Size Value (USD Billion) & Metric Tons Trend Analysis By Market Taxonomy, 2020 to 2024
    • Market Size Value (USD Billion) & Metric Tons Forecast By Market Taxonomy, 2025 to 2035
      • By Country
        • India
        • Australia & New Zealand
        • ASEAN
        • Rest of SAP
      • By Type
      • By Application
      • By Processing
      • By Nature
    • Market Attractiveness Analysis
      • By Country
      • By Type
      • By Application
      • By Processing
      • By Nature
    • Key Takeaways
  17. Middle East and Africa Market Analysis 2020 to 2024 and Forecast 2025 to 2035, By Country
    • Historical Market Size Value (USD Billion) & Metric Tons Trend Analysis By Market Taxonomy, 2020 to 2024
    • Market Size Value (USD Billion) & Metric Tons Forecast By Market Taxonomy, 2025 to 2035
      • By Country
        • GCC Countries
        • Northern Africa
        • South Africa
        • Turkiye
        • Rest of MEA
      • By Type
      • By Application
      • By Processing
      • By Nature
    • Market Attractiveness Analysis
      • By Country
      • By Type
      • By Application
      • By Processing
      • By Nature
    • Key Takeaways
  18. Key Countries Market Analysis
    • USA
      • Pricing Analysis
      • Market Share Analysis, 2024
        • By Type
        • By Application
        • By Processing
        • By Nature
    • Canada
      • Pricing Analysis
      • Market Share Analysis, 2024
        • By Type
        • By Application
        • By Processing
        • By Nature
    • Brazil
      • Pricing Analysis
      • Market Share Analysis, 2024
        • By Type
        • By Application
        • By Processing
        • By Nature
    • Mexico
      • Pricing Analysis
      • Market Share Analysis, 2024
        • By Type
        • By Application
        • By Processing
        • By Nature
    • Argentina
      • Pricing Analysis
      • Market Share Analysis, 2024
        • By Type
        • By Application
        • By Processing
        • By Nature
  19. Market Structure Analysis
    • Competition Dashboard
    • Competition Benchmarking
    • Market Share Analysis of Top Players
      • By Regional
      • By Type
      • By Application
      • By Processing
      • By Nature
  20. Competition Analysis
    • Competition Deep Dive
      • Barry Callebaut AG
        • Overview
        • Product Portfolio
        • Profitability by Market Segments (Product/Age /Sales Channel/Region)
        • Sales Footprint
        • Strategy Overview
          • Marketing Strategy
          • Product Strategy
          • Channel Strategy
      • Cargill, Inc.
        • Overview
        • Product Portfolio
        • Profitability by Market Segments (Product/Age /Sales Channel/Region)
        • Sales Footprint
        • Strategy Overview
          • Marketing Strategy
          • Product Strategy
          • Channel Strategy
      • Olam International
        • Overview
        • Product Portfolio
        • Profitability by Market Segments (Product/Age /Sales Channel/Region)
        • Sales Footprint
        • Strategy Overview
          • Marketing Strategy
          • Product Strategy
          • Channel Strategy
      • Nestlé S.A.
        • Overview
        • Product Portfolio
        • Profitability by Market Segments (Product/Age /Sales Channel/Region)
        • Sales Footprint
        • Strategy Overview
          • Marketing Strategy
          • Product Strategy
          • Channel Strategy
      • Blommer Chocolate Company
        • Overview
        • Product Portfolio
        • Profitability by Market Segments (Product/Age /Sales Channel/Region)
        • Sales Footprint
        • Strategy Overview
          • Marketing Strategy
          • Product Strategy
          • Channel Strategy
      • Mars, Inc.
        • Overview
        • Product Portfolio
        • Profitability by Market Segments (Product/Age /Sales Channel/Region)
        • Sales Footprint
        • Strategy Overview
          • Marketing Strategy
          • Product Strategy
          • Channel Strategy
      • Meiji Holdings Co., Ltd.
        • Overview
        • Product Portfolio
        • Profitability by Market Segments (Product/Age /Sales Channel/Region)
        • Sales Footprint
        • Strategy Overview
          • Marketing Strategy
          • Product Strategy
          • Channel Strategy
      • Puratos Group
        • Overview
        • Product Portfolio
        • Profitability by Market Segments (Product/Age /Sales Channel/Region)
        • Sales Footprint
        • Strategy Overview
          • Marketing Strategy
          • Product Strategy
          • Channel Strategy
      • ECOM Agroindustrial Corp.
        • Overview
        • Product Portfolio
        • Profitability by Market Segments (Product/Age /Sales Channel/Region)
        • Sales Footprint
        • Strategy Overview
          • Marketing Strategy
          • Product Strategy
          • Channel Strategy
      • Touton S.A.
        • Overview
        • Product Portfolio
        • Profitability by Market Segments (Product/Age /Sales Channel/Region)
        • Sales Footprint
        • Strategy Overview
          • Marketing Strategy
          • Product Strategy
          • Channel Strategy
      • Others
        • Overview
        • Product Portfolio
        • Profitability by Market Segments (Product/Age /Sales Channel/Region)
        • Sales Footprint
        • Strategy Overview
          • Marketing Strategy
          • Product Strategy
          • Channel Strategy
  21. Assumptions & Acronyms Used
  22. Research Methodology

List of Tables

  • Table 1: Global Market Value (USD Billion) Forecast by Region, 2020-2035
  • Table 2: Global Market Metric Tons Forecast by Region, 2020-2035
  • Table 3: Global Market Value (USD Billion) Forecast by Type, 2020-2035
  • Table 4: Global Market Metric Tons Forecast by Type, 2020-2035
  • Table 5: Global Market Value (USD Billion) Forecast by Application, 2020-2035
  • Table 6: Global Market Metric Tons Forecast by Application, 2020-2035
  • Table 7: Global Market Value (USD Billion) Forecast by Processing, 2020-2035
  • Table 8: Global Market Metric Tons Forecast by Processing, 2020-2035
  • Table 9: Global Market Value (USD Billion) Forecast by Nature, 2020-2035
  • Table 10: Global Market Metric Tons Forecast by Nature, 2020-2035
  • Table 11: North America Market Value (USD Billion) Forecast by Country, 2020-2035
  • Table 12: North America Market Metric Tons Forecast by Country, 2020-2035
  • Table 13: North America Market Value (USD Billion) Forecast by Type, 2020-2035
  • Table 14: North America Market Metric Tons Forecast by Type, 2020-2035
  • Table 15: North America Market Value (USD Billion) Forecast by Application, 2020-2035
  • Table 16: North America Market Metric Tons Forecast by Application, 2020-2035
  • Table 17: North America Market Value (USD Billion) Forecast by Processing, 2020-2035
  • Table 18: North America Market Metric Tons Forecast by Processing, 2020-2035
  • Table 19: North America Market Value (USD Billion) Forecast by Nature, 2020-2035
  • Table 20: North America Market Metric Tons Forecast by Nature, 2020-2035
  • Table 21: Latin America Market Value (USD Billion) Forecast by Country, 2020-2035
  • Table 22: Latin America Market Metric Tons Forecast by Country, 2020-2035
  • Table 23: Latin America Market Value (USD Billion) Forecast by Type, 2020-2035
  • Table 24: Latin America Market Metric Tons Forecast by Type, 2020-2035
  • Table 25: Latin America Market Value (USD Billion) Forecast by Application, 2020-2035
  • Table 26: Latin America Market Metric Tons Forecast by Application, 2020-2035
  • Table 27: Latin America Market Value (USD Billion) Forecast by Processing, 2020-2035
  • Table 28: Latin America Market Metric Tons Forecast by Processing, 2020-2035
  • Table 29: Latin America Market Value (USD Billion) Forecast by Nature, 2020-2035
  • Table 30: Latin America Market Metric Tons Forecast by Nature, 2020-2035
  • Table 31: Western Europe Market Value (USD Billion) Forecast by Country, 2020-2035
  • Table 32: Western Europe Market Metric Tons Forecast by Country, 2020-2035
  • Table 33: Western Europe Market Value (USD Billion) Forecast by Type, 2020-2035
  • Table 34: Western Europe Market Metric Tons Forecast by Type, 2020-2035
  • Table 35: Western Europe Market Value (USD Billion) Forecast by Application, 2020-2035
  • Table 36: Western Europe Market Metric Tons Forecast by Application, 2020-2035
  • Table 37: Western Europe Market Value (USD Billion) Forecast by Processing, 2020-2035
  • Table 38: Western Europe Market Metric Tons Forecast by Processing, 2020-2035
  • Table 39: Western Europe Market Value (USD Billion) Forecast by Nature, 2020-2035
  • Table 40: Western Europe Market Metric Tons Forecast by Nature, 2020-2035
  • Table 41: Eastern Europe Market Value (USD Billion) Forecast by Country, 2020-2035
  • Table 42: Eastern Europe Market Metric Tons Forecast by Country, 2020-2035
  • Table 43: Eastern Europe Market Value (USD Billion) Forecast by Type, 2020-2035
  • Table 44: Eastern Europe Market Metric Tons Forecast by Type, 2020-2035
  • Table 45: Eastern Europe Market Value (USD Billion) Forecast by Application, 2020-2035
  • Table 46: Eastern Europe Market Metric Tons Forecast by Application, 2020-2035
  • Table 47: Eastern Europe Market Value (USD Billion) Forecast by Processing, 2020-2035
  • Table 48: Eastern Europe Market Metric Tons Forecast by Processing, 2020-2035
  • Table 49: Eastern Europe Market Value (USD Billion) Forecast by Nature, 2020-2035
  • Table 50: Eastern Europe Market Metric Tons Forecast by Nature, 2020-2035
  • Table 51: East Asia Market Value (USD Billion) Forecast by Country, 2020-2035
  • Table 52: East Asia Market Metric Tons Forecast by Country, 2020-2035
  • Table 53: East Asia Market Value (USD Billion) Forecast by Type, 2020-2035
  • Table 54: East Asia Market Metric Tons Forecast by Type, 2020-2035
  • Table 55: East Asia Market Value (USD Billion) Forecast by Application, 2020-2035
  • Table 56: East Asia Market Metric Tons Forecast by Application, 2020-2035
  • Table 57: East Asia Market Value (USD Billion) Forecast by Processing, 2020-2035
  • Table 58: East Asia Market Metric Tons Forecast by Processing, 2020-2035
  • Table 59: East Asia Market Value (USD Billion) Forecast by Nature, 2020-2035
  • Table 60: East Asia Market Metric Tons Forecast by Nature, 2020-2035
  • Table 61: South Asia & Pacific Market Value (USD Billion) Forecast by Country, 2020-2035
  • Table 62: South Asia & Pacific Market Metric Tons Forecast by Country, 2020-2035
  • Table 63: South Asia & Pacific Market Value (USD Billion) Forecast by Type, 2020-2035
  • Table 64: South Asia & Pacific Market Metric Tons Forecast by Type, 2020-2035
  • Table 65: South Asia & Pacific Market Value (USD Billion) Forecast by Application, 2020-2035
  • Table 66: South Asia & Pacific Market Metric Tons Forecast by Application, 2020-2035
  • Table 67: South Asia & Pacific Market Value (USD Billion) Forecast by Processing, 2020-2035
  • Table 68: South Asia & Pacific Market Metric Tons Forecast by Processing, 2020-2035
  • Table 69: South Asia & Pacific Market Value (USD Billion) Forecast by Nature, 2020-2035
  • Table 70: South Asia & Pacific Market Metric Tons Forecast by Nature, 2020-2035
  • Table 71: Middle East and Africa Market Value (USD Billion) Forecast by Country, 2020-2035
  • Table 72: Middle East and Africa Market Metric Tons Forecast by Country, 2020-2035
  • Table 73: Middle East and Africa Market Value (USD Billion) Forecast by Type, 2020-2035
  • Table 74: Middle East and Africa Market Metric Tons Forecast by Type, 2020-2035
  • Table 75: Middle East and Africa Market Value (USD Billion) Forecast by Application, 2020-2035
  • Table 76: Middle East and Africa Market Metric Tons Forecast by Application, 2020-2035
  • Table 77: Middle East and Africa Market Value (USD Billion) Forecast by Processing, 2020-2035
  • Table 78: Middle East and Africa Market Metric Tons Forecast by Processing, 2020-2035
  • Table 79: Middle East and Africa Market Value (USD Billion) Forecast by Nature, 2020-2035
  • Table 80: Middle East and Africa Market Metric Tons Forecast by Nature, 2020-2035

List of Figures

  • Figure 1: Global Market Metric Tons Forecast 2020-2035
  • Figure 2: Global Market Pricing Analysis
  • Figure 3: Global Market Value (USD Billion) Forecast 2020-2035
  • Figure 4: Global Market Value Share and BPS Analysis by Type, 2025 and 2035
  • Figure 5: Global Market Y-o-Y Growth Comparison by Type, 2025-2035
  • Figure 6: Global Market Attractiveness Analysis by Type
  • Figure 7: Global Market Value Share and BPS Analysis by Application, 2025 and 2035
  • Figure 8: Global Market Y-o-Y Growth Comparison by Application, 2025-2035
  • Figure 9: Global Market Attractiveness Analysis by Application
  • Figure 10: Global Market Value Share and BPS Analysis by Processing, 2025 and 2035
  • Figure 11: Global Market Y-o-Y Growth Comparison by Processing, 2025-2035
  • Figure 12: Global Market Attractiveness Analysis by Processing
  • Figure 13: Global Market Value Share and BPS Analysis by Nature, 2025 and 2035
  • Figure 14: Global Market Y-o-Y Growth Comparison by Nature, 2025-2035
  • Figure 15: Global Market Attractiveness Analysis by Nature
  • Figure 16: Global Market Value (USD Billion) Share and BPS Analysis by Region, 2025 and 2035
  • Figure 17: Global Market Y-o-Y Growth Comparison by Region, 2025-2035
  • Figure 18: Global Market Attractiveness Analysis by Region
  • Figure 19: North America Market Incremental $ Opportunity, 2025-2035
  • Figure 20: Latin America Market Incremental $ Opportunity, 2025-2035
  • Figure 21: Western Europe Market Incremental $ Opportunity, 2025-2035
  • Figure 22: Eastern Europe Market Incremental $ Opportunity, 2025-2035
  • Figure 23: East Asia Market Incremental $ Opportunity, 2025-2035
  • Figure 24: South Asia & Pacific Market Incremental $ Opportunity, 2025-2035
  • Figure 25: Middle East and Africa Market Incremental $ Opportunity, 2025-2035
  • Figure 26: North America Market Value Share and BPS Analysis by Country, 2025 and 2035
  • Figure 27: North America Market Value Share and BPS Analysis by Type, 2025 and 2035
  • Figure 28: North America Market Y-o-Y Growth Comparison by Type, 2025-2035
  • Figure 29: North America Market Attractiveness Analysis by Type
  • Figure 30: North America Market Value Share and BPS Analysis by Application, 2025 and 2035
  • Figure 31: North America Market Y-o-Y Growth Comparison by Application, 2025-2035
  • Figure 32: North America Market Attractiveness Analysis by Application
  • Figure 33: North America Market Value Share and BPS Analysis by Processing, 2025 and 2035
  • Figure 34: North America Market Y-o-Y Growth Comparison by Processing, 2025-2035
  • Figure 35: North America Market Attractiveness Analysis by Processing
  • Figure 36: North America Market Value Share and BPS Analysis by Nature, 2025 and 2035
  • Figure 37: North America Market Y-o-Y Growth Comparison by Nature, 2025-2035
  • Figure 38: North America Market Attractiveness Analysis by Nature
  • Figure 39: Latin America Market Value Share and BPS Analysis by Country, 2025 and 2035
  • Figure 40: Latin America Market Value Share and BPS Analysis by Type, 2025 and 2035
  • Figure 41: Latin America Market Y-o-Y Growth Comparison by Type, 2025-2035
  • Figure 42: Latin America Market Attractiveness Analysis by Type
  • Figure 43: Latin America Market Value Share and BPS Analysis by Application, 2025 and 2035
  • Figure 44: Latin America Market Y-o-Y Growth Comparison by Application, 2025-2035
  • Figure 45: Latin America Market Attractiveness Analysis by Application
  • Figure 46: Latin America Market Value Share and BPS Analysis by Processing, 2025 and 2035
  • Figure 47: Latin America Market Y-o-Y Growth Comparison by Processing, 2025-2035
  • Figure 48: Latin America Market Attractiveness Analysis by Processing
  • Figure 49: Latin America Market Value Share and BPS Analysis by Nature, 2025 and 2035
  • Figure 50: Latin America Market Y-o-Y Growth Comparison by Nature, 2025-2035
  • Figure 51: Latin America Market Attractiveness Analysis by Nature
  • Figure 52: Western Europe Market Value Share and BPS Analysis by Country, 2025 and 2035
  • Figure 53: Western Europe Market Value Share and BPS Analysis by Type, 2025 and 2035
  • Figure 54: Western Europe Market Y-o-Y Growth Comparison by Type, 2025-2035
  • Figure 55: Western Europe Market Attractiveness Analysis by Type
  • Figure 56: Western Europe Market Value Share and BPS Analysis by Application, 2025 and 2035
  • Figure 57: Western Europe Market Y-o-Y Growth Comparison by Application, 2025-2035
  • Figure 58: Western Europe Market Attractiveness Analysis by Application
  • Figure 59: Western Europe Market Value Share and BPS Analysis by Processing, 2025 and 2035
  • Figure 60: Western Europe Market Y-o-Y Growth Comparison by Processing, 2025-2035
  • Figure 61: Western Europe Market Attractiveness Analysis by Processing
  • Figure 62: Western Europe Market Value Share and BPS Analysis by Nature, 2025 and 2035
  • Figure 63: Western Europe Market Y-o-Y Growth Comparison by Nature, 2025-2035
  • Figure 64: Western Europe Market Attractiveness Analysis by Nature
  • Figure 65: Eastern Europe Market Value Share and BPS Analysis by Country, 2025 and 2035
  • Figure 66: Eastern Europe Market Value Share and BPS Analysis by Type, 2025 and 2035
  • Figure 67: Eastern Europe Market Y-o-Y Growth Comparison by Type, 2025-2035
  • Figure 68: Eastern Europe Market Attractiveness Analysis by Type
  • Figure 69: Eastern Europe Market Value Share and BPS Analysis by Application, 2025 and 2035
  • Figure 70: Eastern Europe Market Y-o-Y Growth Comparison by Application, 2025-2035
  • Figure 71: Eastern Europe Market Attractiveness Analysis by Application
  • Figure 72: Eastern Europe Market Value Share and BPS Analysis by Processing, 2025 and 2035
  • Figure 73: Eastern Europe Market Y-o-Y Growth Comparison by Processing, 2025-2035
  • Figure 74: Eastern Europe Market Attractiveness Analysis by Processing
  • Figure 75: Eastern Europe Market Value Share and BPS Analysis by Nature, 2025 and 2035
  • Figure 76: Eastern Europe Market Y-o-Y Growth Comparison by Nature, 2025-2035
  • Figure 77: Eastern Europe Market Attractiveness Analysis by Nature
  • Figure 78: East Asia Market Value Share and BPS Analysis by Country, 2025 and 2035
  • Figure 79: East Asia Market Value Share and BPS Analysis by Type, 2025 and 2035
  • Figure 80: East Asia Market Y-o-Y Growth Comparison by Type, 2025-2035
  • Figure 81: East Asia Market Attractiveness Analysis by Type
  • Figure 82: East Asia Market Value Share and BPS Analysis by Application, 2025 and 2035
  • Figure 83: East Asia Market Y-o-Y Growth Comparison by Application, 2025-2035
  • Figure 84: East Asia Market Attractiveness Analysis by Application
  • Figure 85: East Asia Market Value Share and BPS Analysis by Processing, 2025 and 2035
  • Figure 86: East Asia Market Y-o-Y Growth Comparison by Processing, 2025-2035
  • Figure 87: East Asia Market Attractiveness Analysis by Processing
  • Figure 88: East Asia Market Value Share and BPS Analysis by Nature, 2025 and 2035
  • Figure 89: East Asia Market Y-o-Y Growth Comparison by Nature, 2025-2035
  • Figure 90: East Asia Market Attractiveness Analysis by Nature
  • Figure 91: South Asia & Pacific Market Value Share and BPS Analysis by Country, 2025 and 2035
  • Figure 92: South Asia & Pacific Market Value Share and BPS Analysis by Type, 2025 and 2035
  • Figure 93: South Asia & Pacific Market Y-o-Y Growth Comparison by Type, 2025-2035
  • Figure 94: South Asia & Pacific Market Attractiveness Analysis by Type
  • Figure 95: South Asia & Pacific Market Value Share and BPS Analysis by Application, 2025 and 2035
  • Figure 96: South Asia & Pacific Market Y-o-Y Growth Comparison by Application, 2025-2035
  • Figure 97: South Asia & Pacific Market Attractiveness Analysis by Application
  • Figure 98: South Asia & Pacific Market Value Share and BPS Analysis by Processing, 2025 and 2035
  • Figure 99: South Asia & Pacific Market Y-o-Y Growth Comparison by Processing, 2025-2035
  • Figure 100: South Asia & Pacific Market Attractiveness Analysis by Processing
  • Figure 101: South Asia & Pacific Market Value Share and BPS Analysis by Nature, 2025 and 2035
  • Figure 102: South Asia & Pacific Market Y-o-Y Growth Comparison by Nature, 2025-2035
  • Figure 103: South Asia & Pacific Market Attractiveness Analysis by Nature
  • Figure 104: Middle East and Africa Market Value Share and BPS Analysis by Country, 2025 and 2035
  • Figure 105: Middle East and Africa Market Value Share and BPS Analysis by Type, 2025 and 2035
  • Figure 106: Middle East and Africa Market Y-o-Y Growth Comparison by Type, 2025-2035
  • Figure 107: Middle East and Africa Market Attractiveness Analysis by Type
  • Figure 108: Middle East and Africa Market Value Share and BPS Analysis by Application, 2025 and 2035
  • Figure 109: Middle East and Africa Market Y-o-Y Growth Comparison by Application, 2025-2035
  • Figure 110: Middle East and Africa Market Attractiveness Analysis by Application
  • Figure 111: Middle East and Africa Market Value Share and BPS Analysis by Processing, 2025 and 2035
  • Figure 112: Middle East and Africa Market Y-o-Y Growth Comparison by Processing, 2025-2035
  • Figure 113: Middle East and Africa Market Attractiveness Analysis by Processing
  • Figure 114: Middle East and Africa Market Value Share and BPS Analysis by Nature, 2025 and 2035
  • Figure 115: Middle East and Africa Market Y-o-Y Growth Comparison by Nature, 2025-2035
  • Figure 116: Middle East and Africa Market Attractiveness Analysis by Nature
  • Figure 117: Global Market - Tier Structure Analysis
  • Figure 118: Global Market - Company Share Analysis

Frequently Asked Questions

What is the projected market value of the Cacao Beans Market in 2025?

The projected market value of the Cacao Beans Market in 2025 is 14.49 billion USD.

What is the forecast market value of the Cacao Beans Market by 2035?

The forecast market value of the Cacao Beans Market by 2035 is 31.98 billion USD.

What is the expected CAGR for the Cacao Beans Market from 2025 to 2035?

The expected CAGR for the Cacao Beans Market from 2025 to 2035 is 8.2%.

Which segment will lead the Cacao Beans Market in 2035?

The Forastero cacao beans segment will lead the Cacao Beans Market in 2035, with a 70% market share.

Which country is expected to experience the highest growth in the Cacao Beans Market?

United States is expected to experience the highest growth with a CAGR of 8.9%.

Explore Similar Insights

Future Market Insights

Cacao Beans Market