Bambara Beans Market Size, Share, and Forecast Outlook 2025 to 2035

The bambara beans market is expected to experience substantial growth in the coming decade, with an estimated market value of USD 163.4 million in 2025. Demand for bambara beans is likely to reach USD 327.1 million at a CAGR of 7.2% between 2025 and 2035.
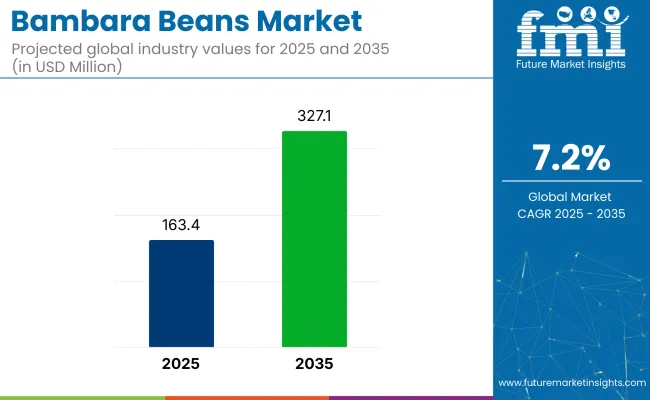
Quick Stats of Bambara Beans Market

  • Market Value (2025): USD 163.4 million
  • Forecast Value (2035): USD 327.1 million
  • Forecast CAGR (2025 to 2035): 7.2%
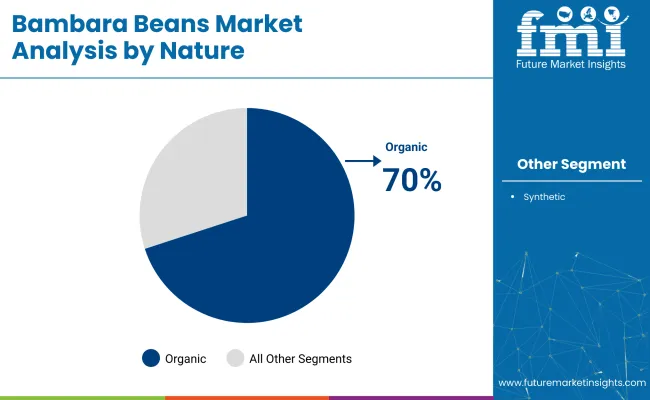
  • Leading Segment in 2025: Organic (70% share)
  • Key Growth Region: Asia Pacific (India is the fastest growing market with 10.2% CAGR)
  • Key Players: Believe in Bambara, Bush’s, Earth Expo Company, Henan Changling Food Co. Ltd., African Flavour’s, and Elite Trading Company.

Bambara Beans Market

Metric Value
Industry Size (2025E) USD 163.4 million
Industry Value (2035F) USD 327.1 million
CAGR (2025 to 2035) 7.2%

Growth is being shaped by region-specific agronomic policies, functional food diversification, and rising attention to drought-resilient crops in marginal soils. In Nigeria, yields are rising due to the adoption of early-maturing seed lines and scaled access to mobile threshing units. Sub-national procurement contracts are also supporting farmer cooperatives across West Africa.

In southern Africa, extruded protein-rich flour applications are gaining visibility in plant-based meal solutions. Emerging applications in protein fortification of traditional staples are encouraging small-scale millers in Zambia and Malawi to process locally sourced bambara beans into higher-value flour grades. In Europe, R&D prototypes have enabled 100% bambara-based snack formulations, with sensory acceptability driving early product trials among gluten-free bakeries and natural food brands.

Across digital and physical supply chains, traceability adoption is increasing. Regional aggregators have begun tagging field-level origin and post-harvest moisture data to meet food safety thresholds in export markets. QR-coded trace tracking is gradually being tested in both domestic and cross-border trade, helping streamline shipment acceptance rates. Investment is flowing into value-added production units, particularly those focused on fractionation and flour standardization for nutraceutical-grade use.

The market holds a niche position across its parent categories. Within the global pulses and legumes market, it contributes 0.4-0.6%, owing to limited cultivation mainly in Sub-Saharan Africa. In the plant-based protein ingredients market, its share remains under 1%, as soy, pea, and lentil proteins dominate. Its role in the functional foods and nutraceuticals segment is emerging but minimal, below 0.2%, due to limited commercial processing.

In the animal feed ingredients market, the product account for less than 0.3%, primarily in localized livestock systems. Within the gluten-free and specialty flour segment, its share is under 0.5%, used chiefly in regional or artisanal applications. Despite low shares, its drought resistance and nutritional density suggest underutilized growth potential.

The rising demand for more natural and sustainable ingredients in animal feed has contributed significantly to the market growth. In January 2025, the USDA committed nearly USD 180 million through the REAP and Higher Blends Infrastructure Program to support development of eco-focused products.

As the global food industry continues to prioritize environmentally conscious practices, there is a noticeable shift toward using plant-based ingredients in animal nutrition. Bambara Beans are a perfect fit for this trend, offering a more sustainable alternative to traditional feed ingredients. This growing interest in sustainable agriculture and food production, combined with the versatility and nutritional benefits of bambara beans, positions the market for strong growth well into the next few years.

Analysis of Bambara Beans Market by Top Investment Segments

The bambara beans market has been segmented by nature into organic and synthetic. It has been segmented by application into cooking ingredient, snack foods, dietary supplements, animal feed, flour, and dairy alternative.

It has been segmented by distribution channel into direct sales, indirect sales, hypermarkets/supermarkets, online stores, specialty stores, and other retailers. It has been segmented by region into North America, Europe, Asia Pacific, Latin America, and Middle East & Africa.

Organic Dominate Nature Segment with 70% Share

The organic bambara beans segment is projected to capture a dominant market share of 70% in 2025, driven by several key factors. As consumers become more health-conscious, there is a strong shift towards organic, sustainable, and chemical-free food choices.
  • The growing awareness of the environmental impact of traditional farming practices and the increasing preference for products that align with ethical and eco-friendly standards are pivotal in this trend.
  • The rise in plant-based diets, fueled by both health and environmental motivations, has led to a surge in demand for organic, non-GMO alternatives.
  • Organic nature, known for their nutritional value and environmental benefits, are well-positioned to meet these consumer demands, further driving their prominence in the market.

Bambara Beans Market Analysis By Nature

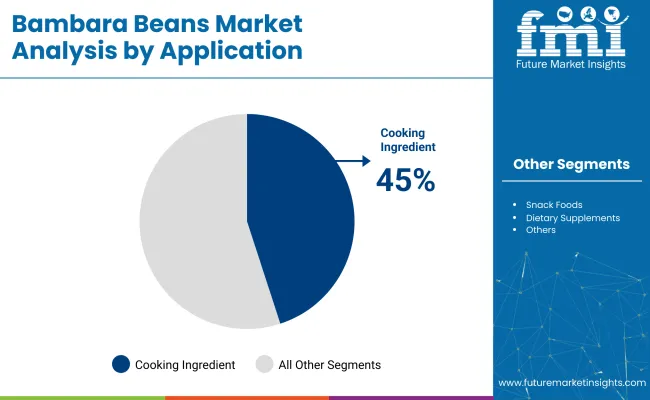
Growing Product Demand in Cooking Ingredient with 45% Share

The cooking ingredient segment is projected to dominate the market in 2025, capturing a substantial share of 45%. This dominance can be attributed to the growing trend of plant-based and health-conscious diets, where the product are increasingly sought after for their versatility and nutritional value.
  • Rich protein content, combined with essential amino acids, makes them an ideal substitute for meat in a variety of dishes. From soups and stews to salads and vegan meat alternatives, the products are recognized for their ability to enhance both flavor and nutritional content.
  • The consumers continue to embrace plant-based cooking, products are being incorporated into more culinary applications, further cementing their position as a key ingredient in the global food market. This trend is expected to grow as awareness of sustainable and healthy eating practices spreads.

Bambara Beans Market Analysis By Application

By Distribution Channel, Hypermarkets/Supermarkets Accounts for Over 40% Share

The hypermarkets/supermarkets segment is expected to capture the largest share of the market, accounting for around 40% in 2025. This is primarily due to the wide availability and convenience offered by these large retail chains, which attract a broad consumer base.

  • Hypermarkets and supermarkets are key distribution points for everyday grocery shoppers, and the growing interest in plant-based and sustainable products has led to an increase in the presence of product on their shelves.
  • With their broad reach and ability to cater to both health-conscious consumers and those seeking convenience, hypermarkets and supermarkets are well-positioned to lead the distribution of bambara beans in 2025. As demand for plant-based products continues to rise, these large-scale retailers will continue to play a pivotal role in making product more accessible to the general public.

Top Bambara Beans Market Dynamics

Bambara beans face rising demand from protein-rich snacks and shelf-stable retail formats, supported by nutritional validation and improved post-harvest handling. Inventory cycles have shortened, but export margins remain under pressure due to input cost inflation and freight volatility. Regional sourcing shifts and digital traceability are aiding efficiency and repeat purchases.

Inventory Rationalization & Post-Harvest Handling Efficiency

Retail and milling partners have compressed bambara bean inventory cycles to release working capital and curb spoilage. Average storage time in West African warehouses dropped from 90 to 61 days in Q1 2025 after deployment of low-cost hermetic bags and moisture sensors.

Chain retailers in Kenya and South Africa now expect bambara bean SKUs to turn 1.5X faster than cowpea, prompting a 17% expansion of shelf space for pre-cleaned packs. Digital batch tracking has cut cross-border rejection rates by 9%, while on-farm threshers financed through micro-credit lowered foreign-material loads by 22%. These efficiencies pushed processors to adopt smaller production runs, lowering buffer stocks by 11% and synchronizing supply with regional pulses demand.

Protein-Rich Snack Opportunity Gains Nutritional Validation

Clinical work at the University of Pretoria (2024) showed that 50g servings of extruded bambara bean crisps delivered 11g protein and achieved an 18% lower glycemic response than maize snacks. EU Horizon funding of EUR 9.8 million has been allocated to pilot legume diversification lines, and five Dutch co-packers now run test batches of gluten-free crackers with 55% bambara flour.

Specialty retailers in Germany posted a 26% increase in sales of bambara-based snack bars during Veganuary 2025, supported by on-pack claims of complete amino-acid profiles. Gym-channel distributors priced the bars at a 12% premium over pea-based equivalents, yet repeat-purchase rates rose by 14% within three months. The evidence-backed positioning is steering bambara beans into sports-nutrition and better-for-you snack segments.

Margin Pressure from Freight Cost and Input Price Shocks

Export-led suppliers have faced shrinking margins as raw-bean procurement and logistics costs climbed. Farm-gate prices in Nigeria and Ghana rose 8% YoY by May 2025 after fertilizer shortages and currency swings. Refrigerated container rates from Lagos to Antwerp increased 10% over the same period, while spot availability tightened 12%. Free-on-board cost escalations outpaced shelf price adjustments, reducing average brand gross margin from 21% to 15%.

Some exporters shifted to bulk bag shipments for European rehydration and milling, trimming landed cost by 18% but introducing sensory trade-offs that limited adoption by premium brands. Others renegotiated supply contracts with EU ingredient blenders to cap price ceilings and stabilize cash flow. The tension between upstream inflation and downstream price resistance continues to test profitability across the bambara beans value chain.
Analysis of Top Countries Manufacturing, Exporting and Supplying Bambara Beans Globally

Bambara Beans Market Country Wise Analysis

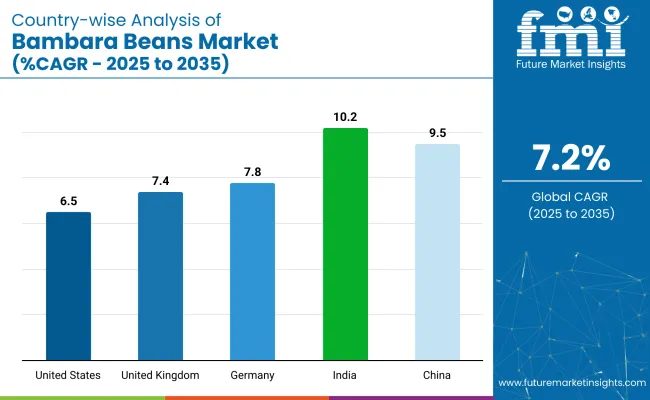
Country CAGR (2025 to 2035)
United States 6.5%
United Kingdom 7.45
Germany 7.8%
China 9.5%
India 10.2%

The report covers a detailed analysis of 40+ countries and the top five countries have been shared as a reference.

The industry, expected to grow at a global CAGR of 7.2% from 2025 to 2035, is displaying varied expansion across key economies. A 6.5% CAGR is being recorded in the United States, an OECD member, driven by applications in gluten-free foods and regenerative cropping systems.

The United Kingdom, also in the OECD, is growing at 7.5%, supported by product launches in the alt-protein beverage category and increased retail presence of African heritage pulses. Germany, with a 7.8% CAGR, is another OECD country where the products are being integrated into organic plant-based protein portfolios due to government-backed R&D investments.

Faster growth is seen in BRICS nations. China is forecast at 9.5%, where pilot zones have been designated to cultivate Bambara beans domestically and reduce reliance on imported plant proteins. India is growing fastest at 10.2%, driven by public-sector millet schemes, expansion of snack manufacturing in tier-II cities, and improved supply-chain linkages for drought-resilient crops. While the OECD bloc shows stable industrial integration, the BRICS countries are demonstrating higher momentum led by agricultural diversification and food security imperatives.

Growth Analysis of Bambara Beans Market in the United States

The USA bambara beans market is estimated to grow at a 6.5% CAGR during the study period, slightly below the global average. This slower growth is attributed to the strong presence of established plant-based protein sources such as soy, peas, and lentils, which dominate the market. While the shift toward plant-based and flexitarian diets continues, it is more gradual compared to emerging markets where demand for alternative proteins is accelerating.

However, increasing consumer awareness about sustainability, water efficiency, and the environmental impact of traditional farming methods is encouraging the adoption of bambara beans. Their nutritional benefits, offering high protein content and essential amino acids, are further driving interest in the USA market, particularly among health-conscious and environmentally aware consumers.

  • Awareness about the environmental impact of food production is gradually increasing.
  • Growth of vegan and alternative protein products contributing to market demand.

Demand Forecast for Bambara Beans Market in China

The bambara beans market in China is projected to grow at a 9.5% CAGR between 2025 and 2035, outperforming the global average. This growth is being supported by China’s increasing emphasis on food security, declining arable water resources, and interest in drought-tolerant crops. Government-led agricultural modernization policies are backing pilot zones in Guangxi and Yunnan for local Bambara bean cultivation.

At the same time, rising awareness of plant-based diets is stimulating demand from health-conscious urban consumers. Domestic plant-based meat producers are incorporating Bambara protein to reduce dependency on imported soy and pea proteins. These factors, combined with the strategic push for protein self-sufficiency, are positioning product as a vital component of China’s alternative protein landscape.

  • Growing health awareness and rising plant-based protein demand.
  • Government initiatives promoting sustainable and water-efficient crops.
  • Increasing use of the products in various food products and animal feed.

Analysis of Bambara Beans Market in Germany

The bambara beans market in Germany is projected to expand at a 7.8% CAGR from 2025 to 2035. Demand is being shaped by Germany’s advanced agricultural systems and widespread adoption of drought-resilient crops aligned with eco-conscious cultivation norms. They are increasingly integrated into organic product portfolios by processors seeking non-soy protein alternatives.

Consumer demand for plant-based diets, particularly those tied to environmental and ethical concerns, is reinforcing this trend. Federal funding for legume research and protein extraction technologies has strengthened domestic processing capabilities. Retail channels have responded by adding Bambara-based protein flours and meat alternatives to health-food aisles. With plant-protein diversification gaining policy and commercial backing, Germany is positioned as a key OECD market in this category.

  • Rising consumer demand for sustainable and eco-friendly protein sources.
  • High adoption of plant-based diets fueling demand for legumes like bambara beans.
  • Government and private sector focus on developing sustainable farming practices.

India Bambara Beans Market Growth

India’s bambara beans market is forecast to grow at a 10.2% CAGR from 2025 to 2035, outpacing global trends. Growth is driven by public-sector programs aimed at expanding climate-resilient crop portfolios, with the product being promoted alongside millets in government procurement schemes. Their drought tolerance makes them suitable for semi-arid states such as Maharashtra, Rajasthan, and Telangana, where water-stressed agriculture dominates.

Rising consumer interest in plant-based proteins, particularly in urban centers, is being tapped by local brands offering Bambara-based snacks, flours, and meat substitutes. FSSAI approvals and crop trials conducted by state agricultural universities have supported formal market development. The bean’s nitrogen-fixing properties also appeal to low-input farming models. These structural advantages position India as a key high-growth BRICS market.

  • Expanding agricultural focus on drought-resistant crops to address water scarcity.
  • Growing urban population adopting plant-based and sustainable diets.
  • Increased demand for alternative proteins in both food and animal feed sectors.

Future Outlook for Bambara Beans Market in the United Kingdom

The bambara beans market in the United Kingdom is projected to grow at a 7.4% CAGR between 2025 and 2035. Growth is being supported by the expanding plant-based food sector, where ethical consumption, carbon reduction, and food traceability are major drivers. Food manufacturers have begun experimenting with Bambara-derived flour and protein isolates in bakery products, meat alternatives, and ambient nutrition bars.

African heritage pulses, including products, are increasingly featured in ethnic food ranges offered by major retailers. However, the market faces stiff competition from more established legumes such as lentils and chickpeas. Despite this, ongoing R&D collaborations between UK food-tech firms and academic institutions are helping refine Bambara-based product formulations, improving both consumer acceptance and commercial viability in the alt-protein segment.

  • Strong plant-based food trends in the UK pushing demand for sustainable protein sources.
  • Growing consumer awareness about the environmental impact of food choices.
  • Demand for legumes and meat alternatives driving market growth in the UK.

Leading Bambara Beans Suppliers

The market is driven by a mix of established players and rising innovators focused on expanding product offerings and market reach. Key companies like BUSH’S, EARTH EXPO COMPANY, and Henan Changling Food Co. Ltd. lead the charge with their established portfolios of plant-based food products, offering as part of their sustainable food initiatives.

African Flavour’s stands out for its commitment to bringing authentic, nutrient-rich options to diverse consumer bases, while Elite Trading Company is recognized for its strategic positioning in sourcing and distributing quality product to various markets. These companies are focusing on sustainable farming practices and innovative product formats to meet the growing demand for plant-based, eco-friendly, and nutrient-dense food options in the global marketplace.

Leading Players

  • Believe in Bambara
  • BUSH’S
  • EARTH EXPO COMPANY
  • Henan Changling Food Co. Ltd.
  • African Flavour’s
  • Elite Trading Company

Report Scope - Bambara Beans Market

Report Attributes Details
Market Size (2025) USD 163.4 million
Projected Market Size (2035) USD 327.1 million
CAGR (2025 to 2035) 7.2%
Base Year for Estimation 2024
Historical Period 2020 to 2024
Projections Period 2025 to 2035
Quantitative Units USD million for value and volume in tons
Nature Analyzed (Segment 1) Organic and Synthetic.
Application Analyzed (Segment 2) Cooking Ingredient, Snack Foods, Dietary Supplements, Animal Feed, Flour, Dairy Alternative.
Distribution Channel Analyzed (Segment 3) Direct Sales, Indirect Sales, Hypermarkets/Supermarkets, Online Stores, Specialty Stores, Other Retailers.
Regions Covered North America, Europe, Asia Pacific, Middle East & Africa, Latin America
Countries Covered United States, Canada, Germany, United Kingdom, France, Italy, Spain, China, Japan, South Korea, India, Australia, Brazil, Mexico, Argentina, Saudi Arabia, UAE, South Africa
Key Players Believe in Bambara, Bush’s, Earth Expo Company, Henan Changling Food Co. Ltd., African Flavour’s, and Elite Trading Company.
Additional Attributes Dollar sales, market share by segment, growth rate, consumer trends towards plant-based proteins, competitive landscape, distribution channels, and regional demand insights for strategic decisions.

Key Segments

By Nature:

The industry is segmented into organic and synthetic.

By Application:

The industry finds applications in cooking ingredient, snack foods, dietary supplements, animal feed, flour, dairy alternative.

By Distribution Channel:

The industry is segmented into direct sales, indirect sales, hypermarkets/supermarkets, online stores, specialty stores, other retailers.

By Region:

The industry covers regions including North America, Europe, Asia Pacific, Latin America, and the Middle East & Africa.

Table of Content

  1. Executive Summary
  2. Industry Introduction, including Taxonomy and Market Definition
  3. Trends and Success Factors, including Macro-economic Factors, Market Dynamics, and Recent Industry Developments
  4. Global Bambara Beans Market Demand Analysis 2020 to 2024 and Forecast 2025 to 2035, including Historical Analysis and Future Projections
  5. Pricing Analysis
  6. Global Bambara Beans Market Analysis 2020 to 2024 and Forecast 2025 to 2035
    • Nature
    • Application
    • Distribution Channel
  7. By Nature
    • Organic Bambara Beans
    • Synthetic Bambara Beans
  8. By Application
    • Bambara Beans as Cooking Ingredients
    • Bambara Beans as Snack Foods
    • Bambara Beans as Dietary Supplements
    • Bambara Beans as Animal Feed
    • Bambara Beans as Flour
    • Bambara Beans as Dairy Alternatives
  9. By Distribution Channel
    • Direct Sales (B2B) of Bambara Beans
    • Indirect Sales (B2C) of Bambara Beans
    • Hypermarkets/Supermarkets
    • Online Stores
    • Specialty Stores
    • Other Retailers
  10. By Region
    • North America
    • Latin America
    • Western Europe
    • Eastern Europe
    • East Asia
    • South Asia & Pacific
    • Central Asia
    • Russia and Belarus
    • Balkan & Baltic Countries
    • Middle East and Africa
  11. North America Sales Analysis 2020 to 2024 and Forecast 2025 to 2035, by Key Segments and Countries
  12. Latin America Sales Analysis 2020 to 2024 and Forecast 2025 to 2035, by Key Segments and Countries
  13. Western Europe Sales Analysis 2020 to 2024 and Forecast 2025 to 2035, by Key Segments and Countries
  14. Eastern Europe Sales Analysis 2020 to 2024 and Forecast 2025 to 2035, by Key Segments and Countries
  15. East Asia Sales Analysis 2020 to 2024 and Forecast 2025 to 2035, by Key Segments and Countries
  16. South Asia & Pacific Sales Analysis 2020 to 2024 and Forecast 2025 to 2035, by Key Segments and Countries
  17. Central Asia Sales Analysis 2020 to 2024 and Forecast 2025 to 2035, by Key Segments and Countries
  18. Russia and Belarus Sales Analysis 2020 to 2024 and Forecast 2025 to 2035, by Key Segments and Countries
  19. Balkan & Baltic Countries Sales Analysis 2020 to 2024 and Forecast 2025 to 2035, by Key Segments and Countries
  20. Middle East and Africa Sales Analysis 2020 to 2024 and Forecast 2025 to 2035, by Key Segments and Countries
  21. Sales Forecast to 2035 by Nature, Application, and Distribution Channel for 30 Countries
  22. Competitive Assessment, Company Share Analysis by Key Players, and Competition Dashboard
  23. Company Profile
    • Believe in Bambara
    • BUSH’S
    • EARTH EXPO COMPANY
    • Henan Changling Food Co. Ltd.
    • African Flavour’s
    • Elite Trading Company
    • Cargill, Inc.
    • Olam Group
    • Nestlé S.A.
    • Unilever

List of Tables

  • Table 1: Global Market Value (USD Million) & Volume (Unit) Forecast by Region, 2020-2035
  • Table 2: Global Market Value (USD Million) & Volume (Unit) Forecast by Nature, 2020-2035
  • Table 3: Global Market Value (USD Million) & Volume (Unit) Forecast by Application, 2020-2035
  • Table 4: Global Market Value (USD Million) & Volume (Unit) Forecast by Distribution Channel, 2020-2035
  • Table 5: North America Market Value (USD Million) & Volume (Unit) Forecast by Country, 2020-2035
  • Table 6: North America Market Value (USD Million) & Volume (Unit) Forecast by Nature, 2020-2035
  • Table 7: North America Market Value (USD Million) & Volume (Unit) Forecast by Application, 2020-2035
  • Table 8: North America Market Value (USD Million) & Volume (Unit) Forecast by Distribution Channel, 2020-2035
  • Table 9: Latin America Market Value (USD Million) & Volume (Unit) Forecast by Country, 2020-2035
  • Table 10: Latin America Market Value (USD Million) & Volume (Unit) Forecast by Nature, 2020-2035
  • Table 11: Latin America Market Value (USD Million) & Volume (Unit) Forecast by Application, 2020-2035
  • Table 12: Latin America Market Value (USD Million) & Volume (Unit) Forecast by Distribution Channel, 2020-2035
  • Table 13: Western Europe Market Value (USD Million) & Volume (Unit) Forecast by Country, 2020-2035
  • Table 14: Western Europe Market Value (USD Million) & Volume (Unit) Forecast by Nature, 2020-2035
  • Table 15: Western Europe Market Value (USD Million) & Volume (Unit) Forecast by Application, 2020-2035
  • Table 16: Western Europe Market Value (USD Million) & Volume (Unit) Forecast by Distribution Channel, 2020-2035
  • Table 17: Eastern Europe Market Value (USD Million) & Volume (Unit) Forecast by Country, 2020-2035
  • Table 18: Eastern Europe Market Value (USD Million) & Volume (Unit) Forecast by Nature, 2020-2035
  • Table 19: Eastern Europe Market Value (USD Million) & Volume (Unit) Forecast by Application, 2020-2035
  • Table 20: Eastern Europe Market Value (USD Million) & Volume (Unit) Forecast by Distribution Channel, 2020-2035
  • Table 21: East Asia Market Value (USD Million) & Volume (Unit) Forecast by Country, 2020-2035
  • Table 22: East Asia Market Value (USD Million) & Volume (Unit) Forecast by Nature, 2020-2035
  • Table 23: East Asia Market Value (USD Million) & Volume (Unit) Forecast by Application, 2020-2035
  • Table 24: East Asia Market Value (USD Million) & Volume (Unit) Forecast by Distribution Channel, 2020-2035
  • Table 25: South Asia & Pacific Market Value (USD Million) & Volume (Unit) Forecast by Country, 2020-2035
  • Table 26: South Asia & Pacific Market Value (USD Million) & Volume (Unit) Forecast by Nature, 2020-2035
  • Table 27: South Asia & Pacific Market Value (USD Million) & Volume (Unit) Forecast by Application, 2020-2035
  • Table 28: South Asia & Pacific Market Value (USD Million) & Volume (Unit) Forecast by Distribution Channel, 2020-2035
  • Table 29: Central Asia Market Value (USD Million) & Volume (Unit) Forecast by Country, 2020-2035
  • Table 30: Central Asia Market Value (USD Million) & Volume (Unit) Forecast by Nature, 2020-2035
  • Table 31: Central Asia Market Value (USD Million) & Volume (Unit) Forecast by Application, 2020-2035
  • Table 32: Central Asia Market Value (USD Million) & Volume (Unit) Forecast by Distribution Channel, 2020-2035
  • Table 33: Russia and Belarus Market Value (USD Million) & Volume (Unit) Forecast by Country, 2020-2035
  • Table 34: Russia and Belarus Market Value (USD Million) & Volume (Unit) Forecast by Nature, 2020-2035
  • Table 35: Russia and Belarus Market Value (USD Million) & Volume (Unit) Forecast by Application, 2020-2035
  • Table 36: Russia and Belarus Market Value (USD Million) & Volume (Unit) Forecast by Distribution Channel, 2020-2035
  • Table 37: Balkan & Baltic Countries Market Value (USD Million) & Volume (Unit) Forecast by Country, 2020-2035
  • Table 38: Balkan & Baltic Countries Market Value (USD Million) & Volume (Unit) Forecast by Nature, 2020-2035
  • Table 39: Balkan & Baltic Countries Market Value (USD Million) & Volume (Unit) Forecast by Application, 2020-2035
  • Table 40: Balkan & Baltic Countries Market Value (USD Million) & Volume (Unit) Forecast by Distribution Channel, 2020-2035
  • Table 41: Middle East and Africa Market Value (USD Million) & Volume (Unit) Forecast by Country, 2020-2035
  • Table 42: Middle East and Africa Market Value (USD Million) & Volume (Unit) Forecast by Nature, 2020-2035
  • Table 43: Middle East and Africa Market Value (USD Million) & Volume (Unit) Forecast by Application, 2020-2035
  • Table 44: Middle East and Africa Market Value (USD Million) & Volume (Unit) Forecast by Distribution Channel, 2020-2035

List of Figures

  • Figure 1: Global Market Value Share (%), Growth Rate (Y-o-Y), and Value (USD Million) & Volume (Unit) Projection by Nature, 2020-2035
  • Figure 2: Global Market Value Share (%), Growth Rate (Y-o-Y), and Value (USD Million) & Volume (Unit) Projection by Application, 2020-2035
  • Figure 3: Global Market Value Share (%), Growth Rate (Y-o-Y), and Value (USD Million) & Volume (Unit) Projection by Distribution Channel, 2020-2035
  • Figure 4: Global Market Value Share (%), Growth Rate (Y-o-Y), and Value (USD Million) & Volume (Unit) Projection by Region, 2020-2035
  • Figure 5: North America Market Value Share (%), Growth Rate (Y-o-Y), and Value (USD Million) & Volume (Unit) Projection by Nature, 2020-2035
  • Figure 6: North America Market Value Share (%), Growth Rate (Y-o-Y), and Value (USD Million) & Volume (Unit) Projection by Application, 2020-2035
  • Figure 7: North America Market Value Share (%), Growth Rate (Y-o-Y), and Value (USD Million) & Volume (Unit) Projection by Distribution Channel, 2020-2035
  • Figure 8: North America Market Value Share (%), Growth Rate (Y-o-Y), and Value (USD Million) & Volume (Unit) Projection by Country, 2020-2035
  • Figure 9: Latin America Market Value Share (%), Growth Rate (Y-o-Y), and Value (USD Million) & Volume (Unit) Projection by Nature, 2020-2035
  • Figure 10: Latin America Market Value Share (%), Growth Rate (Y-o-Y), and Value (USD Million) & Volume (Unit) Projection by Application, 2020-2035
  • Figure 11: Latin America Market Value Share (%), Growth Rate (Y-o-Y), and Value (USD Million) & Volume (Unit) Projection by Distribution Channel, 2020-2035
  • Figure 12: Latin America Market Value Share (%), Growth Rate (Y-o-Y), and Value (USD Million) & Volume (Unit) Projection by Country, 2020-2035
  • Figure 13: Western Europe Market Value Share (%), Growth Rate (Y-o-Y), and Value (USD Million) & Volume (Unit) Projection by Nature, 2020-2035
  • Figure 14: Western Europe Market Value Share (%), Growth Rate (Y-o-Y), and Value (USD Million) & Volume (Unit) Projection by Application, 2020-2035
  • Figure 15: Western Europe Market Value Share (%), Growth Rate (Y-o-Y), and Value (USD Million) & Volume (Unit) Projection by Distribution Channel, 2020-2035
  • Figure 16: Western Europe Market Value Share (%), Growth Rate (Y-o-Y), and Value (USD Million) & Volume (Unit) Projection by Country, 2020-2035
  • Figure 17: Eastern Europe Market Value Share (%), Growth Rate (Y-o-Y), and Value (USD Million) & Volume (Unit) Projection by Nature, 2020-2035
  • Figure 18: Eastern Europe Market Value Share (%), Growth Rate (Y-o-Y), and Value (USD Million) & Volume (Unit) Projection by Application, 2020-2035
  • Figure 19: Eastern Europe Market Value Share (%), Growth Rate (Y-o-Y), and Value (USD Million) & Volume (Unit) Projection by Distribution Channel, 2020-2035
  • Figure 20: Eastern Europe Market Value Share (%), Growth Rate (Y-o-Y), and Value (USD Million) & Volume (Unit) Projection by Country, 2020-2035
  • Figure 21: East Asia Market Value Share (%), Growth Rate (Y-o-Y), and Value (USD Million) & Volume (Unit) Projection by Nature, 2020-2035
  • Figure 22: East Asia Market Value Share (%), Growth Rate (Y-o-Y), and Value (USD Million) & Volume (Unit) Projection by Application, 2020-2035
  • Figure 23: East Asia Market Value Share (%), Growth Rate (Y-o-Y), and Value (USD Million) & Volume (Unit) Projection by Distribution Channel, 2020-2035
  • Figure 24: East Asia Market Value Share (%), Growth Rate (Y-o-Y), and Value (USD Million) & Volume (Unit) Projection by Country, 2020-2035
  • Figure 25: South Asia & Pacific Market Value Share (%), Growth Rate (Y-o-Y), and Value (USD Million) & Volume (Unit) Projection by Nature, 2020-2035
  • Figure 26: South Asia & Pacific Market Value Share (%), Growth Rate (Y-o-Y), and Value (USD Million) & Volume (Unit) Projection by Application, 2020-2035
  • Figure 27: South Asia & Pacific Market Value Share (%), Growth Rate (Y-o-Y), and Value (USD Million) & Volume (Unit) Projection by Distribution Channel, 2020-2035
  • Figure 28: South Asia & Pacific Market Value Share (%), Growth Rate (Y-o-Y), and Value (USD Million) & Volume (Unit) Projection by Country, 2020-2035
  • Figure 29: Central Asia Market Value Share (%), Growth Rate (Y-o-Y), and Value (USD Million) & Volume (Unit) Projection by Nature, 2020-2035
  • Figure 30: Central Asia Market Value Share (%), Growth Rate (Y-o-Y), and Value (USD Million) & Volume (Unit) Projection by Application, 2020-2035
  • Figure 31: Central Asia Market Value Share (%), Growth Rate (Y-o-Y), and Value (USD Million) & Volume (Unit) Projection by Distribution Channel, 2020-2035
  • Figure 32: Central Asia Market Value Share (%), Growth Rate (Y-o-Y), and Value (USD Million) & Volume (Unit) Projection by Country, 2020-2035
  • Figure 33: Russia and Belarus Market Value Share (%), Growth Rate (Y-o-Y), and Value (USD Million) & Volume (Unit) Projection by Nature, 2020-2035
  • Figure 34: Russia and Belarus Market Value Share (%), Growth Rate (Y-o-Y), and Value (USD Million) & Volume (Unit) Projection by Application, 2020-2035
  • Figure 35: Russia and Belarus Market Value Share (%), Growth Rate (Y-o-Y), and Value (USD Million) & Volume (Unit) Projection by Distribution Channel, 2020-2035
  • Figure 36: Russia and Belarus Market Value Share (%), Growth Rate (Y-o-Y), and Value (USD Million) & Volume (Unit) Projection by Country, 2020-2035
  • Figure 37: Balkan & Baltic Countries Market Value Share (%), Growth Rate (Y-o-Y), and Value (USD Million) & Volume (Unit) Projection by Nature, 2020-2035
  • Figure 38: Balkan & Baltic Countries Market Value Share (%), Growth Rate (Y-o-Y), and Value (USD Million) & Volume (Unit) Projection by Application, 2020-2035
  • Figure 39: Balkan & Baltic Countries Market Value Share (%), Growth Rate (Y-o-Y), and Value (USD Million) & Volume (Unit) Projection by Distribution Channel, 2020-2035
  • Figure 40: Balkan & Baltic Countries Market Value Share (%), Growth Rate (Y-o-Y), and Value (USD Million) & Volume (Unit) Projection by Country, 2020-2035
  • Figure 41: Middle East and Africa Market Value Share (%), Growth Rate (Y-o-Y), and Value (USD Million) & Volume (Unit) Projection by Nature, 2020-2035
  • Figure 42: Middle East and Africa Market Value Share (%), Growth Rate (Y-o-Y), and Value (USD Million) & Volume (Unit) Projection by Application, 2020-2035
  • Figure 43: Middle East and Africa Market Value Share (%), Growth Rate (Y-o-Y), and Value (USD Million) & Volume (Unit) Projection by Distribution Channel, 2020-2035
  • Figure 44: Middle East and Africa Market Value Share (%), Growth Rate (Y-o-Y), and Value (USD Million) & Volume (Unit) Projection by Country, 2020-2035

Frequently Asked Questions

What is the estimated market size of the bambara beans industry in 2025?

The industry is valued at USD 163.4 million in 2025.

What is the projected industry size of the bambara beans industry by 2035?

It is forecasted to reach USD 327.1 million by 2035.

What is the expected CAGR for the bambara beans industry between 2025 and 2035?

The industry is anticipated to grow at a CAGR of 7.2% during this period.

Which segment is expected to lead the bambara beans market in 2025?

Organic beans are projected to lead the market with a 70% share in 2025.

Which region is expected to witness the highest growth in the bambara beans market?

Asia Pacific, particularly India, is expected to be the key growth region with a projected growth rate of 10.2%.

Explore Similar Insights

Future Market Insights

Bambara Beans Market