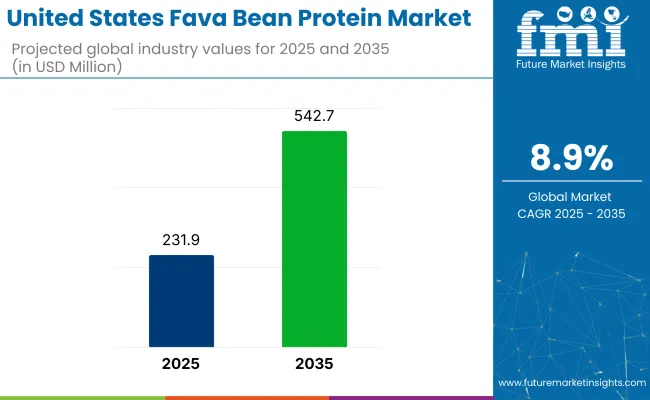
The Fava Bean Protein Industry Analysis in United States is projected to expand from USD 231.9 million in 2025 to USD 542.7 million by 2035, registering a CAGR of 8.9% over the forecast period.

Growth is being shaped by the shift in consumer sentiment toward alternative proteins and the perceived digestibility and allergen-free nature of fava bean isolates and concentrates. Plant-based brands are aggressively expanding SKUs with fava bean inputs as demand for soy- and gluten-free protein options climbs.
The USA market is gaining momentum as formulators seek cleaner, non-allergenic alternatives to soy and pea for high-performance applications. Between 2020 and 2024, demand spiked among precision fermentation companies and alt-meat startups capitalizing on fava’s superior emulsification, mild flavor profile, and high lysine content.
Unlike legacy plant proteins, fava integrates seamlessly into dairy analogs and extruded meat textures without the need for masking agents. North American processors such as PURIS and AGT Foods have scaled fractionation technologies to isolate high-purity concentrates that meet NSF and SQF standards.
From a sourcing standpoint, domestic fava acreage has expanded in Idaho and Montana, mitigating reliance on EU imports. As the regulatory landscape tightens around clean labeling and protein digestibility scores, fava stands out as both a functional and strategic protein asset in the USA formulation toolkit.
The fava bean protein market in the USA holds specific shares within its parent markets. Within the plant-based protein market, it holds about 2-4%, as fava bean protein is a growing but niche source compared to other plant-based proteins. In the food and beverage market, the share is approximately 1-3%, driven by the increasing demand for plant-based alternatives in USA food products.
The animal feed additives market contributes around 1-2%, with fava bean protein used in animal nutrition. In the nutraceutical market, the share is around 1-2%, where it's valued for its health benefits. The agricultural ingredients market holds a share of 3-5%, as fava bean protein extraction grows in the USA
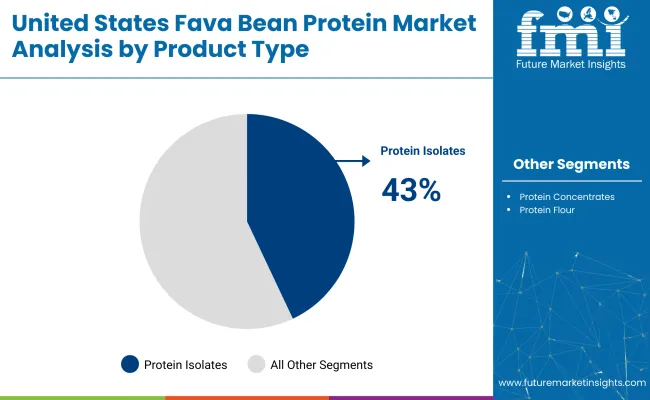
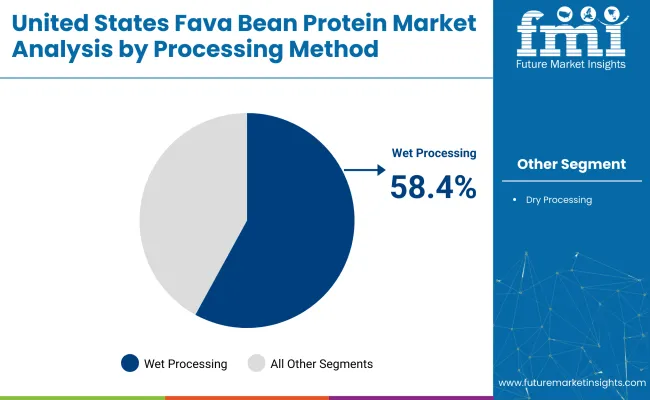
Protein isolates are expected to lead the product type segment with a 43% share by 2025, while wet processing will dominate processing methods at 58.4%. Food grade variants will hold 85% share due to demand in human nutrition, and meat alternatives will be the top application, contributing 25% to the market.

Protein isolates are projected to hold 43% of the product type share in the USA by 2025, driven by high protein content and functional versatility. Clean-label formulations have increased preference for plant-based isolates in health-focused product lines.

Wet processing is set to command 58.4% of the processing method share by 2025, owing to its ability to yield purer, high-quality protein concentrates. Consistency in texture and enhanced solubility make wet-processed fava proteins ideal for dairy alternatives and sports nutrition.
Food grade is forecasted to dominate the grade segment with 85% share by 2025, driven by demand from functional food producers and plant-based brands. Its hypoallergenic properties and neutral profile support usage across cereals, snacks, and fortified drinks.
Meat alternatives are anticipated to lead the application segment with a 25% share by 2025, influenced by changing dietary preferences and sustainability goals. Fava protein serves as a key substitute for soy and pea in textured meat analogues due to its firm bite and binding properties.
Functional demand in extrusion-based applications is driving fava bean protein use across meat alternatives and snacks in the USA Still, inconsistent sensory output and limited consumer familiarity are constraining expansion beyond formulators and foodservice manufacturers.
Texturization Performance Driving Integration into Meat Analogues
Fava bean protein has gained traction among USA processors seeking clean-label plant proteins with high gelation and emulsification capacity. Compared to pea or soy, fava delivers firmer bite and water-holding under high-moisture extrusion (HME) without added starches.
Companies like PURIS and Equinom are scaling USA-grown low-vicine cultivars to support allergen-free production. Meat analogue makers are blending fava with wheat gluten and chickpea to enhance texture while meeting grain-free claims. Regional processors supplying to QSRs and retail private labels are using fava isolates in shelf-stable jerky and nugget formats.
Despite processing benefits, fava bean protein faces resistance in direct-to-consumer retail due to its beany, earthy aftertaste. USA brands have reported negative consumer feedback on flavored protein drinks and ready meals where masking agents failed to eliminate off-notes.
Limited public awareness compared to pea or soy has stalled shelf acceptance. Foodservice and industrial buyers show stronger uptake, while DTC brands limit fava content or blend it to avoid mouthfeel and flavor issues. Retail trials in natural food stores have recorded below-average sell-through for fava-dominant SKUs.
The USA fava bean protein market is moving beyond niche status, projected to grow at 8.9% CAGR through 2035. North Dakota, at 9.4%, is becoming the country’s core supply engine. More than 250,000 acres have shifted to fava bean cultivation since 2021, supported by vertically integrated systems that include on-site dehulling and dry-fractionation to retain processing margins and meet both domestic and European protein standards.
California tracks closely at 8.9%, but growth here is premium-led. Regional innovators are embedding fava isolates into alt-dairy formulations with over 30% protein concentration and launching clinical blends targeting medical nutrition, often under FDA Medical Foods exemptions. Washington, growing at 8.2%, is capitalizing on institutional demand.
Co-ops are locking in multi-year contracts with public schools and healthcare systems, positioning traceable, allergen-free protein as a procurement advantage. These regional contrasts reveal how infrastructure, formulation tier, and buyer models shape the growth curve.
The report provides insights across 40+ countries and regions. The three below are highlighted for their strategic influence and growth trajectory within the United States.
State-wise CAGR Comparison (2025-2035)
| State | CAGR (2025 to 2035) |
|---|---|
| North Dakota | 9.4% |
| California | 8.9% |
| Washington | 8.2% |
North Dakota is forecast to grow at a CAGR of 9.4%, the highest among USA states. Extensive acreage suitable for fava cultivation and ongoing investments in dry milling and protein isolation facilities are supporting this growth. State-led agricultural incentives and grower cooperatives have made fava bean contracts more attractive to producers.
The proximity to Canada’s pulse corridor has enabled shared processing capacity and cross-border logistics. As more food companies seek domestic, high-protein raw materials, North Dakota’s scale and farm partnerships are proving vital.
The fava bean protein industry in California is projected grow at a CAGR of 8.9% from 2025 to 2035. Innovation in alt-protein product development, driven by Silicon Valley and food-tech ecosystems, is accelerating demand. Fava protein is increasingly being used in dairy alternatives, nutritional powders, and clean-label meat substitutes.
Food processors in the Central Valley are adopting enzyme-based extraction to produce neutral-flavor concentrates. Rising consumer interest in allergen-free and non-GMO proteins is reinforcing the market’s expansion. California's consumer base and food R&D infrastructure provide a dual advantage.
The sales of fava bean protein in Washington are expected to grow at a CAGR of 8.2% through 2035. Crop diversification strategies in eastern Washington have included fava beans in rotation with wheat and lentils. Regional processors are investing in mechanical dehulling and protein concentrate lines to meet demand from plant-based food manufacturers.
Proximity to West Coast distribution hubs is helping fast-track commercial delivery to major retail chains. Local university research is also contributing to improved cultivar yields and protein consistency, supporting future product scaling.
The USA market has top, competitive players like AGT Food and Ingredients, Roquette Frères, and Puris Proteins focusing on expanding product portfolios and enhancing production capabilities. These companies leverage strategic partnerships and acquisitions to improve their market position. Cargill Inc. and ADM focus on broadening their reach through large-scale production and utilizing extensive distribution networks to serve industries ranging from food and beverages to animal feed.
Smaller players like Axiom Foods and The Scoular Company are tapping into niche markets by offering specialized products. The market remains fragmented, with both large corporations and smaller specialized firms competing on innovation and regional demand.
Recent Fava Bean Protein Industry News
| Report Attributes | Key Insights |
|---|---|
| Estimated Market Value (2025) | USD 231.9 million |
| Projected Market Value (2035) | USD 542.7 million |
| CAGR (2025 to 2035) | 8.9% |
| Base Year for Estimation | 2024 |
| Historical Period | 2020 to 2024 |
| Forecast Period | 2025 to 2035 |
| Quantitative Units | Revenue in USD million |
| Product Type | Protein Isolates, Protein Concentrates, Protein Flour |
| Processing Method | Wet Processing, Dry Processing |
| Grade | Food Grade, Feed Grade |
| Application | Meat Alternatives, Bakery Products, Beverages, Sports Nutrition, Snacks & Cereals, Other Applications |
| States Covered | California, North Dakota, Washington |
| Key Players | AGT Food and Ingredients, Roquette Frères, Puris Proteins, Vestkorn Milling, Ingredion Inc., Axiom Foods, Cambridge Commodities, The Scoular Company, Cargill Inc., ADM (Archer Daniels Midland) |
| Additional Attributes | Dollar sales, CAGR trends, product type distribution, size preferences, price range segmentation, competitor dollar sales & market share, regional growth patterns |
The segmentation is into protein isolates, protein concentrates, and protein flour.
The segmentation is into wet processing and dry processing.
The segmentation is into food grade and feed grade.
The segmentation is into meat alternatives, bakery products, beverages, sports nutrition, snacks & cereals, and other applications.
The market is valued at USD 231.9 million in 2025.
The market is expected to expand at a CAGR of 8.9% from 2025 to 2035.
Protein isolates lead the product type segment with a 43% market share in 2025.
Wet processing holds the top position with a 58.4% share in 2025.
North Dakota is growing the fastest with a projected CAGR of 9.4% from 2025 to 2035.


Our Research Products

The "Full Research Suite" delivers actionable market intel, deep dives on markets or technologies, so clients act faster, cut risk, and unlock growth.

The Leaderboard benchmarks and ranks top vendors, classifying them as Established Leaders, Leading Challengers, or Disruptors & Challengers.

Locates where complements amplify value and substitutes erode it, forecasting net impact by horizon

We deliver granular, decision-grade intel: market sizing, 5-year forecasts, pricing, adoption, usage, revenue, and operational KPIs—plus competitor tracking, regulation, and value chains—across 60 countries broadly.

Spot the shifts before they hit your P&L. We track inflection points, adoption curves, pricing moves, and ecosystem plays to show where demand is heading, why it is changing, and what to do next across high-growth markets and disruptive tech

Real-time reads of user behavior. We track shifting priorities, perceptions of today’s and next-gen services, and provider experience, then pace how fast tech moves from trial to adoption, blending buyer, consumer, and channel inputs with social signals (#WhySwitch, #UX).

Partner with our analyst team to build a custom report designed around your business priorities. From analysing market trends to assessing competitors or crafting bespoke datasets, we tailor insights to your needs.
Supplier Intelligence
Discovery & Profiling
Capacity & Footprint
Performance & Risk
Compliance & Governance
Commercial Readiness
Who Supplies Whom
Scorecards & Shortlists
Playbooks & Docs
Category Intelligence
Definition & Scope
Demand & Use Cases
Cost Drivers
Market Structure
Supply Chain Map
Trade & Policy
Operating Norms
Deliverables
Buyer Intelligence
Account Basics
Spend & Scope
Procurement Model
Vendor Requirements
Terms & Policies
Entry Strategy
Pain Points & Triggers
Outputs
Pricing Analysis
Benchmarks
Trends
Should-Cost
Indexation
Landed Cost
Commercial Terms
Deliverables
Brand Analysis
Positioning & Value Prop
Share & Presence
Customer Evidence
Go-to-Market
Digital & Reputation
Compliance & Trust
KPIs & Gaps
Outputs
Full Research Suite comprises of:
Market outlook & trends analysis
Interviews & case studies
Strategic recommendations
Vendor profiles & capabilities analysis
5-year forecasts
8 regions and 60+ country-level data splits
Market segment data splits
12 months of continuous data updates
DELIVERED AS:
PDF EXCEL ONLINE
Fava Bean Protein Market Size and Share Forecast Outlook 2025 to 2035
United States Protein A Resins Market Trends – Size, Share & Growth 2025-2035
DOAS Industry Analysis in the United States Forecast and Outlook 2025 to 2035
United States Countertop Market Trends - Growth, Demand & Forecast 2025 to 2035
Industry Analysis of Lidding Film in the United States Size and Share Forecast Outlook 2025 to 2035
Chipless RFID Industry Analysis in United States Size and Share Forecast Outlook 2025 to 2035
Plastic Jar Industry Analysis in the United States Size and Share Forecast Outlook 2025 to 2035
Infant Formula Industry Analysis in United States Analysis - Size, Share, and Forecast Outlook 2025 to 2035
Degassing Valves Industry Analysis in United States & Canada - Size, Share, and Forecast 2025 to 2035
Solenoid Valve Market Growth – Trends & Forecast 2024-2034
US & Europe EndoAVF Device Market Analysis – Size, Share & Forecast 2024-2034
U.S. Laminated Tube Market Trends & Demand Forecast 2024-2034
Periodontal Gel Industry Analysis in the United States Size and Share Forecast Outlook 2025 to 2035
Merchandising Unit Industry Analysis in United States Size and Share Forecast Outlook 2025 to 2035
Paper Tubes & Core Industry Analysis in United States Trends, Size, and Forecast for 2025-2035
Stainless Steel IBC Industry Analysis in United States Insights - Trends & Forecast 2025 to 2035
Protective Packaging Industry Analysis in United States and Canada - Size, Share, and Forecast 2025 to 2035
Dialysis Equipment Industry Analysis in the United States Size and Share Forecast Outlook 2025 to 2035
Industry Analysis Non-commercial Acrylic Paint in the United States Size and Share Forecast Outlook 2025 to 2035
Hangover Cure Product Industry Analysis in United States Growth, Trends and Forecast from 2025 to 2035

Thank you!
You will receive an email from our Business Development Manager. Please be sure to check your SPAM/JUNK folder too.
Chat With
MaRIA