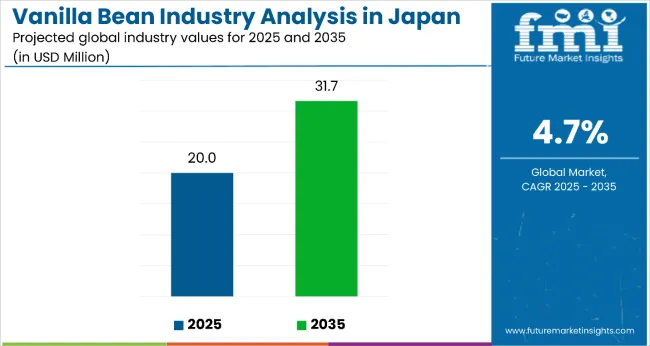
Sales of vanilla bean in Japan are estimated at USD 20.0 million in 2025, and are projected to reach USD 31.7 million by 2035, reflecting a CAGR of approximately 4.7% over the forecast period.
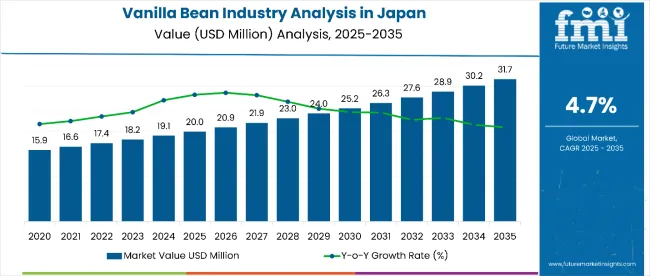
| Metric | Value |
|---|---|
| Estimated Value in (2025E) | USD 20 million |
| Forecast Value in (2035F) | USD 31.7 million |
| Forecast CAGR (2025 to 2035) | 4.7 |
This growth reflects expanding premium food culture and increased per capita consumption across major culinary centers throughout Japan. The rise in demand is linked to growing preference for authentic flavoring ingredients, heightened interest in artisanal food preparation, and evolving dessert and beverage innovation trends.
By 2025, per capita consumption in leading Japanese regions such as Kanto, Kinki, and Chubu averages between 0.08 to 0.12 grams, with projections reaching 0.12 to 0.18 grams by 2035. Kanto region leads among regional areas, expected to generate USD 14.2 million in vanilla bean sales by 2035, followed by Kinki region (USD 8.7 million), Chubu region (USD 5.1 million), Kyushu and Okinawa (USD 2.3 million), and Tohoku region (USD 1.3 million).
The largest contribution to demand continues to come from Madagascar vanilla varieties, which are expected to account for 32% of total sales in 2025, owing to superior flavor profiles, established reputation for quality, and preference among professional chefs and premium food manufacturers. By form classification, extract formulations represent the dominant category, responsible for 67.3% of all sales, while whole bean and ground forms are expanding steadily across specialty applications.
Consumer adoption is particularly concentrated among culinary professionals and premium food enthusiasts, with urbanization levels and disposable income emerging as significant drivers of demand. While pricing remains premium, the average cost differential between different origin varieties has stabilized around 15-25% in 2025. Continued improvements in supply chain efficiency and specialty distribution are expected to accelerate accessibility across diverse culinary segments. Regional disparities persist, but per capita demand in rural areas is narrowing the gap with traditionally strong metropolitan consumption patterns.
The vanilla bean in Japan is classified into several categories. The distribution channel segment covers direct, online retailer, specialty store, supermarket/hypermarket, and wholesaler. The form segment comprises ground and whole. The nature segment includes conventional and organic. The product variety segment covers Indian, Indonesia, Madagascar, Mexican, Tahitian. By region, areas such as Kanto, Chubu, Kinki, Kyushu & Okinawa, Tohoku, and Rest of Japan are analyzed comprehensively.
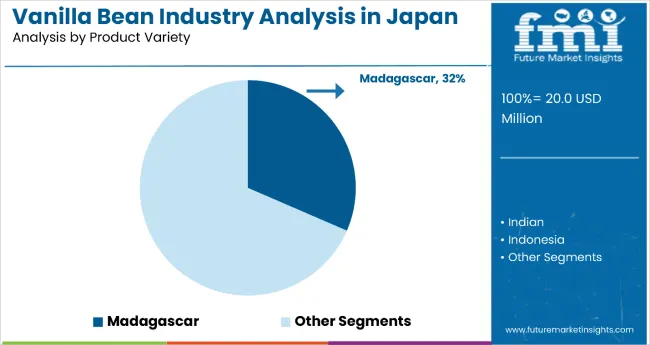
Madagascar vanilla varieties are projected to dominate sales in 2025, supported by superior flavor complexity, established quality reputation, and widespread preference among professional chefs and premium food manufacturers. Other varieties such as Tahitian, Mexican, and Indonesian origins are growing steadily, each serving distinct flavor profile requirements.
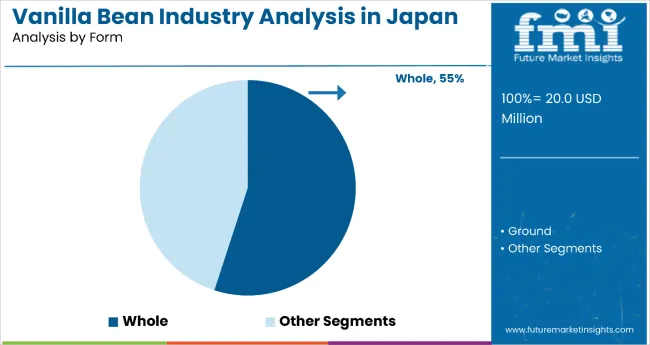
Vanilla bean in Japan is utilized across whole bean, extract, and ground forms. Whole bean applications are expected to remain the primary format in 2025, followed by extract formulations and ground preparations. Product form strategies are evolving to match Japanese food preferences for authentic presentation, premium ingredient appeal, and versatility in both traditional and innovative culinary applications.
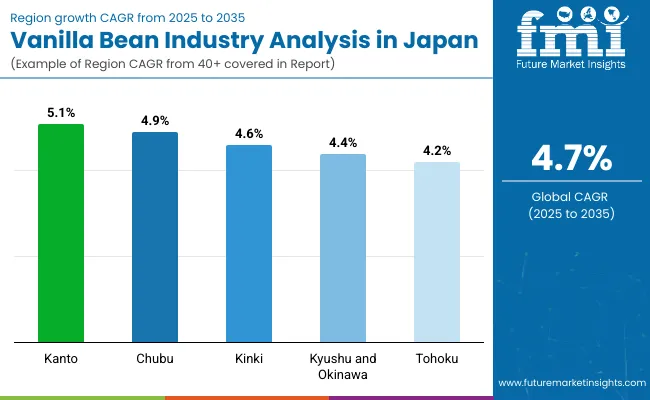
| Region | CAGR (2025 to 2035) |
| Kanto | 5.1% |
| Chubu | 4.9% |
| Kinki | 4.6% |
| Kyushu and Okinawa | 4.4% |
| Tohoku | 4.2% |
Among the five leading Japanese regions, Kanto holds the highest growth trajectory with a CAGR of 5.1%, cementing its dominance through strong urban demand, premium culinary culture, and large-scale commercial adoption. Chubu follows closely with a CAGR of 4.9%, fueled by a booming artisanal dessert and luxury hospitality integration.
Kinki ranks third at 4.6%, leveraging its fusion of traditional and modern confectionery trends. Kyushu & Okinawa post a CAGR of 4.4%, driven primarily by tourism-linked premium dessert demand and hospitality collaborations. Tohoku, while growing at a more modest CAGR of 4.2%, is building momentum through tourism exposure, culinary education, and gradual consumer adoption of premium vanilla products.
Vanilla bean sales will not grow uniformly across every Japanese region. Rising culinary sophistication and faster adoption of premium ingredients in major metropolitan areas give Kanto and Chubu regions a measurable edge, while traditional regions such as Tohoku expand more gradually from lower baseline consumption. The table below shows the compound annual growth rate (CAGR) each of the five key regions is expected to record between 2025 and 2035.
Sales of vanilla bean in Kanto are projected to grow at a CAGR of 5.1%, supported by its status as the nation’s largest metropolitan hub with Tokyo at the center. It reflects sustained demand growth fueled by high disposable incomes, a sophisticated culinary culture, and strong professional training institutions driving premium ingredient adoption. The region’s leadership in dessert innovation and artisanal baking fuels demand for both whole bean and extract formats.
Commercial food manufacturers and beverage chains are increasingly sourcing high-quality vanilla to meet consumer expectations for authentic flavor. High-end supermarkets and specialty retailers are expanding vanilla offerings. The presence of luxury patisseries and hotel dining reinforces leadership. Strategic collaborations with global vanilla suppliers ensure consistent supply. Kanto’s focus on quality and innovation positions it as a long-term growth driver.
Revenue from vanilla bean in Chubu is expanding rapidlyat a CAGR 4.9%, driven by deep-rooted culinary traditions and rising artisanal dessert culture. Nagoya and surrounding cities are seeing a surge in specialty bakeries, dessert cafés, and gourmet chocolate production. The region’s preference for Madagascar and Tahitian vanilla appeals to consumers seeking luxury flavors.
Culinary schools and training programs are introducing advanced pastry techniques, boosting usage. Specialty food stores and gourmet supermarkets are widening access to vanilla products. Luxury hospitality venues are integrating vanilla into signature menus. Wholesalers are adapting to supply boutique dessert businesses. Chubu’s balance of tradition and innovation supports strong growth potential.
Sales of vanilla bean in Kinki are projected to grow at a CAGR of 4.6%,due to modern food scene and Kyoto’s heritage-based dessert culture creating steady demand for both whole beans and extracts. Premium hotels, patisseries, and event caterers use vanilla to add authenticity and luxury appeal. Seasonal cultural festivals and gifting traditions drive peak-period sales.
High-end supermarkets are increasing vanilla product availability. Chefs and artisans are experimenting with fusion recipes blending Japanese and European styles. This adaptability ensures vanilla’s presence in diverse menus. Kinki’s culinary reputation strengthens its long-term position in the vanilla sector.
Kyushu and Okinawa’s vanilla bean consumption is expected to grow at a CAGR of 4.4%, fueled by tourism and resort-driven dining demand. Luxury hotels, seaside restaurants, and dessert cafés serving international and domestic visitors are incorporating premium vanilla into menus. Fusion desserts combining tropical fruits with vanilla appeal to travelers.
Fukuoka’s urban retail expansion increases vanilla accessibility. Imports from Madagascar and Indonesia dominate due to quality and supply consistency. Collaborations with hospitality brands elevate the region’s dessert offerings. Tourism seasonality aligns with dessert sales peaks, supporting steady growth.
Sales forvanilla bean in Tohoku are expected to growat a CAGR of 4.2%,due to tourism and culinary education introducing consumers to authentic vanilla flavors, with regional bakeries and cafés experimenting with premium ingredients. Scenic tourism destinations promote gourmet dining experiences featuring Madagascar and Mexican varieties.
Culinary schools train students in global pastry techniques, fueling future demand. Specialty and online retail channels are expanding availability. Local events and catering services are using vanilla in luxury desserts. While growth is slower than in other regions, awareness is rising, setting a foundation for long-term adoption.
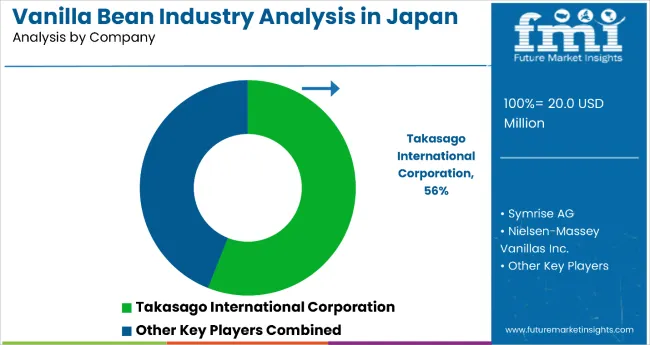
The competitive environment is characterized by a mix of international flavor companies and specialized vanilla traders. Quality sourcing rather than pure scale remains the decisive success factor: the five largest suppliers collectively serve more than 3,000 food manufacturers and culinary professionals nationwide and account for a majority of both commercial and specialty distribution in the category.
Takasago International Corporation is the most established domestic participant. As a leading fragrance and flavor company, the organization offers comprehensive vanilla ingredient solutions, all meeting Japanese food safety standards. Its core range of natural flavor compounds gives it deep penetration in food processing channels while maintaining full coverage through specialty culinary suppliers and professional distributors.
Symrise AG, with global vanilla sourcing expertise, leverages international supply networks to place premium vanilla varieties in high-end applications and luxury food manufacturing. Recent investments in sustainable sourcing programs have allowed Symrise to introduce ethically sourced variants positioned for environmentally conscious food producers, reinforcing its role as a responsibility-focused supplier.
Nielsen-Massey Vanillas, specializing in premium vanilla products, benefits from artisanal positioning inside a comprehensive vanilla portfolio and from technical partnerships with Japanese culinary professionals. Recent product innovations under craft vanilla platforms extend Nielsen-Massey beyond basic extracts into specialized formulations targeting specific culinary applications and flavor requirements.
The next tier comprises European vanilla specialists and regional importers. Eurovanille focuses on Madagascar origin products for professional culinary applications, recent expansion initiatives showed growth in restaurant and pastry segments, signaling established positioning in premium B2B channels. Synergy Flavors, expanding through custom formulation capabilities, adds specialized vanilla solutions to growing food innovation supply chains and is expected to benefit from increasing demand for unique flavor profiles.
Private-label programs at major Japanese food retailers including AEON and Ito-Yokado are widening consumer access at price points 10-20% below branded equivalents, putting margin pressure on smaller suppliers while supporting household adoption. Consolidation is therefore likely to continue as sourcing expertise and quality certification become critical for maintaining culinary partnerships and professional acceptance in this flavor-focused category.
Key Developments
| Item | Value |
| Quantitative Units (2025) | USD 20.0 Million |
| By Distribution Channel | Direct, Online Retailer, Specialty Store, Supermarket / Hypermarket, and Wholesaler |
| By Form | Ground and Whole |
| By Nature | Conventional and Organic |
| By Product Variety | Indian, Indonesia, Madagascar, Mexican, Other, and Tahitian |
| Regions Covered | Japan (National-level analysis) |
| Country Covered | Japan (Kanto, Kansai, Hokkaido, Tohoku, Chugoku, Shikoku, Kyushu & Okinawa) |
| Top Companies Profiled | Symrise AG, Eurovanille, Takasago International Corp., Synergy Flavors Inc., Archer Daniels Midland Co., Venui Vanilla, Nielsen-Massey Vanillas Inc., Tharakan and Company, Lemur International Inc., and Apex Flavors Inc. |
| Additional Attributes | Growing demand for natural flavoring in premium confectionery & bakery, rising application in high-end cosmetics & perfumes, growth in artisanal ice cream & beverage segments, focus on sustainable & traceable sourcing, technological improvements in curing & processing |
The global vanilla bean industry analysis in Japan is estimated to be valued at USD 20.0 million in 2025.
The market size for the vanilla bean industry analysis in Japan is projected to reach USD 31.0 million by 2035.
The vanilla bean industry analysis in Japan is expected to grow at a 4.5% CAGR between 2025 and 2035.
The key product types in vanilla bean industry analysis in Japan are direct, online retailer, specialty store, supermarket / hypermarket and wholesaler.
In terms of form, ground segment to command 55.3% share in the vanilla bean industry analysis in Japan in 2025.


Our Research Products

The "Full Research Suite" delivers actionable market intel, deep dives on markets or technologies, so clients act faster, cut risk, and unlock growth.

The Leaderboard benchmarks and ranks top vendors, classifying them as Established Leaders, Leading Challengers, or Disruptors & Challengers.

Locates where complements amplify value and substitutes erode it, forecasting net impact by horizon

We deliver granular, decision-grade intel: market sizing, 5-year forecasts, pricing, adoption, usage, revenue, and operational KPIs—plus competitor tracking, regulation, and value chains—across 60 countries broadly.

Spot the shifts before they hit your P&L. We track inflection points, adoption curves, pricing moves, and ecosystem plays to show where demand is heading, why it is changing, and what to do next across high-growth markets and disruptive tech

Real-time reads of user behavior. We track shifting priorities, perceptions of today’s and next-gen services, and provider experience, then pace how fast tech moves from trial to adoption, blending buyer, consumer, and channel inputs with social signals (#WhySwitch, #UX).

Partner with our analyst team to build a custom report designed around your business priorities. From analysing market trends to assessing competitors or crafting bespoke datasets, we tailor insights to your needs.
Supplier Intelligence
Discovery & Profiling
Capacity & Footprint
Performance & Risk
Compliance & Governance
Commercial Readiness
Who Supplies Whom
Scorecards & Shortlists
Playbooks & Docs
Category Intelligence
Definition & Scope
Demand & Use Cases
Cost Drivers
Market Structure
Supply Chain Map
Trade & Policy
Operating Norms
Deliverables
Buyer Intelligence
Account Basics
Spend & Scope
Procurement Model
Vendor Requirements
Terms & Policies
Entry Strategy
Pain Points & Triggers
Outputs
Pricing Analysis
Benchmarks
Trends
Should-Cost
Indexation
Landed Cost
Commercial Terms
Deliverables
Brand Analysis
Positioning & Value Prop
Share & Presence
Customer Evidence
Go-to-Market
Digital & Reputation
Compliance & Trust
KPIs & Gaps
Outputs
Full Research Suite comprises of:
Market outlook & trends analysis
Interviews & case studies
Strategic recommendations
Vendor profiles & capabilities analysis
5-year forecasts
8 regions and 60+ country-level data splits
Market segment data splits
12 months of continuous data updates
DELIVERED AS:
PDF EXCEL ONLINE
Vanilla Bean Market Analysis - Size, Share, and Forecast Outlook 2025 to 2035
Korea Vanilla Bean Market Analysis byDistribution Channel, Form, Nature, Product Variety, and Region Through 2025 to 2035
Demand for Vanilla Bean in EU Size and Share Forecast Outlook 2025 to 2035
Western Europe Vanilla Bean Market Analysis by Distribution Channel, Form, Nature, Product Variety, and Country Through 2035
Japan Faith-based Tourism Market Size and Share Forecast Outlook 2025 to 2035
Japan Sports Tourism Market Size and Share Forecast Outlook 2025 to 2035
Japan Respiratory Inhaler Devices Market Size and Share Forecast Outlook 2025 to 2035
Japan Halal Tourism Market Size and Share Forecast Outlook 2025 to 2035
Japan Automated People Mover Industry Size and Share Forecast Outlook 2025 to 2035
Japan Automotive Load Floor Industry Analysis Size and Share Forecast Outlook 2025 to 2035
Bean Flour Market Size and Share Forecast Outlook 2025 to 2035
Japan Food Cling Film Market Size and Share Forecast Outlook 2025 to 2035
Japan Polypropylene Packaging Films Market Size and Share Forecast Outlook 2025 to 2035
Bean Ingredients Market Size and Share Forecast Outlook 2025 to 2035
Vanilla Extract Market Size and Share Forecast Outlook 2025 to 2035
Japan Probiotic Yogurt Market is segmented by product type, source type, nature type, flavor type, fat content, sales channel and key city/province through 2025 to 2035.
japan Tortilla Market - Growth, Trends and Forecast from 2025 to 2035
Japan Cosmetics ODM Market Analysis - Size, Share & Trends 2025 to 2035
Japan Automotive Turbocharger Market Insights – Demand, Size & Industry Trends 2025–2035
Japan Yeast Market Insights – Demand, Size & Industry Trends 2025–2035

Thank you!
You will receive an email from our Business Development Manager. Please be sure to check your SPAM/JUNK folder too.
Chat With
MaRIA