Reports

- Global Locations -

Headquarters

Future Market Insights, Inc.

Christiana Corporate, 200
Continental Drive, Suite 401,
Newark, Delaware - 19713,
United States

T: +1-845-579-5705

Americas

Future Market Insights, Inc.

616 Corporate Way, Suite 2-9018,
Valley Cottage, NY 10989, United States

T: +1-347-918-3531

MEA

Future Market Insights

1602-6 Jumeirah Bay X2 Tower, Plot No: JLT-PH2-X2A,
Jumeirah Lakes Towers, Dubai,
United Arab Emirates

Europe

Future Market Insights

3rd Floor, 207 Regent Street,
W1B 3HH London
United Kingdom

T: + 44 (0) 20 8123 9659
D: +44 (0) 20 3287 4268

Asia Pacific

Future Market Insights

IndiaLand Global Tech Park, Unit UG-1, Behind Grand HighStreet, Phase 1, Hinjawadi, MH, Pune – 411057, India

Bean Flour Market Snapshot (2023 to 2033)

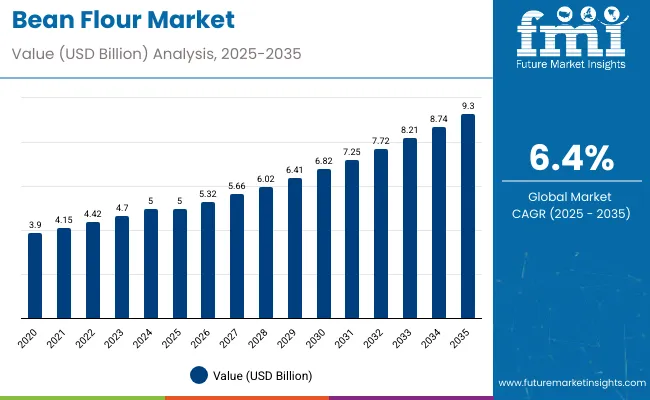
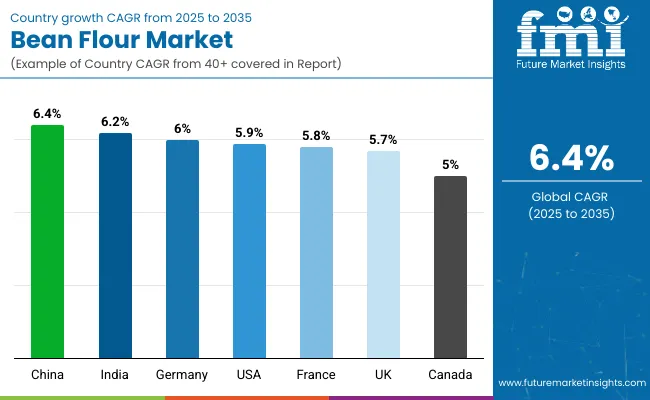
The global bean flour market is expected to be valued at US$ 2,788.7 million in 2023 and is projected to reach US$ 5,209.5 million by 2033. A CAGR worth 6.4% is expected for the market during the 2023 to 2033 forecast period.

Bean flours are made from crushed dried or even split beans. The white bean is an oblong and slightly flattened variation of the common bean. Black beans, often known as turtle beans, are widely consumed throughout Latin America. The name black beans refer to their shiny dark black color. Bean flour contains oxalate, chlorogenic acid, triterpenoid phytonutrients, fatty acids, flavonoids including delphinidin, malvidin, petunidin, kaempferol, and quercetin, hydroxycinnamic acids like ferulic and sinapic.

Data Points Key Statistics
Expected Market Value (2023) US$ 2788.7 million
Projected Forecast Value (2033) US$ 5209.5 million
Anticipated Growth Rate (2023 to 2033) 6.4%

Bean flour contains molybdenum, folate, and dietary fiber, as well as copper, phosphorus, manganese, vitamins, magnesium, proteins, and other nutrients. Black beans have numerous health benefits and are regarded as one of the world's healthiest foods.

Bean flour has health advantages such as cardiovascular disease prevention, lowering the risk of some forms of cancer, regulating blood sugar, improving gut health, and others, making it a favorite legume among health-conscious customers. Black beans are available all year, which aids in the continual availability of bean flour, meeting client demand in the global market. Such beneficial factors of these beans are expected to accelerate the growth in this industry from 2023 to 2033.

Don't pay for what you don't need

Customize your report by selecting specific countries or regions and save 30%!

What are the Major Factors Boosting the Bean Flour Market?

Bean flour is mostly pushed by health-conscious consumers since it has several health benefits such as preventing various heart diseases, lowering the risk of some types of cancer, improving gut function, regulating blood sugar levels, and others.

The high fibre content of black bean flour aids in the management of diabetes by lowering blood sugar levels. The high fibre content aids digestion by promoting gut microbiota health. Health products and protein drinks are becoming more popular among the younger population. Because they are high in protein and readily available, this trend is proving to be one of the primary drivers for the worldwide bean flour market.

Rising consumer awareness of the need for a healthy diet. The increasing need for delectable products for various occasions is driving demand for organic bean flour, which is one of the elements used in the creation of sweets. Healthy beverages or protein shakes consumption is on the rise among young people, which is one of the primary drivers of rising bean flour demand.

What are the Factors Hindering the Bean Flour Market?

Although beans have many health benefits, they do have some negative effects that can pose serious problems for consumers. Some people are allergic to legumes, which include a variety of beans. Consuming bean flour may result in nausea, abdominal pain, vomiting, and skin itching.

Beans contain a substance called purine, which, when broken down, produces excess uric acid, resulting in gout. Gout is a kind of arthritis characterized by uric acid crystals accumulating in the joints. Such adverse effects may negatively influence the worldwide bean flour market over the forecast period.

Nandini Roy Choudhury

Principal Consultant

Talk to Analyst

Find your sweet spots for generating winning opportunities in this market.

What is the Outlook of the Nature Type Segment of the Bean Flour Market?

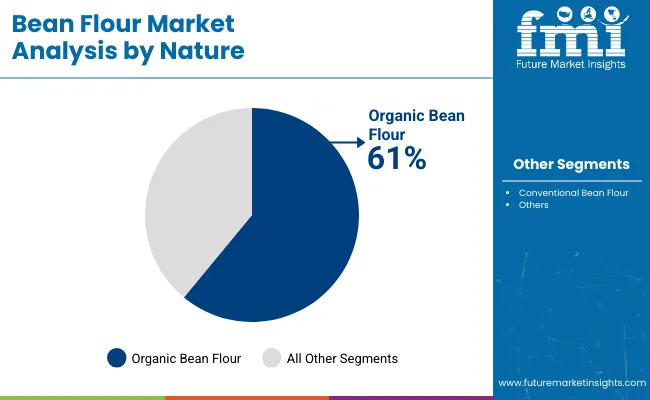
During the projected period of 2023 to 2033, the organic segment is expected to gain a global market share of 61% during the forecast period. Although beans have many health benefits, they do have some negative effects that can pose serious problems for consumers. Some people are allergic to legumes, which include a variety of beans. Consuming bean flour may result in nausea, abdominal pain, vomiting, and skin itching.

Beans contain a substance called purine, which, when broken down, produces excess uric acid, resulting in gout. Gout is a kind of arthritis characterized by uric acid crystals accumulating in the joints. Such adverse effects may negatively influence the worldwide bean flour market over the forecast period.

What is the Outlook of the North American Bean Flour Market?

In terms of market share and revenue, the North American market is expected to be the dominant market for bean flour during the projection period of 2023 to 2033. The analysts at Future Market Insights predict that by 2023, the market of bean flour in North America is expected to acquire a global market size of 28.3%.

The widespread usage of bean flour and the creation of related dishes are factors driving the growth of the North American bean flour market. Lifestyle changes, rising healthcare costs, and increased consumer health awareness have all fuelled market expansion. Emerging flour production markets include Central America, Latin America, Mexico, and the USA.

It is mostly used in baking applications in the North American market, particularly in the USA. In this market, bean flour is extensively used in pastries and desserts. Organic flour is the most popular flour in North America. When making a hard crust or a soft filling like a pizza or bagel, high-protein bean flour or high gluten are employed. Low-protein bean flour is used to manufacture soft crusts or baked products such as cookies and cakes, which is driving the expansion of the regional bean flour market.

Get the data you need at a Fraction of the cost

Personalize your report by choosing insights you need
and save 40%!

How is the European Market Driving Demand for Bean Flour?

By 2023, Europe is likely to hold approximately 25.4% of the global market share. This region is expected to be one of the fastest-growing markets for bean flour from 2023 to 2033.

The health benefits of bean flour and the growing preference for a healthy lifestyle are driving the expansion of the European bean flour market.

Customers increasingly seek clean, organic, and high-quality food goods, boosting demand for organic bean flour. In terms of nutrition, organic bean flour is high in vitamins, proteins, minerals, and fibers, and it is widely used in the production of cookies, pastries, muffins, and other bakery products.

The growing population's desire for healthier food options and rising disposable income have boosted the demand for organic bean flour. Organic food is growing rapidly in Europe's well-established countries, such as Germany, France, and the United Kingdom. Furthermore, favorable government laws promoting organic bean flour in the market are projected to drive market expansion.

What Can Be Expected From The Asia Pacific Region During The Forecast Period?

The Asia Pacific market for bean flour is expected to grow steadily during the forecast period. Consumers in Asia Pacific are increasingly using bean flour due to its health benefits and regulatory requirements. Several measures are being implemented to support food fortification to reduce malnutrition cases. Evolving healthy eating trends, expanding bean flour application in bakery goods and confectionaries, and the launch of products including bean flour as a component are pushing wheat flour demand across the Asia Pacific.

Bean manufacturers are releasing high-quality and exquisite kinds of bean flour into the market in response to the expanding market demand for bean flour products. Furthermore, the expansion of the food and beverage, cosmetics, and other industries is likely to drive demand for bean flour throughout the Asia Pacific.

Start-up scenario

The various start-ups in the market for bean flour are utilizing the ‘go organic’ trend and manufacturing organic bean flour. Along with this trend, the new companies aim to prosper within the vegan and plant-based market to attract more customers towards their brand.

Market Competition

The key players in this market include Nikken Foods, Xi’an Sost Biological Science & Technology Co. Ltd., Bob’s Red Mill Natural Foods, Damin Foodstuff (Zhangzhou) Co. Ltd., GreenMax S&F, Ottogi Co, Ltd., Vestkorn, Green Image Organic Sdn. Bhd.

  • Vestkorn sells fava bean flour, which has an excellent amino acid profile and can be used in place of wheat flour. The fava beans are extensively cleansed to remove any foreign contaminants and ensure no wheat or soybeans are present. The fava beans are next dehulled, with the kernels and hulls precisely removed to yield a pure kernel ready for processing. We receive a light­grey flour with a faint beany flavor after milling to the correct particle size. Vestkorn fava bean flour has approximately 30% protein and 48% carbs, making it a great protein source.
  • Nikken Foods provides Black Bean Powder - 7036, a vacuum-dried black bean paste prepared from fermented black soybeans on a maltodextrin carrier. It adds an authentic, full-flavored traditional Asian seasoning flavor to soups, salad dressings, sauces/marinades, dips, snacks, appetizers, and entrees, among other things.

Recent Developments

  • February 2023: The company, Eden Foods, announced the launch of a new line of bean flour products that are certified organic and gluten-free. The products are made from a variety of beans, including black beans, pinto beans, and kidney beans.
  • March 2023: The company, SunOpta, announced the expansion of its bean flour production capacity in North America. The expansion is in response to the growing demand for bean flour products, particularly in the gluten-free and vegan markets.
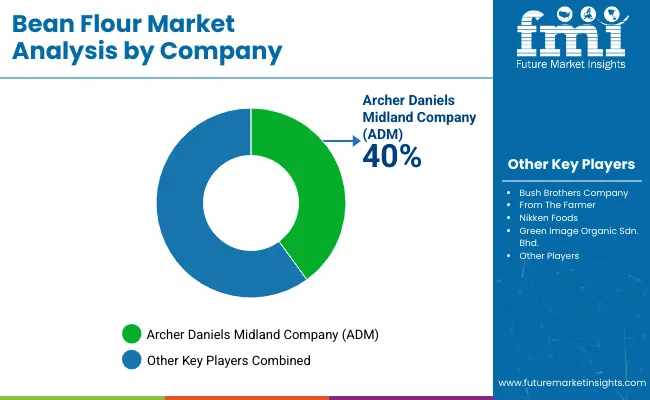
  • April 2023: The company, ADM, announced the launch of a new line of bean flour-based snacks. The snacks are made with a variety of bean flours, including pea flour, lentil flour, and chickpea flour.

Report Scope

Attribute Details
Growth Rate CAGR of 6.4% from 2023 to 2033
Market value in 2023 US$ 2,788.7 million
Market value in 2033 US$ 5,209.5 million
Base Year for Estimation 2023
Historical Data 2018 to 2022
Forecast Period 2023 to 2033
Quantitative Units US$ million for Value
Report Coverage Revenue Forecast, Volume Forecast, Company Ranking, Competitive Landscape, Growth Factors, Trends, and Pricing Analysis
Segments Covered
  • Product Type
  • Nature
  • Region
Regions Covered
  • North America
  • Latin America
  • Europe
  • East Asia
  • South Asia
  • Oceania
  • Middle East & Africa
Key Countries Profiled
  • United States of America
  • Canada
  • Brazil
  • Mexico
  • Argentina
  • Germany
  • Italy
  • France
  • United Kingdom
  • Spain
  • Russia
  • India
  • Thailand
  • Malaysia
  • Indonesia
  • China
  • Japan
  • South Korea
  • Australia
  • New Zealand
  • GCC Countries
  • South Africa
Key Companies Profiled
  • Nikken Foods
  • Xi’an Sost Biological Science & Technology Co. Ltd.
  • Bob’s Red Mill Natural Food
  • Damin Foodstuff (Zhangzhou) Co. Ltd.
  • GreenMax S&F
  • Ottogi Co, Ltd.
  • Green Image Organic Sdn. Bhd.
Customization Scope Available on Request

Key Segments Profiled In the Global Bean Flour Market Report

By Product Type:

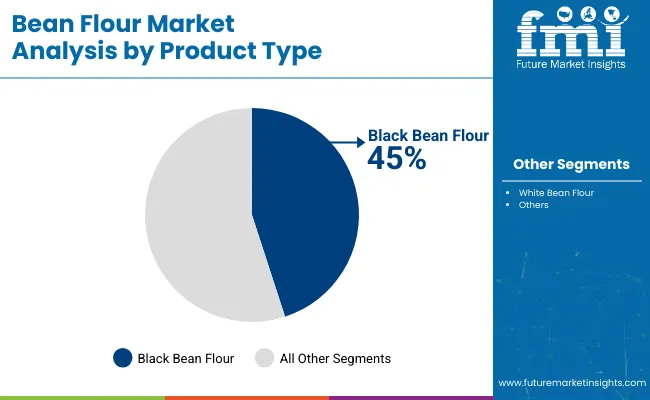
  • Black
  • White

By Nature:

  • Conventional
  • Organic

By Region:

  • North America
  • Latin America
  • Europe
  • East Asia
  • South Asia
  • Oceania
  • Middle East & Africa

Frequently Asked Questions

How big is the Bean Flour market? 

The market is valued at US$ 2.7 billion in 2023. 

Who are the key market players? 

Nikken Foods, GreenMax S&F, and Ottogi Co, Ltd. are key market players. 

Which is the key segment by nature? 

Organic segment dominates the bean flour market. 

What opportunities await the market players? 

The increasing need for delectable products for various occasions to boost the growth.

What is North America’s market share? 

North America will hold a 28.3% share in 2023. 

Table of Content

1. Executive Summary

    1.1. Global Market Outlook

    1.2. Demand-side Trends

    1.3. Supply-side Trends

    1.4. Technology Roadmap Analysis

    1.5. Analysis and Recommendations

2. Market Overview

    2.1. Market Coverage / Taxonomy

    2.2. Market Definition / Scope / Limitations

3. Market Background

    3.1. Market Dynamics

        3.1.1. Drivers

        3.1.2. Restraints

        3.1.3. Opportunity

        3.1.4. Trends

    3.2. Scenario Forecast

        3.2.1. Demand in Optimistic Scenario

        3.2.2. Demand in Likely Scenario

        3.2.3. Demand in Conservative Scenario

    3.3. Opportunity Map Analysis

    3.4. Product Life Cycle Analysis

    3.5. Supply Chain Analysis

        3.5.1. Supply Side Participants and their Roles

            3.5.1.1. Producers

            3.5.1.2. Mid-Level Participants (Traders/ Agents/ Brokers)

            3.5.1.3. Wholesalers and Distributors

        3.5.2. Value Added and Value Created at Node in the Supply Chain

        3.5.3. List of Raw Material Suppliers

        3.5.4. List of Existing and Potential Buyer’s

    3.6. Investment Feasibility Matrix

    3.7. Value Chain Analysis

        3.7.1. Profit Margin Analysis

        3.7.2. Wholesalers and Distributors

        3.7.3. Retailers

    3.8. PESTLE and Porter’s Analysis

    3.9. Regulatory Landscape

        3.9.1. By Key Regions

        3.9.2. By Key Countries

    3.10. Regional Parent Market Outlook

    3.11. Production and Consumption Statistics

    3.12. Import and Export Statistics

4. Global Market Analysis 2018 to 2022 and Forecast, 2023 to 2033

    4.1. Historical Market Size Value (US$ Million) & Volume (Tons) Analysis, 2018 to 2022

    4.2. Current and Future Market Size Value (US$ Million) & Volume (Tons) Projections, 2023 to 2033

        4.2.1. Y-o-Y Growth Trend Analysis

        4.2.2. Absolute $ Opportunity Analysis

5. Global Market Analysis 2018 to 2022 and Forecast 2023 to 2033, By Product Type

    5.1. Introduction / Key Findings

    5.2. Historical Market Size Value (US$ Million) & Volume (Tons) Analysis By Product Type, 2018 to 2022

    5.3. Current and Future Market Size Value (US$ Million) & Volume (Tons) Analysis and Forecast By Product Type, 2023 to 2033

        5.3.1. Black Bean Flour

        5.3.2. White Bean Flour

    5.4. Y-o-Y Growth Trend Analysis By Product Type, 2018 to 2022

    5.5. Absolute $ Opportunity Analysis By Product Type, 2023 to 2033

6. Global Market Analysis 2018 to 2022 and Forecast 2023 to 2033, By Nature

    6.1. Introduction / Key Findings

    6.2. Historical Market Size Value (US$ Million) & Volume (Tons) Analysis By Nature, 2018 to 2022

    6.3. Current and Future Market Size Value (US$ Million) & Volume (Tons) Analysis and Forecast By Nature, 2023 to 2033

        6.3.1. Conventional Bean Flour

        6.3.2. Organic Bean Flour

    6.4. Y-o-Y Growth Trend Analysis By Nature, 2018 to 2022

    6.5. Absolute $ Opportunity Analysis By Nature, 2023 to 2033

7. Global Market Analysis 2018 to 2022 and Forecast 2023 to 2033, By Region

    7.1. Introduction

    7.2. Historical Market Size Value (US$ Million) & Volume (Tons) Analysis By Region, 2018 to 2022

    7.3. Current Market Size Value (US$ Million) & Volume (Tons) Analysis and Forecast By Region, 2023 to 2033

        7.3.1. North America

        7.3.2. Latin America

        7.3.3. Western Europe

        7.3.4. Eastern Europe

        7.3.5. South Asia and Pacific

        7.3.6. East Asia

        7.3.7. Middle East and Africa

    7.4. Market Attractiveness Analysis By Region

8. North America Market Analysis 2018 to 2022 and Forecast 2023 to 2033, By Country

    8.1. Historical Market Size Value (US$ Million) & Volume (Tons) Trend Analysis By Market Taxonomy, 2018 to 2022

    8.2. Market Size Value (US$ Million) & Volume (Tons) Forecast By Market Taxonomy, 2023 to 2033

        8.2.1. By Country

            8.2.1.1. USA

            8.2.1.2. Canada

        8.2.2. By Product Type

        8.2.3. By Nature

    8.3. Market Attractiveness Analysis

        8.3.1. By Country

        8.3.2. By Product Type

        8.3.3. By Nature

    8.4. Key Takeaways

9. Latin America Market Analysis 2018 to 2022 and Forecast 2023 to 2033, By Country

    9.1. Historical Market Size Value (US$ Million) & Volume (Tons) Trend Analysis By Market Taxonomy, 2018 to 2022

    9.2. Market Size Value (US$ Million) & Volume (Tons) Forecast By Market Taxonomy, 2023 to 2033

        9.2.1. By Country

            9.2.1.1. Brazil

            9.2.1.2. Mexico

            9.2.1.3. Rest of Latin America

        9.2.2. By Product Type

        9.2.3. By Nature

    9.3. Market Attractiveness Analysis

        9.3.1. By Country

        9.3.2. By Product Type

        9.3.3. By Nature

    9.4. Key Takeaways

10. Western Europe Market Analysis 2018 to 2022 and Forecast 2023 to 2033, By Country

    10.1. Historical Market Size Value (US$ Million) & Volume (Tons) Trend Analysis By Market Taxonomy, 2018 to 2022

    10.2. Market Size Value (US$ Million) & Volume (Tons) Forecast By Market Taxonomy, 2023 to 2033

        10.2.1. By Country

            10.2.1.1. Germany

            10.2.1.2. UK

            10.2.1.3. France

            10.2.1.4. Spain

            10.2.1.5. Italy

            10.2.1.6. Rest of Western Europe

        10.2.2. By Product Type

        10.2.3. By Nature

    10.3. Market Attractiveness Analysis

        10.3.1. By Country

        10.3.2. By Product Type

        10.3.3. By Nature

    10.4. Key Takeaways

11. Eastern Europe Market Analysis 2018 to 2022 and Forecast 2023 to 2033, By Country

    11.1. Historical Market Size Value (US$ Million) & Volume (Tons) Trend Analysis By Market Taxonomy, 2018 to 2022

    11.2. Market Size Value (US$ Million) & Volume (Tons) Forecast By Market Taxonomy, 2023 to 2033

        11.2.1. By Country

            11.2.1.1. Poland

            11.2.1.2. Russia

            11.2.1.3. Czech Republic

            11.2.1.4. Romania

            11.2.1.5. Rest of Eastern Europe

        11.2.2. By Product Type

        11.2.3. By Nature

    11.3. Market Attractiveness Analysis

        11.3.1. By Country

        11.3.2. By Product Type

        11.3.3. By Nature

    11.4. Key Takeaways

12. South Asia and Pacific Market Analysis 2018 to 2022 and Forecast 2023 to 2033, By Country

    12.1. Historical Market Size Value (US$ Million) & Volume (Tons) Trend Analysis By Market Taxonomy, 2018 to 2022

    12.2. Market Size Value (US$ Million) & Volume (Tons) Forecast By Market Taxonomy, 2023 to 2033

        12.2.1. By Country

            12.2.1.1. India

            12.2.1.2. Bangladesh

            12.2.1.3. Australia

            12.2.1.4. New Zealand

            12.2.1.5. Rest of South Asia and Pacific

        12.2.2. By Product Type

        12.2.3. By Nature

    12.3. Market Attractiveness Analysis

        12.3.1. By Country

        12.3.2. By Product Type

        12.3.3. By Nature

    12.4. Key Takeaways

13. East Asia Market Analysis 2018 to 2022 and Forecast 2023 to 2033, By Country

    13.1. Historical Market Size Value (US$ Million) & Volume (Tons) Trend Analysis By Market Taxonomy, 2018 to 2022

    13.2. Market Size Value (US$ Million) & Volume (Tons) Forecast By Market Taxonomy, 2023 to 2033

        13.2.1. By Country

            13.2.1.1. China

            13.2.1.2. Japan

            13.2.1.3. South Korea

        13.2.2. By Product Type

        13.2.3. By Nature

    13.3. Market Attractiveness Analysis

        13.3.1. By Country

        13.3.2. By Product Type

        13.3.3. By Nature

    13.4. Key Takeaways

14. Middle East and Africa Market Analysis 2018 to 2022 and Forecast 2023 to 2033, By Country

    14.1. Historical Market Size Value (US$ Million) & Volume (Tons) Trend Analysis By Market Taxonomy, 2018 to 2022

    14.2. Market Size Value (US$ Million) & Volume (Tons) Forecast By Market Taxonomy, 2023 to 2033

        14.2.1. By Country

            14.2.1.1. GCC Countries

            14.2.1.2. South Africa

            14.2.1.3. Israel

            14.2.1.4. Rest of MEA

        14.2.2. By Product Type

        14.2.3. By Nature

    14.3. Market Attractiveness Analysis

        14.3.1. By Country

        14.3.2. By Product Type

        14.3.3. By Nature

    14.4. Key Takeaways

15. Key Countries Market Analysis

    15.1. USA

        15.1.1. Pricing Analysis

        15.1.2. Market Share Analysis, 2022

            15.1.2.1. By Product Type

            15.1.2.2. By Nature

    15.2. Canada

        15.2.1. Pricing Analysis

        15.2.2. Market Share Analysis, 2022

            15.2.2.1. By Product Type

            15.2.2.2. By Nature

    15.3. Brazil

        15.3.1. Pricing Analysis

        15.3.2. Market Share Analysis, 2022

            15.3.2.1. By Product Type

            15.3.2.2. By Nature

    15.4. Mexico

        15.4.1. Pricing Analysis

        15.4.2. Market Share Analysis, 2022

            15.4.2.1. By Product Type

            15.4.2.2. By Nature

    15.5. Germany

        15.5.1. Pricing Analysis

        15.5.2. Market Share Analysis, 2022

            15.5.2.1. By Product Type

            15.5.2.2. By Nature

    15.6. UK

        15.6.1. Pricing Analysis

        15.6.2. Market Share Analysis, 2022

            15.6.2.1. By Product Type

            15.6.2.2. By Nature

    15.7. France

        15.7.1. Pricing Analysis

        15.7.2. Market Share Analysis, 2022

            15.7.2.1. By Product Type

            15.7.2.2. By Nature

    15.8. Spain

        15.8.1. Pricing Analysis

        15.8.2. Market Share Analysis, 2022

            15.8.2.1. By Product Type

            15.8.2.2. By Nature

    15.9. Italy

        15.9.1. Pricing Analysis

        15.9.2. Market Share Analysis, 2022

            15.9.2.1. By Product Type

            15.9.2.2. By Nature

    15.10. Poland

        15.10.1. Pricing Analysis

        15.10.2. Market Share Analysis, 2022

            15.10.2.1. By Product Type

            15.10.2.2. By Nature

    15.11. Russia

        15.11.1. Pricing Analysis

        15.11.2. Market Share Analysis, 2022

            15.11.2.1. By Product Type

            15.11.2.2. By Nature

    15.12. Czech Republic

        15.12.1. Pricing Analysis

        15.12.2. Market Share Analysis, 2022

            15.12.2.1. By Product Type

            15.12.2.2. By Nature

    15.13. Romania

        15.13.1. Pricing Analysis

        15.13.2. Market Share Analysis, 2022

            15.13.2.1. By Product Type

            15.13.2.2. By Nature

    15.14. India

        15.14.1. Pricing Analysis

        15.14.2. Market Share Analysis, 2022

            15.14.2.1. By Product Type

            15.14.2.2. By Nature

    15.15. Bangladesh

        15.15.1. Pricing Analysis

        15.15.2. Market Share Analysis, 2022

            15.15.2.1. By Product Type

            15.15.2.2. By Nature

    15.16. Australia

        15.16.1. Pricing Analysis

        15.16.2. Market Share Analysis, 2022

            15.16.2.1. By Product Type

            15.16.2.2. By Nature

    15.17. New Zealand

        15.17.1. Pricing Analysis

        15.17.2. Market Share Analysis, 2022

            15.17.2.1. By Product Type

            15.17.2.2. By Nature

    15.18. China

        15.18.1. Pricing Analysis

        15.18.2. Market Share Analysis, 2022

            15.18.2.1. By Product Type

            15.18.2.2. By Nature

    15.19. Japan

        15.19.1. Pricing Analysis

        15.19.2. Market Share Analysis, 2022

            15.19.2.1. By Product Type

            15.19.2.2. By Nature

    15.20. South Korea

        15.20.1. Pricing Analysis

        15.20.2. Market Share Analysis, 2022

            15.20.2.1. By Product Type

            15.20.2.2. By Nature

    15.21. GCC Countries

        15.21.1. Pricing Analysis

        15.21.2. Market Share Analysis, 2022

            15.21.2.1. By Product Type

            15.21.2.2. By Nature

    15.22. South Africa

        15.22.1. Pricing Analysis

        15.22.2. Market Share Analysis, 2022

            15.22.2.1. By Product Type

            15.22.2.2. By Nature

    15.23. Israel

        15.23.1. Pricing Analysis

        15.23.2. Market Share Analysis, 2022

            15.23.2.1. By Product Type

            15.23.2.2. By Nature

16. Market Structure Analysis

    16.1. Competition Dashboard

    16.2. Competition Benchmarking

    16.3. Market Share Analysis of Top Players

        16.3.1. By Regional

        16.3.2. By Product Type

        16.3.3. By Nature

17. Competition Analysis

    17.1. Competition Deep Dive

        17.1.1. The Parade Company

            17.1.1.1. Overview

            17.1.1.2. Product Portfolio

            17.1.1.3. Profitability by Market Segments

            17.1.1.4. Sales Footprint

            17.1.1.5. Strategy Overview

                17.1.1.5.1. Marketing Strategy

                17.1.1.5.2. Product Strategy

                17.1.1.5.3. Channel Strategy

        17.1.2. GreenMax SandF

            17.1.2.1. Overview

            17.1.2.2. Product Portfolio

            17.1.2.3. Profitability by Market Segments

            17.1.2.4. Sales Footprint

            17.1.2.5. Strategy Overview

                17.1.2.5.1. Marketing Strategy

                17.1.2.5.2. Product Strategy

                17.1.2.5.3. Channel Strategy

        17.1.3. Ottogi Co, Ltd

            17.1.3.1. Overview

            17.1.3.2. Product Portfolio

            17.1.3.3. Profitability by Market Segments

            17.1.3.4. Sales Footprint

            17.1.3.5. Strategy Overview

                17.1.3.5.1. Marketing Strategy

                17.1.3.5.2. Product Strategy

                17.1.3.5.3. Channel Strategy

        17.1.4. Damin Foodstuff (Zhangzhou) Co. Ltd.

            17.1.4.1. Overview

            17.1.4.2. Product Portfolio

            17.1.4.3. Profitability by Market Segments

            17.1.4.4. Sales Footprint

            17.1.4.5. Strategy Overview

                17.1.4.5.1. Marketing Strategy

                17.1.4.5.2. Product Strategy

                17.1.4.5.3. Channel Strategy

        17.1.5. Xi’an Sost Biological Science and Technology

            17.1.5.1. Overview

            17.1.5.2. Product Portfolio

            17.1.5.3. Profitability by Market Segments

            17.1.5.4. Sales Footprint

            17.1.5.5. Strategy Overview

                17.1.5.5.1. Marketing Strategy

                17.1.5.5.2. Product Strategy

                17.1.5.5.3. Channel Strategy

        17.1.6. Verde Valle

            17.1.6.1. Overview

            17.1.6.2. Product Portfolio

            17.1.6.3. Profitability by Market Segments

            17.1.6.4. Sales Footprint

            17.1.6.5. Strategy Overview

                17.1.6.5.1. Marketing Strategy

                17.1.6.5.2. Product Strategy

                17.1.6.5.3. Channel Strategy

        17.1.7. CandF Foods Inc.

            17.1.7.1. Overview

            17.1.7.2. Product Portfolio

            17.1.7.3. Profitability by Market Segments

            17.1.7.4. Sales Footprint

            17.1.7.5. Strategy Overview

                17.1.7.5.1. Marketing Strategy

                17.1.7.5.2. Product Strategy

                17.1.7.5.3. Channel Strategy

        17.1.8. Bob’s Red Mill Natural Foods

            17.1.8.1. Overview

            17.1.8.2. Product Portfolio

            17.1.8.3. Profitability by Market Segments

            17.1.8.4. Sales Footprint

            17.1.8.5. Strategy Overview

                17.1.8.5.1. Marketing Strategy

                17.1.8.5.2. Product Strategy

                17.1.8.5.3. Channel Strategy

        17.1.9. La Casita S.A.

            17.1.9.1. Overview

            17.1.9.2. Product Portfolio

            17.1.9.3. Profitability by Market Segments

            17.1.9.4. Sales Footprint

            17.1.9.5. Strategy Overview

                17.1.9.5.1. Marketing Strategy

                17.1.9.5.2. Product Strategy

                17.1.9.5.3. Channel Strategy

        17.1.10. Natural Supply King Global (PTY) Ltd.

            17.1.10.1. Overview

            17.1.10.2. Product Portfolio

            17.1.10.3. Profitability by Market Segments

            17.1.10.4. Sales Footprint

            17.1.10.5. Strategy Overview

                17.1.10.5.1. Marketing Strategy

                17.1.10.5.2. Product Strategy

                17.1.10.5.3. Channel Strategy

        17.1.11. Bush Company, Inc.

            17.1.11.1. Overview

            17.1.11.2. Product Portfolio

            17.1.11.3. Profitability by Market Segments

            17.1.11.4. Sales Footprint

            17.1.11.5. Strategy Overview

                17.1.11.5.1. Marketing Strategy

                17.1.11.5.2. Product Strategy

                17.1.11.5.3. Channel Strategy

        17.1.12. Bush Brothers and Company

            17.1.12.1. Overview

            17.1.12.2. Product Portfolio

            17.1.12.3. Profitability by Market Segments

            17.1.12.4. Sales Footprint

            17.1.12.5. Strategy Overview

                17.1.12.5.1. Marketing Strategy

                17.1.12.5.2. Product Strategy

                17.1.12.5.3. Channel Strategy

        17.1.13. From The Farmer

            17.1.13.1. Overview

            17.1.13.2. Product Portfolio

            17.1.13.3. Profitability by Market Segments

            17.1.13.4. Sales Footprint

            17.1.13.5. Strategy Overview

                17.1.13.5.1. Marketing Strategy

                17.1.13.5.2. Product Strategy

                17.1.13.5.3. Channel Strategy

        17.1.14. Nikken Foods

            17.1.14.1. Overview

            17.1.14.2. Product Portfolio

            17.1.14.3. Profitability by Market Segments

            17.1.14.4. Sales Footprint

            17.1.14.5. Strategy Overview

                17.1.14.5.1. Marketing Strategy

                17.1.14.5.2. Product Strategy

                17.1.14.5.3. Channel Strategy

        17.1.15. Green Image Organic Sdn. Bhd.

            17.1.15.1. Overview

            17.1.15.2. Product Portfolio

            17.1.15.3. Profitability by Market Segments

            17.1.15.4. Sales Footprint

            17.1.15.5. Strategy Overview

                17.1.15.5.1. Marketing Strategy

                17.1.15.5.2. Product Strategy

                17.1.15.5.3. Channel Strategy

18. Assumptions & Acronyms Used

19. Research Methodology

Don't pay for what you don't need

Customize your report by selecting specific countries or regions and save 30%!

List of Tables

Table 1: Global Market Value (US$ Million) Forecast by Region, 2018 to 2033

Table 2: Global Market Volume (Tons) Forecast by Region, 2018 to 2033

Table 3: Global Market Value (US$ Million) Forecast by Product Type, 2018 to 2033

Table 4: Global Market Volume (Tons) Forecast by Product Type, 2018 to 2033

Table 5: Global Market Value (US$ Million) Forecast by Nature, 2018 to 2033

Table 6: Global Market Volume (Tons) Forecast by Nature, 2018 to 2033

Table 7: North America Market Value (US$ Million) Forecast by Country, 2018 to 2033

Table 8: North America Market Volume (Tons) Forecast by Country, 2018 to 2033

Table 9: North America Market Value (US$ Million) Forecast by Product Type, 2018 to 2033

Table 10: North America Market Volume (Tons) Forecast by Product Type, 2018 to 2033

Table 11: North America Market Value (US$ Million) Forecast by Nature, 2018 to 2033

Table 12: North America Market Volume (Tons) Forecast by Nature, 2018 to 2033

Table 13: Latin America Market Value (US$ Million) Forecast by Country, 2018 to 2033

Table 14: Latin America Market Volume (Tons) Forecast by Country, 2018 to 2033

Table 15: Latin America Market Value (US$ Million) Forecast by Product Type, 2018 to 2033

Table 16: Latin America Market Volume (Tons) Forecast by Product Type, 2018 to 2033

Table 17: Latin America Market Value (US$ Million) Forecast by Nature, 2018 to 2033

Table 18: Latin America Market Volume (Tons) Forecast by Nature, 2018 to 2033

Table 19: Western Europe Market Value (US$ Million) Forecast by Country, 2018 to 2033

Table 20: Western Europe Market Volume (Tons) Forecast by Country, 2018 to 2033

Table 21: Western Europe Market Value (US$ Million) Forecast by Product Type, 2018 to 2033

Table 22: Western Europe Market Volume (Tons) Forecast by Product Type, 2018 to 2033

Table 23: Western Europe Market Value (US$ Million) Forecast by Nature, 2018 to 2033

Table 24: Western Europe Market Volume (Tons) Forecast by Nature, 2018 to 2033

Table 25: Eastern Europe Market Value (US$ Million) Forecast by Country, 2018 to 2033

Table 26: Eastern Europe Market Volume (Tons) Forecast by Country, 2018 to 2033

Table 27: Eastern Europe Market Value (US$ Million) Forecast by Product Type, 2018 to 2033

Table 28: Eastern Europe Market Volume (Tons) Forecast by Product Type, 2018 to 2033

Table 29: Eastern Europe Market Value (US$ Million) Forecast by Nature, 2018 to 2033

Table 30: Eastern Europe Market Volume (Tons) Forecast by Nature, 2018 to 2033

Table 31: South Asia and Pacific Market Value (US$ Million) Forecast by Country, 2018 to 2033

Table 32: South Asia and Pacific Market Volume (Tons) Forecast by Country, 2018 to 2033

Table 33: South Asia and Pacific Market Value (US$ Million) Forecast by Product Type, 2018 to 2033

Table 34: South Asia and Pacific Market Volume (Tons) Forecast by Product Type, 2018 to 2033

Table 35: South Asia and Pacific Market Value (US$ Million) Forecast by Nature, 2018 to 2033

Table 36: South Asia and Pacific Market Volume (Tons) Forecast by Nature, 2018 to 2033

Table 37: East Asia Market Value (US$ Million) Forecast by Country, 2018 to 2033

Table 38: East Asia Market Volume (Tons) Forecast by Country, 2018 to 2033

Table 39: East Asia Market Value (US$ Million) Forecast by Product Type, 2018 to 2033

Table 40: East Asia Market Volume (Tons) Forecast by Product Type, 2018 to 2033

Table 41: East Asia Market Value (US$ Million) Forecast by Nature, 2018 to 2033

Table 42: East Asia Market Volume (Tons) Forecast by Nature, 2018 to 2033

Table 43: Middle East and Africa Market Value (US$ Million) Forecast by Country, 2018 to 2033

Table 44: Middle East and Africa Market Volume (Tons) Forecast by Country, 2018 to 2033

Table 45: Middle East and Africa Market Value (US$ Million) Forecast by Product Type, 2018 to 2033

Table 46: Middle East and Africa Market Volume (Tons) Forecast by Product Type, 2018 to 2033

Table 47: Middle East and Africa Market Value (US$ Million) Forecast by Nature, 2018 to 2033

Table 48: Middle East and Africa Market Volume (Tons) Forecast by Nature, 2018 to 2033
Nandini Roy Choudhury

Principal Consultant

Talk to Analyst

Find your sweet spots for generating winning opportunities in this market.

List of Charts

Figure 1: Global Market Value (US$ Million) by Product Type, 2023 to 2033

Figure 2: Global Market Value (US$ Million) by Nature, 2023 to 2033

Figure 3: Global Market Value (US$ Million) by Region, 2023 to 2033

Figure 4: Global Market Value (US$ Million) Analysis by Region, 2018 to 2033

Figure 5: Global Market Volume (Tons) Analysis by Region, 2018 to 2033

Figure 6: Global Market Value Share (%) and BPS Analysis by Region, 2023 to 2033

Figure 7: Global Market Y-o-Y Growth (%) Projections by Region, 2023 to 2033

Figure 8: Global Market Value (US$ Million) Analysis by Product Type, 2018 to 2033

Figure 9: Global Market Volume (Tons) Analysis by Product Type, 2018 to 2033

Figure 10: Global Market Value Share (%) and BPS Analysis by Product Type, 2023 to 2033

Figure 11: Global Market Y-o-Y Growth (%) Projections by Product Type, 2023 to 2033

Figure 12: Global Market Value (US$ Million) Analysis by Nature, 2018 to 2033

Figure 13: Global Market Volume (Tons) Analysis by Nature, 2018 to 2033

Figure 14: Global Market Value Share (%) and BPS Analysis by Nature, 2023 to 2033

Figure 15: Global Market Y-o-Y Growth (%) Projections by Nature, 2023 to 2033

Figure 16: Global Market Attractiveness by Product Type, 2023 to 2033

Figure 17: Global Market Attractiveness by Nature, 2023 to 2033

Figure 18: Global Market Attractiveness by Region, 2023 to 2033

Figure 19: North America Market Value (US$ Million) by Product Type, 2023 to 2033

Figure 20: North America Market Value (US$ Million) by Nature, 2023 to 2033

Figure 21: North America Market Value (US$ Million) by Country, 2023 to 2033

Figure 22: North America Market Value (US$ Million) Analysis by Country, 2018 to 2033

Figure 23: North America Market Volume (Tons) Analysis by Country, 2018 to 2033

Figure 24: North America Market Value Share (%) and BPS Analysis by Country, 2023 to 2033

Figure 25: North America Market Y-o-Y Growth (%) Projections by Country, 2023 to 2033

Figure 26: North America Market Value (US$ Million) Analysis by Product Type, 2018 to 2033

Figure 27: North America Market Volume (Tons) Analysis by Product Type, 2018 to 2033

Figure 28: North America Market Value Share (%) and BPS Analysis by Product Type, 2023 to 2033

Figure 29: North America Market Y-o-Y Growth (%) Projections by Product Type, 2023 to 2033

Figure 30: North America Market Value (US$ Million) Analysis by Nature, 2018 to 2033

Figure 31: North America Market Volume (Tons) Analysis by Nature, 2018 to 2033

Figure 32: North America Market Value Share (%) and BPS Analysis by Nature, 2023 to 2033

Figure 33: North America Market Y-o-Y Growth (%) Projections by Nature, 2023 to 2033

Figure 34: North America Market Attractiveness by Product Type, 2023 to 2033

Figure 35: North America Market Attractiveness by Nature, 2023 to 2033

Figure 36: North America Market Attractiveness by Country, 2023 to 2033

Figure 37: Latin America Market Value (US$ Million) by Product Type, 2023 to 2033

Figure 38: Latin America Market Value (US$ Million) by Nature, 2023 to 2033

Figure 39: Latin America Market Value (US$ Million) by Country, 2023 to 2033

Figure 40: Latin America Market Value (US$ Million) Analysis by Country, 2018 to 2033

Figure 41: Latin America Market Volume (Tons) Analysis by Country, 2018 to 2033

Figure 42: Latin America Market Value Share (%) and BPS Analysis by Country, 2023 to 2033

Figure 43: Latin America Market Y-o-Y Growth (%) Projections by Country, 2023 to 2033

Figure 44: Latin America Market Value (US$ Million) Analysis by Product Type, 2018 to 2033

Figure 45: Latin America Market Volume (Tons) Analysis by Product Type, 2018 to 2033

Figure 46: Latin America Market Value Share (%) and BPS Analysis by Product Type, 2023 to 2033

Figure 47: Latin America Market Y-o-Y Growth (%) Projections by Product Type, 2023 to 2033

Figure 48: Latin America Market Value (US$ Million) Analysis by Nature, 2018 to 2033

Figure 49: Latin America Market Volume (Tons) Analysis by Nature, 2018 to 2033

Figure 50: Latin America Market Value Share (%) and BPS Analysis by Nature, 2023 to 2033

Figure 51: Latin America Market Y-o-Y Growth (%) Projections by Nature, 2023 to 2033

Figure 52: Latin America Market Attractiveness by Product Type, 2023 to 2033

Figure 53: Latin America Market Attractiveness by Nature, 2023 to 2033

Figure 54: Latin America Market Attractiveness by Country, 2023 to 2033

Figure 55: Western Europe Market Value (US$ Million) by Product Type, 2023 to 2033

Figure 56: Western Europe Market Value (US$ Million) by Nature, 2023 to 2033

Figure 57: Western Europe Market Value (US$ Million) by Country, 2023 to 2033

Figure 58: Western Europe Market Value (US$ Million) Analysis by Country, 2018 to 2033

Figure 59: Western Europe Market Volume (Tons) Analysis by Country, 2018 to 2033

Figure 60: Western Europe Market Value Share (%) and BPS Analysis by Country, 2023 to 2033

Figure 61: Western Europe Market Y-o-Y Growth (%) Projections by Country, 2023 to 2033

Figure 62: Western Europe Market Value (US$ Million) Analysis by Product Type, 2018 to 2033

Figure 63: Western Europe Market Volume (Tons) Analysis by Product Type, 2018 to 2033

Figure 64: Western Europe Market Value Share (%) and BPS Analysis by Product Type, 2023 to 2033

Figure 65: Western Europe Market Y-o-Y Growth (%) Projections by Product Type, 2023 to 2033

Figure 66: Western Europe Market Value (US$ Million) Analysis by Nature, 2018 to 2033

Figure 67: Western Europe Market Volume (Tons) Analysis by Nature, 2018 to 2033

Figure 68: Western Europe Market Value Share (%) and BPS Analysis by Nature, 2023 to 2033

Figure 69: Western Europe Market Y-o-Y Growth (%) Projections by Nature, 2023 to 2033

Figure 70: Western Europe Market Attractiveness by Product Type, 2023 to 2033

Figure 71: Western Europe Market Attractiveness by Nature, 2023 to 2033

Figure 72: Western Europe Market Attractiveness by Country, 2023 to 2033

Figure 73: Eastern Europe Market Value (US$ Million) by Product Type, 2023 to 2033

Figure 74: Eastern Europe Market Value (US$ Million) by Nature, 2023 to 2033

Figure 75: Eastern Europe Market Value (US$ Million) by Country, 2023 to 2033

Figure 76: Eastern Europe Market Value (US$ Million) Analysis by Country, 2018 to 2033

Figure 77: Eastern Europe Market Volume (Tons) Analysis by Country, 2018 to 2033

Figure 78: Eastern Europe Market Value Share (%) and BPS Analysis by Country, 2023 to 2033

Figure 79: Eastern Europe Market Y-o-Y Growth (%) Projections by Country, 2023 to 2033

Figure 80: Eastern Europe Market Value (US$ Million) Analysis by Product Type, 2018 to 2033

Figure 81: Eastern Europe Market Volume (Tons) Analysis by Product Type, 2018 to 2033

Figure 82: Eastern Europe Market Value Share (%) and BPS Analysis by Product Type, 2023 to 2033

Figure 83: Eastern Europe Market Y-o-Y Growth (%) Projections by Product Type, 2023 to 2033

Figure 84: Eastern Europe Market Value (US$ Million) Analysis by Nature, 2018 to 2033

Figure 85: Eastern Europe Market Volume (Tons) Analysis by Nature, 2018 to 2033

Figure 86: Eastern Europe Market Value Share (%) and BPS Analysis by Nature, 2023 to 2033

Figure 87: Eastern Europe Market Y-o-Y Growth (%) Projections by Nature, 2023 to 2033

Figure 88: Eastern Europe Market Attractiveness by Product Type, 2023 to 2033

Figure 89: Eastern Europe Market Attractiveness by Nature, 2023 to 2033

Figure 90: Eastern Europe Market Attractiveness by Country, 2023 to 2033

Figure 91: South Asia and Pacific Market Value (US$ Million) by Product Type, 2023 to 2033

Figure 92: South Asia and Pacific Market Value (US$ Million) by Nature, 2023 to 2033

Figure 93: South Asia and Pacific Market Value (US$ Million) by Country, 2023 to 2033

Figure 94: South Asia and Pacific Market Value (US$ Million) Analysis by Country, 2018 to 2033

Figure 95: South Asia and Pacific Market Volume (Tons) Analysis by Country, 2018 to 2033

Figure 96: South Asia and Pacific Market Value Share (%) and BPS Analysis by Country, 2023 to 2033

Figure 97: South Asia and Pacific Market Y-o-Y Growth (%) Projections by Country, 2023 to 2033

Figure 98: South Asia and Pacific Market Value (US$ Million) Analysis by Product Type, 2018 to 2033

Figure 99: South Asia and Pacific Market Volume (Tons) Analysis by Product Type, 2018 to 2033

Figure 100: South Asia and Pacific Market Value Share (%) and BPS Analysis by Product Type, 2023 to 2033

Figure 101: South Asia and Pacific Market Y-o-Y Growth (%) Projections by Product Type, 2023 to 2033

Figure 102: South Asia and Pacific Market Value (US$ Million) Analysis by Nature, 2018 to 2033

Figure 103: South Asia and Pacific Market Volume (Tons) Analysis by Nature, 2018 to 2033

Figure 104: South Asia and Pacific Market Value Share (%) and BPS Analysis by Nature, 2023 to 2033

Figure 105: South Asia and Pacific Market Y-o-Y Growth (%) Projections by Nature, 2023 to 2033

Figure 106: South Asia and Pacific Market Attractiveness by Product Type, 2023 to 2033

Figure 107: South Asia and Pacific Market Attractiveness by Nature, 2023 to 2033

Figure 108: South Asia and Pacific Market Attractiveness by Country, 2023 to 2033

Figure 109: East Asia Market Value (US$ Million) by Product Type, 2023 to 2033

Figure 110: East Asia Market Value (US$ Million) by Nature, 2023 to 2033

Figure 111: East Asia Market Value (US$ Million) by Country, 2023 to 2033

Figure 112: East Asia Market Value (US$ Million) Analysis by Country, 2018 to 2033

Figure 113: East Asia Market Volume (Tons) Analysis by Country, 2018 to 2033

Figure 114: East Asia Market Value Share (%) and BPS Analysis by Country, 2023 to 2033

Figure 115: East Asia Market Y-o-Y Growth (%) Projections by Country, 2023 to 2033

Figure 116: East Asia Market Value (US$ Million) Analysis by Product Type, 2018 to 2033

Figure 117: East Asia Market Volume (Tons) Analysis by Product Type, 2018 to 2033

Figure 118: East Asia Market Value Share (%) and BPS Analysis by Product Type, 2023 to 2033

Figure 119: East Asia Market Y-o-Y Growth (%) Projections by Product Type, 2023 to 2033

Figure 120: East Asia Market Value (US$ Million) Analysis by Nature, 2018 to 2033

Figure 121: East Asia Market Volume (Tons) Analysis by Nature, 2018 to 2033

Figure 122: East Asia Market Value Share (%) and BPS Analysis by Nature, 2023 to 2033

Figure 123: East Asia Market Y-o-Y Growth (%) Projections by Nature, 2023 to 2033

Figure 124: East Asia Market Attractiveness by Product Type, 2023 to 2033

Figure 125: East Asia Market Attractiveness by Nature, 2023 to 2033

Figure 126: East Asia Market Attractiveness by Country, 2023 to 2033

Figure 127: Middle East and Africa Market Value (US$ Million) by Product Type, 2023 to 2033

Figure 128: Middle East and Africa Market Value (US$ Million) by Nature, 2023 to 2033

Figure 129: Middle East and Africa Market Value (US$ Million) by Country, 2023 to 2033

Figure 130: Middle East and Africa Market Value (US$ Million) Analysis by Country, 2018 to 2033

Figure 131: Middle East and Africa Market Volume (Tons) Analysis by Country, 2018 to 2033

Figure 132: Middle East and Africa Market Value Share (%) and BPS Analysis by Country, 2023 to 2033

Figure 133: Middle East and Africa Market Y-o-Y Growth (%) Projections by Country, 2023 to 2033

Figure 134: Middle East and Africa Market Value (US$ Million) Analysis by Product Type, 2018 to 2033

Figure 135: Middle East and Africa Market Volume (Tons) Analysis by Product Type, 2018 to 2033

Figure 136: Middle East and Africa Market Value Share (%) and BPS Analysis by Product Type, 2023 to 2033

Figure 137: Middle East and Africa Market Y-o-Y Growth (%) Projections by Product Type, 2023 to 2033

Figure 138: Middle East and Africa Market Value (US$ Million) Analysis by Nature, 2018 to 2033

Figure 139: Middle East and Africa Market Volume (Tons) Analysis by Nature, 2018 to 2033

Figure 140: Middle East and Africa Market Value Share (%) and BPS Analysis by Nature, 2023 to 2033

Figure 141: Middle East and Africa Market Y-o-Y Growth (%) Projections by Nature, 2023 to 2033

Figure 142: Middle East and Africa Market Attractiveness by Product Type, 2023 to 2033

Figure 143: Middle East and Africa Market Attractiveness by Nature, 2023 to 2033

Figure 144: Middle East and Africa Market Attractiveness by Country, 2023 to 2033

Recommendations

Food and Beverage

Coconut Flour Market

Published : October 2023

Explore Food and Beverage Insights

View Reports