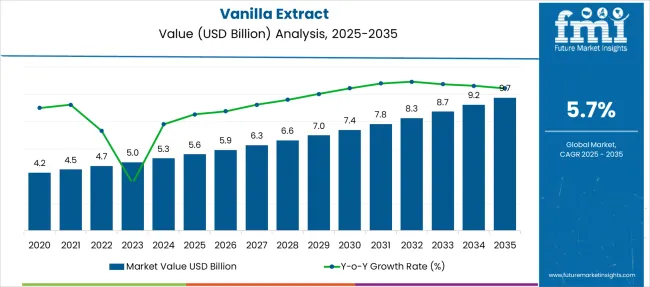
The Vanilla Extract Market is estimated to be valued at USD 5.6 billion in 2025 and is projected to reach USD 9.7 billion by 2035, registering a compound annual growth rate (CAGR) of 5.7% over the forecast period. From 2025–2028, fluctuations remain high as YoY growth rebounds from a trough of 2.5% (2023) to 5.5%, driven by supply normalization after raw material shortages. The resilience index rises to 0.85 during 2028–2032, as incremental demand stabilizes near USD 300 million annually. Beyond 2032, the index reaches 0.92, showing strong adaptability despite climatic uncertainties impacting vanilla bean production.
The compound annual addition for 2025–2035 stands at USD 470 million per year, with peak increment observed in 2031–2033, signaling heightened elasticity in premium F&B segments. Strategic resilience stems from diversified sourcing regions and integration of synthetic alternatives, offsetting volatility in natural extract pricing. High stability in late-phase CAGR suggests a strong ROI for manufacturers leveraging vertical integration in flavoring applications.
Madagascar vanilla dominates with 43.6% share in 2025, attributed to its strong aromatic profile and consumer preference for natural flavoring in clean-label formulations. North America remains the primary market, driven by large-scale production of bakery goods and premium ice creams, while Asia-Pacific is emerging as a key growth hub due to rising café culture and artisanal dessert consumption. Europe continues steady adoption in both industrial and gourmet food sectors.
The market curve is expected to incline more sharply after 2028 as plant-based dairy alternatives and functional beverages adopt natural flavor enhancers. Opportunities lie in traceable supply chains and organic-certified vanilla, addressing both consumer trust and regulatory compliance. Producers investing in vertical integration and sustainable sourcing networks will strengthen resilience against price volatility and supply disruptions.
| Metric | Value |
|---|---|
| Vanilla Extract Market Estimated Value in (2025E) | USD 5.6 billion |
| Vanilla Extract Market Forecast Value in (2035F) | USD 9.7 billion |
| Forecast CAGR (2025 to 2035) | 5.7% |
The vanilla extract market is experiencing sustained growth fueled by rising global demand for natural flavoring agents and clean label ingredients. Shifts in consumer preference toward organic and authentic taste profiles have reinforced the importance of pure vanilla extract across culinary, beverage, and personal care industries.
Growing scrutiny of synthetic additives and heightened transparency in food labeling have further elevated the market positioning of vanilla extract as a premium flavoring solution. Key supply chain developments, including improved vanilla cultivation practices and expanding traceability systems, are contributing to consistent product availability.
Innovation in extraction techniques, along with the premiumization of bakery and gourmet products, is creating new avenues for growth. As global demand for high quality natural flavors continues to rise, the market for vanilla extract remains well positioned across both food and non food applications.
The vanilla extract market is segmented by types of vanilla beans, form, application, and region. By types of vanilla beans, it includes Madagascar vanilla, Tahitian vanilla, Mexican vanilla, Indonesian vanilla, and others, representing major global sources. In terms of form, the market is classified into liquid and powder, catering to different usage preferences across industries. Based on application, the segmentation covers food, beverages, cosmetics and personal care, pharmaceuticals, and other specialized uses. Regionally, the market spans North America, Latin America, Western and Eastern Europe, Balkan and Baltic countries, Russia and Belarus, Central Asia, East Asia, South Asia and Pacific, and the Middle East and Africa.
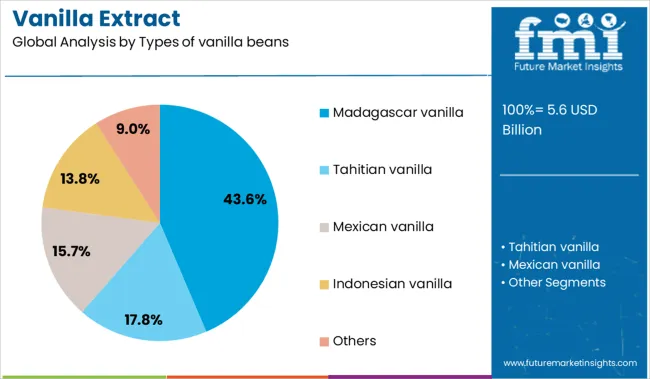
The Madagascar vanilla type is projected to account for 43.60 percent of total market revenue by 2025 within the types of vanilla beans category, making it the leading variety. This dominance is attributed to its rich flavor profile, high vanillin content, and widespread consumer recognition as the gold standard in vanilla quality.
Cultivated primarily in favorable agroclimatic conditions, Madagascar vanilla delivers consistent taste and aroma, making it highly preferred by food manufacturers, chefs, and perfumers. Its superior compatibility with dairy, baked goods, and confections has further contributed to its global adoption.
Continued investment in sustainable farming and fair trade sourcing practices has reinforced its reliability and premium perception in the supply chain, securing its position as the most commercially significant vanilla bean variety.
The liquid form segment is anticipated to contribute 58.20 percent of the overall vanilla extract market revenue by 2025, positioning it as the most dominant format. This is driven by its convenience in formulation, ease of blending, and consistent flavor distribution in food and beverage applications.
Liquid vanilla extract is widely used in both industrial and household settings due to its ability to integrate seamlessly into batters, sauces, beverages, and frozen desserts. Manufacturers value the liquid form for its long shelf life, precision in dosing, and minimal processing requirements.
As demand continues to rise for clean label and natural flavoring solutions, the liquid segment maintains its leadership through its functional versatility and broad market penetration.
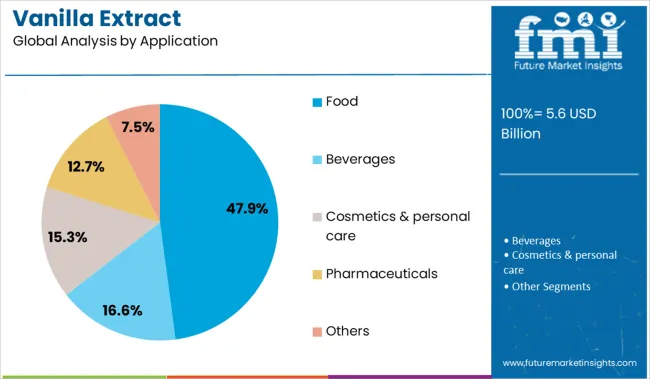
The food application segment is expected to account for 47.90 percent of the total market revenue by 2025, establishing it as the largest end use category. This is supported by the widespread incorporation of vanilla extract in bakery products, confectionery, dairy, beverages, and packaged foods.
The rising trend of artisanal and premium food offerings has further elevated the role of authentic vanilla flavoring in enhancing taste and consumer appeal. Food manufacturers are increasingly emphasizing natural and organic ingredients, aligning with the clean label movement and reinforcing the relevance of pure vanilla extract.
Consistent innovation in flavor pairing and product development across global cuisines continues to expand the use of vanilla extract, securing the food segment’s dominance within the overall market.
Natural variants account for more than half of total value, while synthetic types dominate volume. Liquid formats contribute over 75% of consumption due to application ease in baking, beverages, and dairy. North America remains the highest revenue generator, while Asia-Pacific markets post faster growth. Premiumization trends in food and personal care continue to drive demand for high-purity extracts. Private-label expansion and ingredient diversification across retail shelves are supporting mid-scale producers in emerging markets.
Vanilla extract usage continues rising in bakery, dairy, chocolate, and beverage manufacturing. Nearly three-quarters of demand comes from food and drink applications, where natural flavoring is preferred over artificial substitutes. Extracts are increasingly used in ready-to-drink beverages, plant-based yogurts, and gluten-free mixes to meet ingredient transparency goals.
Outside food, vanilla is now part of cosmetic creams, massage oils, and home fragrance lines due to its familiar aroma and perceived wellness value. Larger brands are transitioning to ethically sourced options and traceable farming networks. Retail shelf presence for vanilla-enhanced body sprays and clean-label protein shakes expanded across major pharmacy and grocery formats over the past 18 months, reinforcing cross-sector extract visibility.
Volatility in raw vanilla bean pricing remains the dominant supply-side risk. Vanilla is grown in limited equatorial zones, often affected by cyclones, drought, and poor logistics infrastructure. Madagascar and Indonesia dominate global output, but inconsistent harvest yields have driven bean prices above USD 600 per kilo at peaks. These swings translate into fluctuating extract pricing and unpredictable margins for processors. Synthetic alternatives, while cheaper, pose brand-positioning risks for labels focused on clean or natural claims.
Adulteration using coumarin or synthetic vanillin continues to affect quality standards in lower-cost imports. Certification gaps, testing failures, and opaque sourcing also delay procurement cycles for bulk buyers targeting traceability or organic certification benchmarks.
| Countries | CAGR |
|---|---|
| China | 7.7% |
| India | 7.1% |
| Germany | 6.6% |
| France | 6.0% |
| UK | 5.4% |
| USA | 4.8% |
| Brazil | 4.3% |
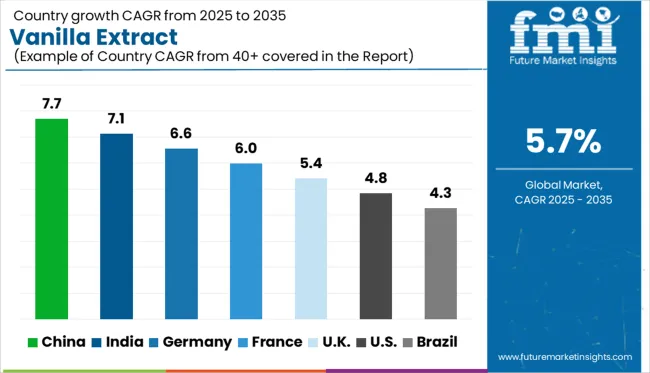
The market is forecast to grow at a CAGR of 5.7% between 2025 and 2035. China (BRICS) leads with a growth rate of 7.7%, surpassing the global average by 2.0 percentage points, driven by rising demand in food processing and natural flavoring industries. India (BRICS) follows at 7.1% (+1.4 pp), supported by expanding bakery, confectionery, and export sectors.
Among OECD nations, Germany records 6.6% (+0.9 pp), reflecting continued demand for organic and premium flavor ingredients. France reports 6.0% (+0.3 pp), aligned with its strong artisanal food and beverage culture. The UK posts a CAGR of 5.4%, just 0.3 pp below the global average, indicating stable but slower growth, potentially linked to shifting consumption trends and product substitutions. The report features insights from 40+ countries, with the top five shown below.
China records a 7.7% growth rate in the vanilla extract market, above the global average of 5.7%. Imports from Madagascar and Papua New Guinea support rising demand from food processors and pharmaceutical extractors. Extraction units have expanded near port zones to reduce cold chain spoilage.
Mid-size producers have installed ethanol recovery systems to manage production costs linked to fluctuating raw bean prices. Extract formulation is being tailored for soy-based dessert mixes and fortified bakery goods. Local flavor houses are increasing lab-scale output for export-oriented contract blending.
India shows a 7.1% growth rate in the vanilla extract market, exceeding the global average of 5.7%. Karnataka and Kerala growers are expanding contract-based farming using semi-controlled pollination. Processing units have emerged near spice clusters to simplify raw material handling. Extract purity levels are being aligned with global food safety standards through small-batch distillation.
Domestic brands are adding flavored dairy products using vanilla extracts, driving demand from creameries and ice cream makers. Analysts report rising sales through bulk distribution in tier-2 cities.
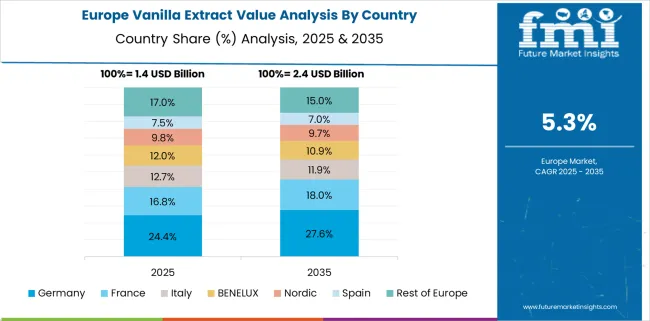
Germany reports a 6.6% growth rate in the vanilla extract market, above the global average of 5.7%. Use in organic baking goods and non-alcoholic beverage recipes is driving steady demand. Importers have shifted to bonded warehousing to improve turnover speeds on whole bean shipments.
Extraction is being conducted in modular labs designed to isolate flavor fractions. Private label goods sold through pharmacy chains have widened extract applications beyond food. Vendors have added allergen-free variants for specialty food manufacturers.
France posts a 6.0% growth rate in the vanilla extract market, above the global average of 5.7%. Food-grade extract demand is driven by artisanal patisseries and mid-sized dairy exporters. Blending operations are centralized in Normandy and Lyon for access to dairy co-packers.
Small-batch production houses are focusing on ethanol-free formats for organic food certification. Importers are sourcing beans from diversified origins to counter price volatility. Labelling laws are pushing processors to disclose extraction solvents, affecting shelf positioning in retail channels.
United Kingdom registers a 5.4% growth rate in the vanilla extract market, slightly below the global rate of 5.7%. Concentrated usage is seen in pre-packed bakery kits and premium frozen desserts. Retailers are repackaging extract into single-use sachets to target meal-kit subscription services.
Demand has shifted toward clear-label products with simplified ingredient disclosures. Extract producers are adapting equipment to smaller batch runs aligned with fast-moving SKUs. Analysts observe greater activity among contract formulators supplying to independent food brands.
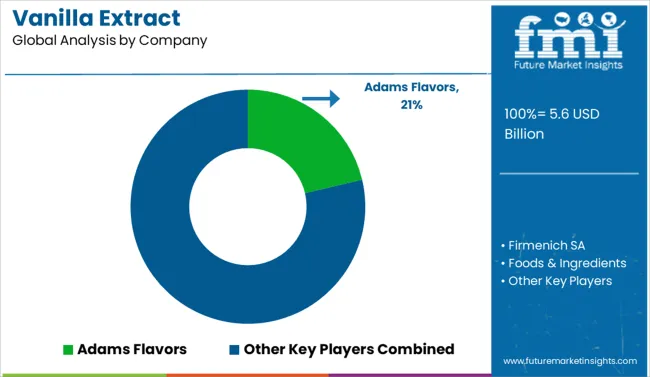
Vanilla extract sales in 2025 are being driven by growing demand for clean-label ingredients, formulation transparency, and premium-grade flavor profiles across food and beverage categories. Adams Flavors leads the global market with a prominent share, supplying bulk and specialty extracts to both manufacturers and retail brands.
McCormick & Company continues to serve large-scale commercial buyers with consistent volume and flavor standardization. Firmenich SA and Kerry Group support formulation needs across confectionery, dairy, and beverage segments. Nielsen-Massey Vanillas and Frontier Co-op focus on high-purity and organic varieties for the culinary and specialty retail sectors.
OliveNation and Saucer Brands are expanding in e-commerce and foodservice. Entry challenges include limited vanilla bean supply, price volatility, and quality assurance in large-scale production.
Key players in the vanilla extract market are focusing on strengthening sourcing networks to manage supply volatility and secure quality beans. Many are entering long-term partnerships with growers to ensure consistent raw material availability. Product portfolios are being diversified with natural and organic extracts to cater to clean-label preferences. Companies are investing in traceability programs and certifications to enhance consumer trust. Expansion into premium and specialty extracts is being used to target high-value markets. R&D efforts are directed toward improving extraction techniques, while collaborations across the value chain help stabilize pricing and broaden distribution reach in global markets.
| Item | Value |
|---|---|
| Quantitative Units | USD 5.6 Billion |
| Types of vanilla beans | Madagascar vanilla, Tahitian vanilla, Mexican vanilla, Indonesian vanilla, and Others |
| Form | Liquid and Powder |
| Application | Food, Beverages, Cosmetics & personal care, Pharmaceuticals, and Others |
| Regions Covered | North America, Europe, Asia-Pacific, Latin America, Middle East & Africa |
| Country Covered | United States, Canada, Germany, France, United Kingdom, China, Japan, India, Brazil, South Africa |
| Key Companies Profiled | Adams Flavors, Firmenich SA, Foods & Ingredients, Frontier Co-op, Kerry Group, McCormick & Company, Naturalight Foods, Nielsen-Massey Vanillas, OliveNation, and Saucer Brands |
| Additional Attributes | Dollar sales by extract type and end-use segment, growing demand in premium bakery and dairy applications, stable usage across beverages and packaged foods, innovations in solvent-free extraction and traceable sourcing enhance product quality and supply chain transparency |
The global vanilla extract market is estimated to be valued at USD 5.6 billion in 2025.
The market size for the vanilla extract market is projected to reach USD 9.7 billion by 2035.
The vanilla extract market is expected to grow at a 5.7% CAGR between 2025 and 2035.
The key product types in vanilla extract market are madagascar vanilla, tahitian vanilla, mexican vanilla, indonesian vanilla and others.
In terms of form, liquid segment to command 58.2% share in the vanilla extract market in 2025.


Full Research Suite comprises of:
Market outlook & trends analysis
Interviews & case studies
Strategic recommendations
Vendor profiles & capabilities analysis
5-year forecasts
8 regions and 60+ country-level data splits
Market segment data splits
12 months of continuous data updates
DELIVERED AS:
PDF EXCEL ONLINE
Vanilla Bean Market Analysis - Size, Share, and Forecast Outlook 2025 to 2035
Vanilla Salt Market Insights - Sweet & Savory Fusion Trends 2025 to 2035
Korea Vanilla Bean Market Analysis byDistribution Channel, Form, Nature, Product Variety, and Region Through 2025 to 2035
Demand for Vanilla Bean in EU Size and Share Forecast Outlook 2025 to 2035
Western Europe Vanilla Bean Market Analysis by Distribution Channel, Form, Nature, Product Variety, and Country Through 2035
Vanilla Bean Industry Analysis in Japan Size and Share Forecast Outlook 2025 to 2035
Extraction Kits Market Analysis - Size, Share, and Forecast Outlook 2025 to 2035
Extracts and Distillates Market
Sage Extract Market Size and Share Forecast Outlook 2025 to 2035
Fume Extractor Market Size and Share Forecast Outlook 2025 to 2035
Meat Extracts Market Size and Share Forecast Outlook 2025 to 2035
Kale Extract Skincare Market Size and Share Forecast Outlook 2025 to 2035
Wine Extract Market Size and Share Forecast Outlook 2025 to 2035
Amla Extract Market Analysis - Size, Share, and Forecast Outlook 2025 to 2035
Dust Extractor Market Growth – Trends & Forecast 2025 to 2035
Data Extraction Software Market
Peony Extract Brightening Creams Market Analysis - Size, Share, and Forecast Outlook 2025 to 2035
Peony Extracts for Brightening Market Size and Share Forecast Outlook 2025 to 2035
Algae Extracts Market Size and Share Forecast Outlook 2025 to 2035
Juice Extraction Equipment Market Size and Share Forecast Outlook 2025 to 2035

Thank you!
You will receive an email from our Business Development Manager. Please be sure to check your SPAM/JUNK folder too.
Chat With
MaRIA