Peony Extracts for Brightening Market Size and Share Forecast Outlook 2025 to 2035

The Peony Extracts for Brightening Market is expected to record a valuation of USD 863.4 million in 2025 and USD 2,945.1 million in 2035, with an increase of USD 2,081.7 million, which equals a growth of 193% over the decade. The overall expansion represents a CAGR of 13.1% and a more than 2X increase in market size.
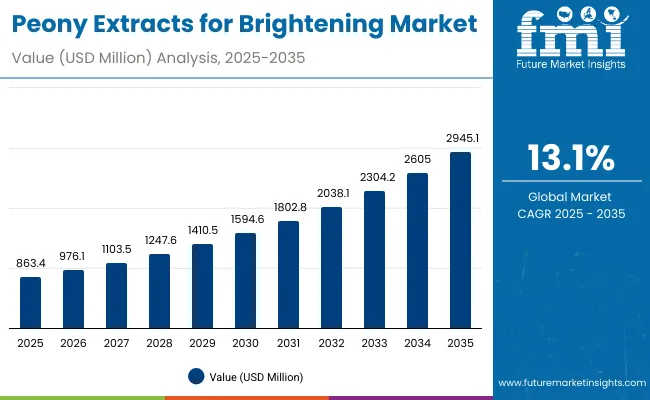
Quick Stats for Peony Extracts for Brightening Market

  • Peony Extracts for Brightening Market Value (2025): USD 863.4 million
  • Peony Extracts for Brightening Market Forecast Value (2035): USD 2,945.1 million
  • Peony Extracts for Brightening Market Forecast CAGR: 13.1%
  • Leading Segment in Peony Extracts for Brightening Market in 2025: Serums (48.5%)
  • Key Growth Regions in Peony Extracts for Brightening Market: Asia-Pacific (China, India, Japan), North America (USA), Europe (Germany, UK)
  • Top Key Players in Peony Extracts for Brightening Market: DSM-Firmenich, Fresh, Innisfree, Amorepacific, Sulwhasoo, Origins, The Face Shop, L’Occitane, Shiseido, Forest Essentials, Glow Recipe

Peony Extracts For Brightening Market

Peony Extracts for Brightening Market Key Takeaways

Metric Value
Peony Extracts for Brightening Market Estimated Value in (2025E) USD 863.4 million
Peony Extracts for Brightening Market Forecast Value in (2035F) USD 2,945.1 million
Forecast CAGR (2025 to 2035) 13.1%

During the first five-year period from 2025 to 2030, the market increases from USD 863.4 million to USD 1,594.6 million, adding USD 731.2 million, which accounts for 35% of the total decade growth. This phase records steady adoption of peony extracts in brightening, anti-aging, and hydration skincare, driven by rising demand for herbal/natural and dermatologist-tested claims. Serums dominate this period with 48.5% share in 2025, reflecting consumer preference for concentrated formats.

The second half from 2030 to 2035 contributes USD 1,350.5 million, equal to 65% of total growth, as the market jumps from USD 1,594.6 million to USD 2,945.1 million. This acceleration is powered by widespread deployment in premium skincare lines, AI-personalized beauty routines, and expansion in China and India, which register the highest CAGRs (23.6% and 23.8%). By the end of the decade, herbal/natural claims capture more than 51.5% of market share, and serums alongside creams/lotions continue to account for the bulk of global revenues.

From 2020 to 2024, the Peony Extracts for Brightening Market recorded strong growth as global demand for natural brightening skincare accelerated. During this period, the competitive landscape was shaped by Asian beauty brands and botanical-focused companies, with leading players controlling a significant share of revenues. Leaders such as Amorepacific, Shiseido, and L’Occitane drove brand differentiation through formulation expertise, natural positioning, and expansion into premium distribution channels. Competitive strength relied on heritage branding, clean-label claims, and multi-channel retail presence, while global ingredient suppliers such as DSM-Firmenich ensured consistent raw material quality. Service-based innovation was limited, with most companies focusing on finished formulations rather than ecosystem add-ons.

Demand for Peony Extracts for Brightening is projected to reach USD 863.4 million in 2025, and the revenue mix is shifting as herbal/natural claims (51.5%) and dermatologist-tested products capture larger market shares. Traditional brand leaders face rising competition from digital-first entrants like Glow Recipe and Forest Essentials, which emphasize direct-to-consumer channels, sustainability, and social media-driven engagement. The competitive advantage is moving away from product formulations alone to ecosystem strength, storytelling, sustainability, and recurring consumer loyalty models (subscription/D2C).

Why the Peony Extracts for Brightening Market is growing?

Consumers are increasingly shifting toward herbal and natural skincare products, and peony extracts align perfectly with this preference due to their botanical origin and proven brightening properties. The growing rejection of chemical-based cosmetics has fueled adoption of plant-derived actives. Markets such as China and India, where herbal/natural claims already command over 50% share, are driving momentum. This trend is expected to amplify global demand, especially as brands highlight clean-label and sustainable positioning.

Peony extracts offer dual benefits of brightening and anti-aging, making them a preferred ingredient for multi-functional skincare formulations. Consumers now expect products that deliver more than one benefit, particularly in premium categories like serums and creams. With anti-aging already leading at USD 863.4 million in 2025 and projected to triple by 2035, the synergy between brightening and wrinkle-reduction is creating strong adoption across age groups. This convergence is a core driver of long-term market expansion.

Segmental Analysis

The market is segmented by function, product type, claim, distribution channel, and region. Functions include brightening, anti-aging, hydration, and repair, highlighting the diverse applications of peony extracts in skincare. Product type classification covers serums, creams/lotions, masks, and toners to address different consumer preferences and formulation needs. Based on claims, segmentation includes herbal/natural, vegan, clean-label, and dermatologist-tested products, reflecting rising demand for transparency and botanical formulations. In terms of distribution channel, categories encompass e-commerce, pharmacies, specialty beauty stores, and mass retail, with digital platforms playing an increasingly central role in adoption. Regionally, the scope spans North America, Europe, and Asia-Pacific, with strong momentum in markets such as the USA, China, India, Japan, Germany, and the UK.
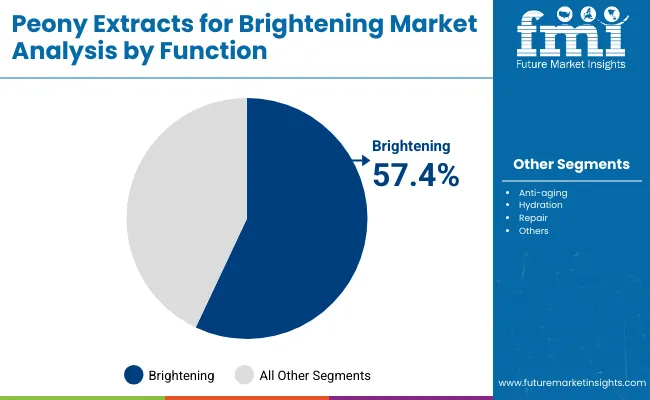
Insights into the Function Segment with Brightening Leading in Market Share

Peony Extracts For Brightening Market By Function

Function Value Share% 2025
Brightening 57.4%
Others 42.6%

The brightening segment is projected to contribute the largest share of the Peony Extracts for Brightening Market revenue in 2025, maintaining its lead as the dominant functional category. This is driven by strong consumer demand for skin radiance, even tone, and botanical-based brightening solutions that align with clean-label preferences. Brightening benefits are often paired with anti-aging and hydration properties, reinforcing their role in multifunctional skincare products. The segment’s growth is also supported by the rising popularity of concentrated formulations like serums and masks. As natural ingredients and transparency gain prominence, brightening remains the anchor function of peony extract–based skincare and is expected to retain its position as the backbone of this market over the forecast period.
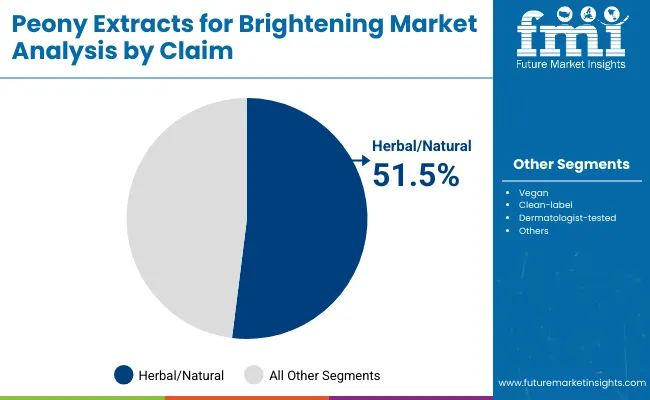
Insights into the Claim Segment with Herbal/Natural Products Dominating the Demand

Peony Extracts For Brightening Market By Claim

Claim Value Share% 2025
Herbal/natural 51.5%
Others 48.5%

The herbal/natural segment is forecasted to hold the majority share of the Peony Extracts for Brightening Market in 2025, driven by growing consumer preference for plant-based, clean-label skincare. These products are favored for their perceived safety, efficacy, and alignment with sustainability values, making them highly attractive to health-conscious buyers. Their strong positioning across premium and mass-market formats has facilitated widespread adoption in both online and offline channels. The segment’s growth is reinforced by rising demand in Asia-Pacific markets, where herbal claims are deeply rooted in beauty traditions. As global consumers increasingly seek natural alternatives over synthetic formulations, herbal/natural claims are expected to maintain their dominance in the market.
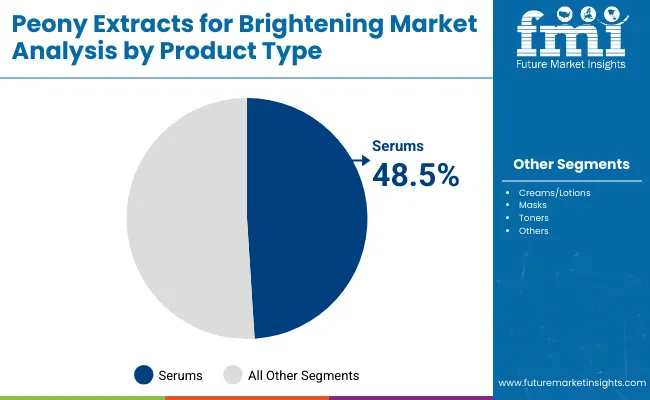
Insights into the Product Type Segment with Serums Leading in Market Share

Peony Extracts For Brightening Market By Product Type

Product Type Value Share% 2025
Serums 48.5%
Others 51.5%

The serum segment is projected to account for the largest share of the Peony Extracts for Brightening Market revenue in 2025, establishing it as the leading product type. Serums are preferred for their high concentration of active ingredients and ability to deliver visible brightening and anti-aging results in a short period. Their lightweight texture, rapid absorption, and compatibility with multi-step skincare routines have made them a staple across global beauty markets. Innovation in formulations, such as combining peony extracts with other botanicals and advanced delivery systems, has further boosted consumer trust and brand differentiation. Given their balance of efficacy and versatility, serums are expected to maintain their leading role in the Peony Extracts for Brightening Market.

What are the Drivers, Restraints, and Key Trends of the Peony Extracts for Brightening Market?

Rising Consumer Preference for Multi-Functional Skincare

The market is experiencing strong growth as consumers increasingly demand multi-functional skincare solutions that combine brightening with anti-aging and hydration benefits. Peony extracts naturally offer dual efficacy, addressing both uneven skin tone and signs of aging, making them highly desirable in premium serums and creams. This convergence of benefits reduces the need for multiple products, supporting adoption in cost-sensitive as well as luxury markets. The multifunctional positioning is expected to be a key driver in both mature and emerging regions.

Expansion of Herbal and Natural Claims in Asia-Pacific

Herbal and natural claims are becoming central to consumer purchasing decisions, especially in markets like China and India, where traditional botanical formulations carry cultural significance. Peony extracts, with their strong association with heritage beauty rituals, fit seamlessly into this demand shift. Growing consumer awareness around sustainability and clean-label transparency is accelerating adoption. As global brands localize products with herbal positioning, and regional players leverage botanical expertise, the preference for natural brightening ingredients is expected to be a major growth driver over the forecast decade.

Limited Clinical Evidence Compared to Synthetic Alternatives

Despite strong consumer interest, the market faces a restraint due to limited large-scale clinical validation of peony extracts compared to synthetic brightening agents like niacinamide or hydroquinone. While botanical claims resonate with consumers, efficacy data often relies on smaller studies or traditional knowledge, which may not always meet global regulatory or dermatological benchmarks. This creates hesitancy among certain consumer segments and retailers in highly regulated markets. Unless supported by stronger research and standardization, the reliance on perception-based marketing could limit adoption in stricter geographies.

Integration of Peony Extracts in Digital-First Beauty Brands

A growing trend in the market is the integration of peony extracts into formulations marketed by digital-first and direct-to-consumer (D2C) beauty brands. Companies such as Glow Recipe and Forest Essentials are capitalizing on social media storytelling and influencer-led campaigns to promote natural brightening solutions. These brands highlight transparency, sustainability, and visual results to attract younger consumers who value authenticity. With e-commerce emerging as a dominant distribution channel, the trend of botanical-focused, digitally marketed peony extract products is set to redefine consumer engagement and accelerate market penetration.
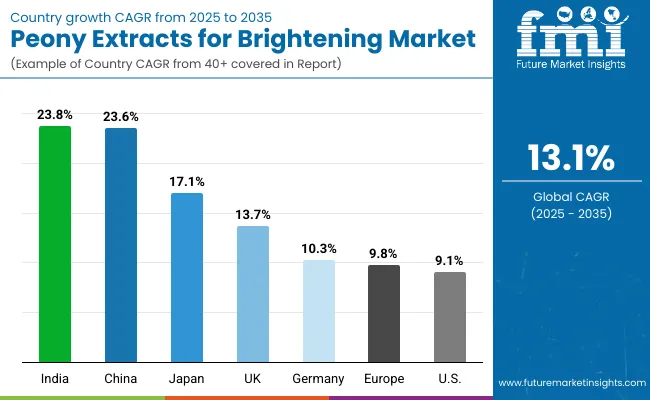
Analysis of Peony Extracts for Brightening Market By Key Countries

Country Wise Peony Extracts For Brightening Market

Countries Estimated CAGR (2025 to 2035)
China 23.6%
USA 9.1%
India 23.8%
UK 13.7%
Germany 10.3%
Japan 17.1%

The global Peony Extracts for Brightening Market shows a pronounced regional disparity in adoption speed, strongly influenced by cultural beauty traditions, consumer preferences for natural skincare, and retail channel evolution. Asia-Pacific emerges as the fastest-growing region, anchored by India at 23.8% CAGR and China at 23.6% CAGR. This acceleration is driven by rising consumer demand for herbal/natural skincare, cultural affinity for botanical remedies, and aggressive adoption of serums and brightening formats. In China, the dominance of herbal/natural claims underlines the strength of traditional beauty preferences, while India’s trajectory reflects rapid premiumization in urban markets and expansion of D2C beauty startups.

Europe maintains a strong growth profile, led by Germany at 10.3% CAGR and the UK at 13.7% CAGR, supported by stringent cosmetic safety standards, transparency in labeling, and growing demand for clean-label brightening solutions. Regulatory frameworks and consumer activism in Europe continue to drive brands toward sustainable, plant-based ingredients, positioning peony extracts as a natural fit. Japan, with a 17.1% CAGR, illustrates rising preference for multi-functional skincare, where brightening and anti-aging benefits are combined in sophisticated formulations.

North America shows moderate expansion, with the USA at 9.1% CAGR, reflecting a mature skincare market where consumer expectations focus on dermatologist-tested efficacy and premium clean-label offerings. Growth in North America is more digitally driven, with increasing adoption through e-commerce and social media–led marketing, rather than mass-market retail.
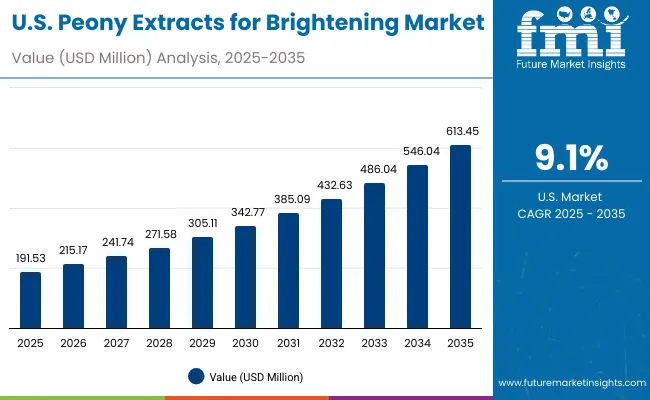
Sales Outlook for Peony Extracts for Brightening in the United States

Usa Peony Extracts For Brightening Market

Year USA Peony Extracts for Brightening Market (USD Million)
2025 191.53
2026 215.17
2027 241.74
2028 271.58
2029 305.11
2030 342.77
2031 385.09
2032 432.63
2033 486.04
2034 546.04
2035 613.45

The Peony Extracts for Brightening Market in the United States is projected to grow at a CAGR of 9.1% from 2025 to 2035, supported by rising consumer demand for dermatologist-tested, clean-label skincare products. Adoption is particularly strong in the premium segment, where brightening and anti-aging claims are combined in serums and creams. The growth is also influenced by increased digital engagement, with direct-to-consumer and e-commerce platforms expanding market reach. Consumers are favoring transparent ingredient labeling and multifunctional formulations, positioning peony extracts as a trusted natural alternative in brightening routines.

  • Dermatologist-tested claims are gaining traction among USA consumers seeking proven efficacy.
  • Serums remain the leading product type, aligning with preferences for concentrated brightening solutions.
  • E-commerce channels are accelerating adoption, supported by digital-first beauty brands and influencer-driven campaigns.

Growth and Expansion Outlook for Peony Extracts for Brightening Market in the United Kingdom

The Peony Extracts for Brightening Market in the United Kingdom is expected to grow at a CAGR of The Peony Extracts for Brightening Market in the United Kingdom is expected to grow at a CAGR of 13.7%, supported by rising consumer interest in clean-label, herbal-based skincare products and strong demand for multifunctional brightening and anti-aging solutions. Premium positioning of serums and creams, coupled with regulatory emphasis on product safety and transparency, is shaping the market landscape. Increasing popularity of e-commerce and specialty beauty retail formats is accelerating brand visibility, while UK consumers continue to prioritize sustainability and ethical sourcing. Collaborative innovation between established global brands and indie startups is fueling competition and portfolio expansion.

  • Premium skincare consumers are driving adoption of peony extract–based serums in brightening routines.
  • Clean-label and herbal claims are strengthening consumer trust and regulatory compliance.
  • E-commerce platforms and specialty retailers are expanding access to both global and indie beauty brands.

Growth and Expansion Outlook for Peony Extracts for Brightening Market in India

India is witnessing rapid growth in the Peony Extracts for Brightening Market, which is forecast to expand at a CAGR of 23.8% through 2035. Rising disposable incomes, urbanization, and increased awareness of skincare benefits are driving adoption beyond metro cities into tier-2 and tier-3 markets. Herbal and natural positioning resonates strongly with Indian consumers, where traditional beauty rituals align with the use of peony extracts. E-commerce platforms, influencer marketing, and expanding D2C beauty startups are accelerating access and affordability, while global and domestic brands are investing in localized formulations tailored to Indian skin types and climate conditions.

  • Tier-2 and tier-3 cities are emerging as high-growth markets due to digital retail penetration.
  • Herbal/natural claims align with India’s deep-rooted tradition of botanical skincare.
  • Local startups and global brands are expanding portfolios with region-specific formulations.

Sales Outlook for Peony Extracts for Brightening in China

The Peony Extracts for Brightening Market in China is expected to grow at a CAGR of 23.6%, the highest among leading economies. This momentum is fueled by strong consumer preference for herbal and natural skincare, cultural alignment with botanical remedies, and rapid adoption of premium brightening serums and creams. Domestic beauty brands are highly competitive, leveraging affordable formulations and localized marketing to capture mass adoption, while global players are expanding through cross-border e-commerce. Municipal emphasis on sustainability and clean-label regulations further strengthens consumer trust, positioning peony extracts as a central ingredient in China’s evolving beauty landscape.
  • Herbal/natural positioning resonates strongly with Chinese consumers, driving demand.
  • Domestic and global brands are leveraging e-commerce platforms for rapid expansion.
  • Clean-label regulations and sustainability goals are reinforcing trust in botanical actives.

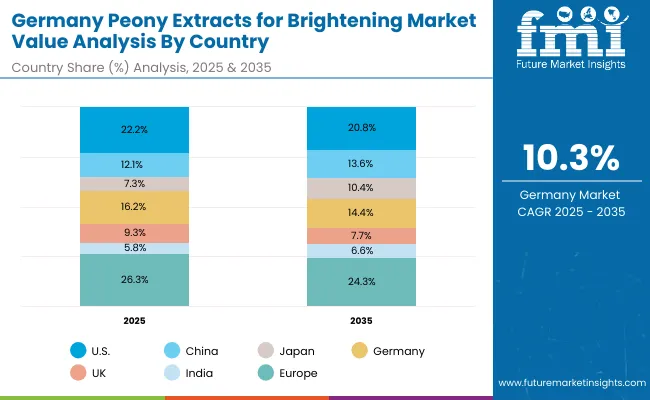
In-depth Analysis of Peony Extracts for Brightening in Germany

Europe Peony Extracts For Brightening Market

Countries 2025 Share (%)
USA 22.2%
China 12.1%
Japan 7.3%
Germany 16.2%
UK 9.3%
India 5.8%
Countries 2035 Share (%)
USA 20.8%
China 13.6%
Japan 10.4%
Germany 14.4%
UK 7.7%
India 6.6%

The Peony Extracts for Brightening Market in Germany is projected to grow at a CAGR of 10.3%, reflecting steady but slower expansion compared to high-growth Asian markets. Germany’s position as one of Europe’s largest skincare markets is supported by strong regulatory compliance under EU cosmetic standards, which reinforces consumer trust in clean-label and dermatologist-tested products. Demand for multifunctional formulations that combine brightening and anti-aging benefits continues to rise, particularly in serums and creams marketed through pharmacies and specialty beauty stores. However, Germany’s share of the global market is expected to ease from 16.2% in 2025 to 14.4% in 2035, as faster-growing markets like China and India expand their influence.
  • Dermatologist-tested formulations remain highly valued due to strict EU cosmetic regulations.
  • Serums and creams are the dominant product formats, distributed via pharmacies and specialty stores.
  • Sustainability and clean-label claims are critical to brand positioning and consumer loyalty in Germany.

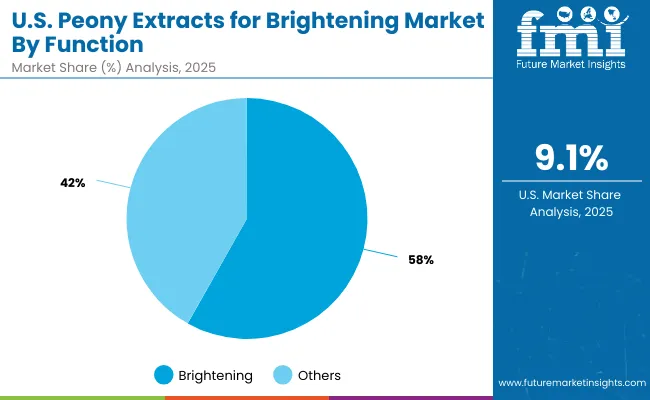
Growth Outlook for Peony Extracts for Brightening Market in USA

Usa Peony Extracts For Brightening Market By Function

USA by Function Value Share% 2025
Brightening 58.2%
Others 41.8%

The Peony Extracts for Brightening Market in the United States is projected at USD 191.5 million in 2025, expanding steadily at a CAGR of 9.1% to reach USD 613.5 million by 2035. Brightening functions dominate with a 58.2% share, reflecting strong consumer interest in products that target skin radiance and tone correction. Demand is reinforced by growing trust in dermatologist-tested and clean-label formulations, which are increasingly positioned in premium serum and cream formats. Unlike fast-growth Asian markets, the USA shows a balanced expansion driven by e-commerce, specialty retail, and pharmacy channels rather than aggressive low-cost rollouts. Sustainability and transparency remain critical purchase drivers, shaping brand strategies across both domestic and global players.
  • Brightening dominates USA functional demand with 58.2% share in 2025.
  • Dermatologist-tested and clean-label claims are driving consumer trust and product adoption.
  • E-commerce and specialty channels continue to expand market reach, complementing pharmacy sales.

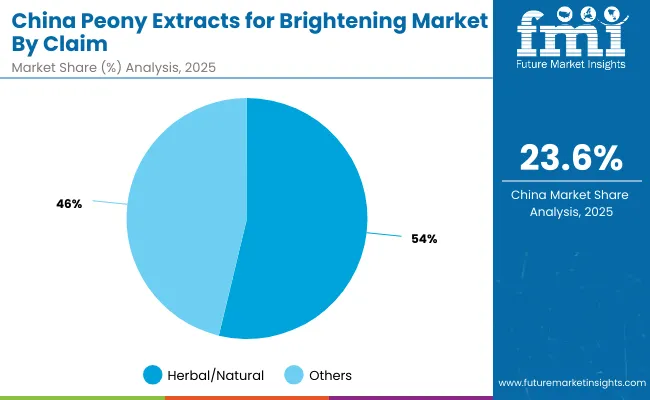
Opportunity Analysis of China Peony Extracts for Brightening Market

China Peony Extracts For Brightening Market By Claim

China by Claim Value Share% 2025
Herbal/natural 53.5%
Others 46.5%

The Peony Extracts for Brightening Market in China presents one of the strongest global opportunities, expanding at a CAGR of 23.6% through 2035. Herbal/natural claims lead with 53.5% share in 2025, reflecting deep cultural trust in botanical skincare traditions. This dominance is strengthened by consumer preference for safe, plant-based products and reinforced by regulatory policies encouraging clean-label and sustainable formulations. Domestic brands are highly competitive, leveraging affordability, heritage branding, and localized marketing, while global brands increasingly use cross-border e-commerce to tap into rising urban demand. Digital-first campaigns, influencer endorsements, and integration of herbal positioning into premium brightening serums are creating a robust growth trajectory.
  • Herbal/natural claims dominate with 53.5% share in 2025, aligning with cultural preferences.
  • Domestic brands are capitalizing on affordability and heritage positioning to drive mass adoption.
  • Cross-border e-commerce and social media marketing amplify the reach of global premium brands.

Competitive Landscape of Peony Extracts for Brightening Market

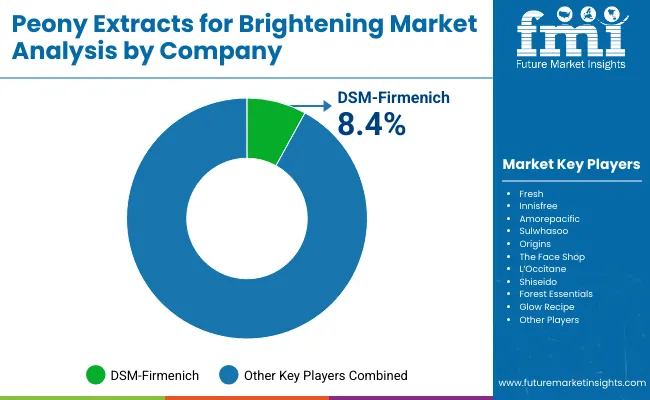
Peony Extracts For Brightening Market By Company

Company Global Value Share 2025
DSM- Firmenich 8.4%
Others 91.6%

The Peony Extracts for Brightening Market is moderately fragmented, with a mix of global ingredient suppliers, multinational beauty corporations, and niche botanical specialists competing across diverse segments. Global supplier DSM-Firmenich holds a leading position with 8.4% share, leveraging its expertise in active ingredients, standardized extracts, and partnerships with cosmetic brands. Its strategy focuses on delivering clinically supported formulations and securing regulatory compliance across international markets.

Multinational beauty players such as Amorepacific, Shiseido, L’Occitane, Sulwhasoo, Innisfree, and Origins dominate the finished product landscape, integrating peony extracts into premium serums, creams, and lotions. These companies are accelerating adoption through clean-label product launches, influencer-driven marketing, and strong presence across e-commerce and specialty retail channels. Niche-focused brands like Glow Recipe, Fresh, The Face Shop, and Forest Essentials differentiate by emphasizing herbal/natural claims, heritage positioning, and D2C-led consumer engagement. Their strength lies in creating cultural resonance and building loyal communities around authentic, plant-based skincare.

Competitive differentiation is shifting away from simple ingredient sourcing toward ecosystem strategies that combine clean-label positioning, sustainability certifications, and digital-first consumer engagement. As transparency, sustainability, and multifunctional efficacy become key purchase drivers, both global suppliers and brand-led innovators are intensifying competition to secure long-term market leadership.

Key Developments in Peony Extracts for Brightening Market

  • 2024: DSM-Firmenich expanded its botanical actives portfolio by strengthening supply chain partnerships in Asia, ensuring standardized sourcing of peony extracts to meet rising demand for herbal and natural brightening formulations.
  • 2025: K-beauty majors such as Amorepacific and Innisfree launched new peony extract–based brightening serums targeted at global e-commerce channels, emphasizing clean-label claims and multi-functional benefits to capture international premium skincare consumers.

Scope of the Report

Item Value
Quantitative Units USD 863.4 Million
Function Brightening, Anti-aging, Hydration, Repair
Product Type Serums, Creams/lotions, Masks, Toners
Channel E-commerce, Pharmacies, Specialty beauty stores, Mass retail
Claim Herbal/natural, Vegan, Clean-label, Dermatologist-tested
Regions Covered North America, Europe, Asia-Pacific, Latin America, Middle East & Africa
Country Covered United States, Canada, Germany, France, United Kingdom, China, Japan, India, Brazil, South Africa
Key Companies Profiled Fresh, Innisfree, Amorepacific, Sulwhasoo, Origins, The Face Shop, L’Occitane, Shiseido, Forest Essentials, Glow Recipe
Additional Attributes Dollar sales by function and product type, adoption trends in brightening and anti-aging skincare, rising demand for serums and premium concentrated formulations, sector-specific growth in pharmacies, e-commerce, and specialty beauty stores, revenue segmentation by herbal/natural and dermatologist-tested claims, integration with clean-label, vegan, and sustainability-focused innovations, regional trends influenced by cultural beauty traditions and regulatory standards, and innovations in formulation technologies, hybrid botanical blends, and advanced delivery systems.

Key Segments

By Function:

  • Brightening
  • Anti-aging
  • Hydration
  • Repair

By Product Type:

  • Serums
  • Creams/lotions
  • Masks
  • Toners

By Channel:

  • E-commerce
  • Pharmacies
  • Specialty beauty stores
  • Mass retail:

By Claim:

  • Herbal/natural
  • Dermatologist-tested
  • Vegan
  • Clean-label

By Region:

  • North America
  • Latin America
  • Europe
  • East Asia
  • South Asia & Pacific
  • Middle East and Africa

Table of Content

  1. Executive Summary
    • Global Market Outlook
    • Demand-side Trends
    • Supply-side Trends
    • Technology Roadmap Analysis
    • Analysis and Recommendations
  2. Market Overview
    • Market Coverage / Taxonomy
    • Market Definition / Scope / Limitations
  3. Market Background
    • Market Dynamics
      • Drivers
      • Restraints
      • Opportunity
      • Trends
    • Scenario Forecast
      • Demand in Optimistic Scenario
      • Demand in Likely Scenario
      • Demand in Conservative Scenario
    • Opportunity Map Analysis
    • Product Life Cycle Analysis
    • Supply Chain Analysis
      • Supply Side Participants and their Roles
        • Producers
        • Mid-Level Participants (Traders/ Agents/ Brokers)
        • Wholesalers and Distributors
      • Value Added and Value Created at Node in the Supply Chain
      • List of Raw Material Suppliers
      • List of Existing and Potential Buyer’s
    • Investment Feasibility Matrix
    • Value Chain Analysis
      • Profit Margin Analysis
      • Wholesalers and Distributors
      • Retailers
    • PESTLE and Porter’s Analysis
    • Regulatory Landscape
      • By Key Regions
      • By Key Countries
    • Regional Parent Market Outlook
    • Production and Consumption Statistics
    • Import and Export Statistics
  4. Global Market Analysis 2020 to 2024 and Forecast, 2025 to 2035
    • Historical Market Size Value (USD Million) & Volume (Units) Analysis, 2020 to 2024
    • Current and Future Market Size Value (USD Million) & Volume (Units) Projections, 2025 to 2035
      • Y-o-Y Growth Trend Analysis
      • Absolute $ Opportunity Analysis
  5. Global Market Analysis 2020 to 2024 and Forecast 2025 to 2035, By Function
    • Introduction / Key Findings
    • Historical Market Size Value (USD Million) & Volume (Units) Analysis By Function, 2020 to 2024
    • Current and Future Market Size Value (USD Million) & Volume (Units) Analysis and Forecast By Function, 2025 to 2035
      • Brightening
      • Anti-aging
      • Hydration
      • Repair
    • Y-o-Y Growth Trend Analysis By Function, 2020 to 2024
    • Absolute $ Opportunity Analysis By Function, 2025 to 2035
  6. Global Market Analysis 2020 to 2024 and Forecast 2025 to 2035, By Product Type
    • Introduction / Key Findings
    • Historical Market Size Value (USD Million) & Volume (Units) Analysis By Product Type, 2020 to 2024
    • Current and Future Market Size Value (USD Million) & Volume (Units) Analysis and Forecast By Product Type, 2025 to 2035
      • Serums
      • Creams/lotions
      • Masks
      • Toners
    • Y-o-Y Growth Trend Analysis By Product Type, 2020 to 2024
    • Absolute $ Opportunity Analysis By Product Type, 2025 to 2035
  7. Global Market Analysis 2020 to 2024 and Forecast 2025 to 2035, By Channel
    • Introduction / Key Findings
    • Historical Market Size Value (USD Million) & Volume (Units) Analysis By Channel, 2020 to 2024
    • Current and Future Market Size Value (USD Million) & Volume (Units) Analysis and Forecast By Channel, 2025 to 2035
      • E-commerce
      • Pharmacies
      • Specialty beauty stores
      • Mass retail
    • Y-o-Y Growth Trend Analysis By Channel, 2020 to 2024
    • Absolute $ Opportunity Analysis By Channel, 2025 to 2035
  8. Global Market Analysis 2020 to 2024 and Forecast 2025 to 2035, By Claim
    • Introduction / Key Findings
    • Historical Market Size Value (USD Million) & Volume (Units) Analysis By Claim, 2020 to 2024
    • Current and Future Market Size Value (USD Million) & Volume (Units) Analysis and Forecast By Claim, 2025 to 2035
      • Herbal/natural
      • Dermatologist-tested
      • Vegan
      • Clean-label
    • Y-o-Y Growth Trend Analysis By Claim, 2020 to 2024
    • Absolute $ Opportunity Analysis By Claim, 2025 to 2035
  9. Global Market Analysis 2020 to 2024 and Forecast 2025 to 2035, By Region
    • Introduction
    • Historical Market Size Value (USD Million) & Volume (Units) Analysis By Region, 2020 to 2024
    • Current Market Size Value (USD Million) & Volume (Units) Analysis and Forecast By Region, 2025 to 2035
      • North America
      • Latin America
      • Europe
      • East Asia
      • South Asia & Pacific
      • Middle East and Africa
    • Market Attractiveness Analysis By Region
  10. North America Market Analysis 2020 to 2024 and Forecast 2025 to 2035, By Country
    • Historical Market Size Value (USD Million) & Volume (Units) Trend Analysis By Market Taxonomy, 2020 to 2024
    • Market Size Value (USD Million) & Volume (Units) Forecast By Market Taxonomy, 2025 to 2035
      • By Country
        • U.S.
        • Canada
      • By Function
      • By Product Type
      • By Channel
      • By Claim
    • Market Attractiveness Analysis
      • By Country
      • By Function
      • By Product Type
      • By Channel
      • By Claim
    • Key Takeaways
  11. Latin America Market Analysis 2020 to 2024 and Forecast 2025 to 2035, By Country
    • Historical Market Size Value (USD Million) & Volume (Units) Trend Analysis By Market Taxonomy, 2020 to 2024
    • Market Size Value (USD Million) & Volume (Units) Forecast By Market Taxonomy, 2025 to 2035
      • By Country
        • Brazil
        • Mexico
        • Colombia
        • Rest of Latin America
      • By Function
      • By Product Type
      • By Channel
      • By Claim
    • Market Attractiveness Analysis
      • By Country
      • By Function
      • By Product Type
      • By Channel
      • By Claim
    • Key Takeaways
  12. Europe Market Analysis 2020 to 2024 and Forecast 2025 to 2035, By Country
    • Historical Market Size Value (USD Million) & Volume (Units) Trend Analysis By Market Taxonomy, 2020 to 2024
    • Market Size Value (USD Million) & Volume (Units) Forecast By Market Taxonomy, 2025 to 2035
      • By Country
        • Germany
        • U.K.
        • France
        • Italy
        • Spain
        • Belgium
        • Netherlands
        • Nordic
        • Switzerland
        • Russia
        • Poland
        • Rest of Europe
      • By Function
      • By Product Type
      • By Channel
      • By Claim
    • Market Attractiveness Analysis
      • By Country
      • By Function
      • By Product Type
      • By Channel
      • By Claim
    • Key Takeaways
  13. East Asia Market Analysis 2020 to 2024 and Forecast 2025 to 2035, By Country
    • Historical Market Size Value (USD Million) & Volume (Units) Trend Analysis By Market Taxonomy, 2020 to 2024
    • Market Size Value (USD Million) & Volume (Units) Forecast By Market Taxonomy, 2025 to 2035
      • By Country
        • China
        • Japan
        • South Korea
      • By Function
      • By Product Type
      • By Channel
      • By Claim
    • Market Attractiveness Analysis
      • By Country
      • By Function
      • By Product Type
      • By Channel
      • By Claim
    • Key Takeaways
  14. South Asia & Pacific Market Analysis 2020 to 2024 and Forecast 2025 to 2035, By Country
    • Historical Market Size Value (USD Million) & Volume (Units) Trend Analysis By Market Taxonomy, 2020 to 2024
    • Market Size Value (USD Million) & Volume (Units) Forecast By Market Taxonomy, 2025 to 2035
      • By Country
        • India
        • Thailand
        • Malaysia
        • Indonesia
        • Singapore
        • Vietnam
        • Australia
        • New Zealand
        • Rest of South Asia
      • By Function
      • By Product Type
      • By Channel
      • By Claim
    • Market Attractiveness Analysis
      • By Country
      • By Function
      • By Product Type
      • By Channel
      • By Claim
    • Key Takeaways
  15. Middle East and Africa Market Analysis 2020 to 2024 and Forecast 2025 to 2035, By Country
    • Historical Market Size Value (USD Million) & Volume (Units) Trend Analysis By Market Taxonomy, 2020 to 2024
    • Market Size Value (USD Million) & Volume (Units) Forecast By Market Taxonomy, 2025 to 2035
      • By Country
        • Turkey
        • UAE
        • Saudi Arabia
        • Israel
        • Other GCC Countries
        • North Africa
        • South Africa
      • By Function
      • By Product Type
      • By Channel
      • By Claim
    • Market Attractiveness Analysis
      • By Country
      • By Function
      • By Product Type
      • By Channel
      • By Claim
    • Key Takeaways
  16. Key Countries Market Analysis
    • U.S.
      • Pricing Analysis
      • Market Share Analysis, 2024
        • By Function
        • By Product Type
        • By Channel
        • By Claim
    • Canada
      • Pricing Analysis
      • Market Share Analysis, 2024
        • By Function
        • By Product Type
        • By Channel
        • By Claim
    • Brazil
      • Pricing Analysis
      • Market Share Analysis, 2024
        • By Function
        • By Product Type
        • By Channel
        • By Claim
    • Mexico
      • Pricing Analysis
      • Market Share Analysis, 2024
        • By Function
        • By Product Type
        • By Channel
        • By Claim
    • Colombia
      • Pricing Analysis
      • Market Share Analysis, 2024
        • By Function
        • By Product Type
        • By Channel
        • By Claim
    • Germany
      • Pricing Analysis
      • Market Share Analysis, 2024
        • By Function
        • By Product Type
        • By Channel
        • By Claim
    • U.K.
      • Pricing Analysis
      • Market Share Analysis, 2024
        • By Function
        • By Product Type
        • By Channel
        • By Claim
    • France
      • Pricing Analysis
      • Market Share Analysis, 2024
        • By Function
        • By Product Type
        • By Channel
        • By Claim
    • Italy
      • Pricing Analysis
      • Market Share Analysis, 2024
        • By Function
        • By Product Type
        • By Channel
        • By Claim
    • Spain
      • Pricing Analysis
      • Market Share Analysis, 2024
        • By Function
        • By Product Type
        • By Channel
        • By Claim
    • Belgium
      • Pricing Analysis
      • Market Share Analysis, 2024
        • By Function
        • By Product Type
        • By Channel
        • By Claim
    • Netherlands
      • Pricing Analysis
      • Market Share Analysis, 2024
        • By Function
        • By Product Type
        • By Channel
        • By Claim
    • Nordic
      • Pricing Analysis
      • Market Share Analysis, 2024
        • By Function
        • By Product Type
        • By Channel
        • By Claim
    • Switzerland
      • Pricing Analysis
      • Market Share Analysis, 2024
        • By Function
        • By Product Type
        • By Channel
        • By Claim
    • Russia
      • Pricing Analysis
      • Market Share Analysis, 2024
        • By Function
        • By Product Type
        • By Channel
        • By Claim
    • Poland
      • Pricing Analysis
      • Market Share Analysis, 2024
        • By Function
        • By Product Type
        • By Channel
        • By Claim
    • China
      • Pricing Analysis
      • Market Share Analysis, 2024
        • By Function
        • By Product Type
        • By Channel
        • By Claim
    • Japan
      • Pricing Analysis
      • Market Share Analysis, 2024
        • By Function
        • By Product Type
        • By Channel
        • By Claim
    • South Korea
      • Pricing Analysis
      • Market Share Analysis, 2024
        • By Function
        • By Product Type
        • By Channel
        • By Claim
    • India
      • Pricing Analysis
      • Market Share Analysis, 2024
        • By Function
        • By Product Type
        • By Channel
        • By Claim
    • Thailand
      • Pricing Analysis
      • Market Share Analysis, 2024
        • By Function
        • By Product Type
        • By Channel
        • By Claim
    • Indonesia
      • Pricing Analysis
      • Market Share Analysis, 2024
        • By Function
        • By Product Type
        • By Channel
        • By Claim
    • Australia
      • Pricing Analysis
      • Market Share Analysis, 2024
        • By Function
        • By Product Type
        • By Channel
        • By Claim
    • New Zealand
      • Pricing Analysis
      • Market Share Analysis, 2024
        • By Function
        • By Product Type
        • By Channel
        • By Claim
    • Turkey
      • Pricing Analysis
      • Market Share Analysis, 2024
        • By Function
        • By Product Type
        • By Channel
        • By Claim
    • UAE
      • Pricing Analysis
      • Market Share Analysis, 2024
        • By Function
        • By Product Type
        • By Channel
        • By Claim
    • Saudi Arabia
      • Pricing Analysis
      • Market Share Analysis, 2024
        • By Function
        • By Product Type
        • By Channel
        • By Claim
    • Israel
      • Pricing Analysis
      • Market Share Analysis, 2024
        • By Function
        • By Product Type
        • By Channel
        • By Claim
    • North Africa
      • Pricing Analysis
      • Market Share Analysis, 2024
        • By Function
        • By Product Type
        • By Channel
        • By Claim
    • South Africa
      • Pricing Analysis
      • Market Share Analysis, 2024
        • By Function
        • By Product Type
        • By Channel
        • By Claim
  17. Market Structure Analysis
    • Competition Dashboard
    • Competition Benchmarking
    • Market Share Analysis of Top Players
      • By Regional
      • By Function
      • By Product Type
      • By Channel
      • By Claim
  18. Competition Analysis
    • Competition Deep Dive
      • Fresh
        • Overview
        • Product Portfolio
        • Profitability by Market Segments (Product/Age /Sales Channel/Region)
        • Sales Footprint
        • Strategy Overview
          • Marketing Strategy
          • Product Strategy
          • Channel Strategy
      • Innisfree
        • Overview
        • Product Portfolio
        • Profitability by Market Segments (Product/Age /Sales Channel/Region)
        • Sales Footprint
        • Strategy Overview
          • Marketing Strategy
          • Product Strategy
          • Channel Strategy
      • Amorepacific
        • Overview
        • Product Portfolio
        • Profitability by Market Segments (Product/Age /Sales Channel/Region)
        • Sales Footprint
        • Strategy Overview
          • Marketing Strategy
          • Product Strategy
          • Channel Strategy
      • Sulwhasoo
        • Overview
        • Product Portfolio
        • Profitability by Market Segments (Product/Age /Sales Channel/Region)
        • Sales Footprint
        • Strategy Overview
          • Marketing Strategy
          • Product Strategy
          • Channel Strategy
      • Origins
        • Overview
        • Product Portfolio
        • Profitability by Market Segments (Product/Age /Sales Channel/Region)
        • Sales Footprint
        • Strategy Overview
          • Marketing Strategy
          • Product Strategy
          • Channel Strategy
      • The Face Shop
        • Overview
        • Product Portfolio
        • Profitability by Market Segments (Product/Age /Sales Channel/Region)
        • Sales Footprint
        • Strategy Overview
          • Marketing Strategy
          • Product Strategy
          • Channel Strategy
      • L’Occitane
        • Overview
        • Product Portfolio
        • Profitability by Market Segments (Product/Age /Sales Channel/Region)
        • Sales Footprint
        • Strategy Overview
          • Marketing Strategy
          • Product Strategy
          • Channel Strategy
      • Shiseido
        • Overview
        • Product Portfolio
        • Profitability by Market Segments (Product/Age /Sales Channel/Region)
        • Sales Footprint
        • Strategy Overview
          • Marketing Strategy
          • Product Strategy
          • Channel Strategy
      • Forest Essentials
        • Overview
        • Product Portfolio
        • Profitability by Market Segments (Product/Age /Sales Channel/Region)
        • Sales Footprint
        • Strategy Overview
          • Marketing Strategy
          • Product Strategy
          • Channel Strategy
      • Glow Recipe
        • Overview
        • Product Portfolio
        • Profitability by Market Segments (Product/Age /Sales Channel/Region)
        • Sales Footprint
        • Strategy Overview
          • Marketing Strategy
          • Product Strategy
          • Channel Strategy
      • Others
        • Overview
        • Product Portfolio
        • Profitability by Market Segments (Product/Age /Sales Channel/Region)
        • Sales Footprint
        • Strategy Overview
          • Marketing Strategy
          • Product Strategy
          • Channel Strategy
  19. Assumptions & Acronyms Used
  20. Research Methodology

List of Tables

  • Table 1: Global Market Value (USD Million) Forecast by Region, 2020-2035
  • Table 2: Global Market Volume (Units) Forecast by Region, 2020-2035
  • Table 3: Global Market Value (USD Million) Forecast by Function, 2020-2035
  • Table 4: Global Market Volume (Units) Forecast by Function, 2020-2035
  • Table 5: Global Market Value (USD Million) Forecast by Product Type, 2020-2035
  • Table 6: Global Market Volume (Units) Forecast by Product Type, 2020-2035
  • Table 7: Global Market Value (USD Million) Forecast by Channel, 2020-2035
  • Table 8: Global Market Volume (Units) Forecast by Channel, 2020-2035
  • Table 9: Global Market Value (USD Million) Forecast by Claim, 2020-2035
  • Table 10: Global Market Volume (Units) Forecast by Claim, 2020-2035
  • Table 11: North America Market Value (USD Million) Forecast by Country, 2020-2035
  • Table 12: North America Market Volume (Units) Forecast by Country, 2020-2035
  • Table 13: North America Market Value (USD Million) Forecast by Function, 2020-2035
  • Table 14: North America Market Volume (Units) Forecast by Function, 2020-2035
  • Table 15: North America Market Value (USD Million) Forecast by Product Type, 2020-2035
  • Table 16: North America Market Volume (Units) Forecast by Product Type, 2020-2035
  • Table 17: North America Market Value (USD Million) Forecast by Channel, 2020-2035
  • Table 18: North America Market Volume (Units) Forecast by Channel, 2020-2035
  • Table 19: North America Market Value (USD Million) Forecast by Claim, 2020-2035
  • Table 20: North America Market Volume (Units) Forecast by Claim, 2020-2035
  • Table 21: Latin America Market Value (USD Million) Forecast by Country, 2020-2035
  • Table 22: Latin America Market Volume (Units) Forecast by Country, 2020-2035
  • Table 23: Latin America Market Value (USD Million) Forecast by Function, 2020-2035
  • Table 24: Latin America Market Volume (Units) Forecast by Function, 2020-2035
  • Table 25: Latin America Market Value (USD Million) Forecast by Product Type, 2020-2035
  • Table 26: Latin America Market Volume (Units) Forecast by Product Type, 2020-2035
  • Table 27: Latin America Market Value (USD Million) Forecast by Channel, 2020-2035
  • Table 28: Latin America Market Volume (Units) Forecast by Channel, 2020-2035
  • Table 29: Latin America Market Value (USD Million) Forecast by Claim, 2020-2035
  • Table 30: Latin America Market Volume (Units) Forecast by Claim, 2020-2035
  • Table 31: Europe Market Value (USD Million) Forecast by Country, 2020-2035
  • Table 32: Europe Market Volume (Units) Forecast by Country, 2020-2035
  • Table 33: Europe Market Value (USD Million) Forecast by Function, 2020-2035
  • Table 34: Europe Market Volume (Units) Forecast by Function, 2020-2035
  • Table 35: Europe Market Value (USD Million) Forecast by Product Type, 2020-2035
  • Table 36: Europe Market Volume (Units) Forecast by Product Type, 2020-2035
  • Table 37: Europe Market Value (USD Million) Forecast by Channel, 2020-2035
  • Table 38: Europe Market Volume (Units) Forecast by Channel, 2020-2035
  • Table 39: Europe Market Value (USD Million) Forecast by Claim, 2020-2035
  • Table 40: Europe Market Volume (Units) Forecast by Claim, 2020-2035
  • Table 41: East Asia Market Value (USD Million) Forecast by Country, 2020-2035
  • Table 42: East Asia Market Volume (Units) Forecast by Country, 2020-2035
  • Table 43: East Asia Market Value (USD Million) Forecast by Function, 2020-2035
  • Table 44: East Asia Market Volume (Units) Forecast by Function, 2020-2035
  • Table 45: East Asia Market Value (USD Million) Forecast by Product Type, 2020-2035
  • Table 46: East Asia Market Volume (Units) Forecast by Product Type, 2020-2035
  • Table 47: East Asia Market Value (USD Million) Forecast by Channel, 2020-2035
  • Table 48: East Asia Market Volume (Units) Forecast by Channel, 2020-2035
  • Table 49: East Asia Market Value (USD Million) Forecast by Claim, 2020-2035
  • Table 50: East Asia Market Volume (Units) Forecast by Claim, 2020-2035
  • Table 51: South Asia & Pacific Market Value (USD Million) Forecast by Country, 2020-2035
  • Table 52: South Asia & Pacific Market Volume (Units) Forecast by Country, 2020-2035
  • Table 53: South Asia & Pacific Market Value (USD Million) Forecast by Function, 2020-2035
  • Table 54: South Asia & Pacific Market Volume (Units) Forecast by Function, 2020-2035
  • Table 55: South Asia & Pacific Market Value (USD Million) Forecast by Product Type, 2020-2035
  • Table 56: South Asia & Pacific Market Volume (Units) Forecast by Product Type, 2020-2035
  • Table 57: South Asia & Pacific Market Value (USD Million) Forecast by Channel, 2020-2035
  • Table 58: South Asia & Pacific Market Volume (Units) Forecast by Channel, 2020-2035
  • Table 59: South Asia & Pacific Market Value (USD Million) Forecast by Claim, 2020-2035
  • Table 60: South Asia & Pacific Market Volume (Units) Forecast by Claim, 2020-2035
  • Table 61: Middle East and Africa Market Value (USD Million) Forecast by Country, 2020-2035
  • Table 62: Middle East and Africa Market Volume (Units) Forecast by Country, 2020-2035
  • Table 63: Middle East and Africa Market Value (USD Million) Forecast by Function, 2020-2035
  • Table 64: Middle East and Africa Market Volume (Units) Forecast by Function, 2020-2035
  • Table 65: Middle East and Africa Market Value (USD Million) Forecast by Product Type, 2020-2035
  • Table 66: Middle East and Africa Market Volume (Units) Forecast by Product Type, 2020-2035
  • Table 67: Middle East and Africa Market Value (USD Million) Forecast by Channel, 2020-2035
  • Table 68: Middle East and Africa Market Volume (Units) Forecast by Channel, 2020-2035
  • Table 69: Middle East and Africa Market Value (USD Million) Forecast by Claim, 2020-2035
  • Table 70: Middle East and Africa Market Volume (Units) Forecast by Claim, 2020-2035

List of Figures

  • Figure 1: Global Market Value (USD Million) by Function, 2025-2035
  • Figure 2: Global Market Value (USD Million) by Product Type, 2025-2035
  • Figure 3: Global Market Value (USD Million) by Channel, 2025-2035
  • Figure 4: Global Market Value (USD Million) by Claim, 2025-2035
  • Figure 5: Global Market Value (USD Million) by Region, 2025-2035
  • Figure 6: Global Market Value (USD Million) Analysis by Region, 2020-2035
  • Figure 7: Global Market Volume (Units) Analysis by Region, 2020-2035
  • Figure 8: Global Market Value Share (%) and BPS Analysis by Region, 2025-2035
  • Figure 9: Global Market Y-o-Y Growth (%) Projections by Region, 2025-2035
  • Figure 10: Global Market Value (USD Million) Analysis by Function, 2020-2035
  • Figure 11: Global Market Volume (Units) Analysis by Function, 2020-2035
  • Figure 12: Global Market Value Share (%) and BPS Analysis by Function, 2025-2035
  • Figure 13: Global Market Y-o-Y Growth (%) Projections by Function, 2025-2035
  • Figure 14: Global Market Value (USD Million) Analysis by Product Type, 2020-2035
  • Figure 15: Global Market Volume (Units) Analysis by Product Type, 2020-2035
  • Figure 16: Global Market Value Share (%) and BPS Analysis by Product Type, 2025-2035
  • Figure 17: Global Market Y-o-Y Growth (%) Projections by Product Type, 2025-2035
  • Figure 18: Global Market Value (USD Million) Analysis by Channel, 2020-2035
  • Figure 19: Global Market Volume (Units) Analysis by Channel, 2020-2035
  • Figure 20: Global Market Value Share (%) and BPS Analysis by Channel, 2025-2035
  • Figure 21: Global Market Y-o-Y Growth (%) Projections by Channel, 2025-2035
  • Figure 22: Global Market Value (USD Million) Analysis by Claim, 2020-2035
  • Figure 23: Global Market Volume (Units) Analysis by Claim, 2020-2035
  • Figure 24: Global Market Value Share (%) and BPS Analysis by Claim, 2025-2035
  • Figure 25: Global Market Y-o-Y Growth (%) Projections by Claim, 2025-2035
  • Figure 26: Global Market Attractiveness by Function, 2025-2035
  • Figure 27: Global Market Attractiveness by Product Type, 2025-2035
  • Figure 28: Global Market Attractiveness by Channel, 2025-2035
  • Figure 29: Global Market Attractiveness by Claim, 2025-2035
  • Figure 30: Global Market Attractiveness by Region, 2025-2035
  • Figure 31: North America Market Value (USD Million) by Function, 2025-2035
  • Figure 32: North America Market Value (USD Million) by Product Type, 2025-2035
  • Figure 33: North America Market Value (USD Million) by Channel, 2025-2035
  • Figure 34: North America Market Value (USD Million) by Claim, 2025-2035
  • Figure 35: North America Market Value (USD Million) by Country, 2025-2035
  • Figure 36: North America Market Value (USD Million) Analysis by Country, 2020-2035
  • Figure 37: North America Market Volume (Units) Analysis by Country, 2020-2035
  • Figure 38: North America Market Value Share (%) and BPS Analysis by Country, 2025-2035
  • Figure 39: North America Market Y-o-Y Growth (%) Projections by Country, 2025-2035
  • Figure 40: North America Market Value (USD Million) Analysis by Function, 2020-2035
  • Figure 41: North America Market Volume (Units) Analysis by Function, 2020-2035
  • Figure 42: North America Market Value Share (%) and BPS Analysis by Function, 2025-2035
  • Figure 43: North America Market Y-o-Y Growth (%) Projections by Function, 2025-2035
  • Figure 44: North America Market Value (USD Million) Analysis by Product Type, 2020-2035
  • Figure 45: North America Market Volume (Units) Analysis by Product Type, 2020-2035
  • Figure 46: North America Market Value Share (%) and BPS Analysis by Product Type, 2025-2035
  • Figure 47: North America Market Y-o-Y Growth (%) Projections by Product Type, 2025-2035
  • Figure 48: North America Market Value (USD Million) Analysis by Channel, 2020-2035
  • Figure 49: North America Market Volume (Units) Analysis by Channel, 2020-2035
  • Figure 50: North America Market Value Share (%) and BPS Analysis by Channel, 2025-2035
  • Figure 51: North America Market Y-o-Y Growth (%) Projections by Channel, 2025-2035
  • Figure 52: North America Market Value (USD Million) Analysis by Claim, 2020-2035
  • Figure 53: North America Market Volume (Units) Analysis by Claim, 2020-2035
  • Figure 54: North America Market Value Share (%) and BPS Analysis by Claim, 2025-2035
  • Figure 55: North America Market Y-o-Y Growth (%) Projections by Claim, 2025-2035
  • Figure 56: North America Market Attractiveness by Function, 2025-2035
  • Figure 57: North America Market Attractiveness by Product Type, 2025-2035
  • Figure 58: North America Market Attractiveness by Channel, 2025-2035
  • Figure 59: North America Market Attractiveness by Claim, 2025-2035
  • Figure 60: North America Market Attractiveness by Country, 2025-2035
  • Figure 61: Latin America Market Value (USD Million) by Function, 2025-2035
  • Figure 62: Latin America Market Value (USD Million) by Product Type, 2025-2035
  • Figure 63: Latin America Market Value (USD Million) by Channel, 2025-2035
  • Figure 64: Latin America Market Value (USD Million) by Claim, 2025-2035
  • Figure 65: Latin America Market Value (USD Million) by Country, 2025-2035
  • Figure 66: Latin America Market Value (USD Million) Analysis by Country, 2020-2035
  • Figure 67: Latin America Market Volume (Units) Analysis by Country, 2020-2035
  • Figure 68: Latin America Market Value Share (%) and BPS Analysis by Country, 2025-2035
  • Figure 69: Latin America Market Y-o-Y Growth (%) Projections by Country, 2025-2035
  • Figure 70: Latin America Market Value (USD Million) Analysis by Function, 2020-2035
  • Figure 71: Latin America Market Volume (Units) Analysis by Function, 2020-2035
  • Figure 72: Latin America Market Value Share (%) and BPS Analysis by Function, 2025-2035
  • Figure 73: Latin America Market Y-o-Y Growth (%) Projections by Function, 2025-2035
  • Figure 74: Latin America Market Value (USD Million) Analysis by Product Type, 2020-2035
  • Figure 75: Latin America Market Volume (Units) Analysis by Product Type, 2020-2035
  • Figure 76: Latin America Market Value Share (%) and BPS Analysis by Product Type, 2025-2035
  • Figure 77: Latin America Market Y-o-Y Growth (%) Projections by Product Type, 2025-2035
  • Figure 78: Latin America Market Value (USD Million) Analysis by Channel, 2020-2035
  • Figure 79: Latin America Market Volume (Units) Analysis by Channel, 2020-2035
  • Figure 80: Latin America Market Value Share (%) and BPS Analysis by Channel, 2025-2035
  • Figure 81: Latin America Market Y-o-Y Growth (%) Projections by Channel, 2025-2035
  • Figure 82: Latin America Market Value (USD Million) Analysis by Claim, 2020-2035
  • Figure 83: Latin America Market Volume (Units) Analysis by Claim, 2020-2035
  • Figure 84: Latin America Market Value Share (%) and BPS Analysis by Claim, 2025-2035
  • Figure 85: Latin America Market Y-o-Y Growth (%) Projections by Claim, 2025-2035
  • Figure 86: Latin America Market Attractiveness by Function, 2025-2035
  • Figure 87: Latin America Market Attractiveness by Product Type, 2025-2035
  • Figure 88: Latin America Market Attractiveness by Channel, 2025-2035
  • Figure 89: Latin America Market Attractiveness by Claim, 2025-2035
  • Figure 90: Latin America Market Attractiveness by Country, 2025-2035
  • Figure 91: Europe Market Value (USD Million) by Function, 2025-2035
  • Figure 92: Europe Market Value (USD Million) by Product Type, 2025-2035
  • Figure 93: Europe Market Value (USD Million) by Channel, 2025-2035
  • Figure 94: Europe Market Value (USD Million) by Claim, 2025-2035
  • Figure 95: Europe Market Value (USD Million) by Country, 2025-2035
  • Figure 96: Europe Market Value (USD Million) Analysis by Country, 2020-2035
  • Figure 97: Europe Market Volume (Units) Analysis by Country, 2020-2035
  • Figure 98: Europe Market Value Share (%) and BPS Analysis by Country, 2025-2035
  • Figure 99: Europe Market Y-o-Y Growth (%) Projections by Country, 2025-2035
  • Figure 100: Europe Market Value (USD Million) Analysis by Function, 2020-2035
  • Figure 101: Europe Market Volume (Units) Analysis by Function, 2020-2035
  • Figure 102: Europe Market Value Share (%) and BPS Analysis by Function, 2025-2035
  • Figure 103: Europe Market Y-o-Y Growth (%) Projections by Function, 2025-2035
  • Figure 104: Europe Market Value (USD Million) Analysis by Product Type, 2020-2035
  • Figure 105: Europe Market Volume (Units) Analysis by Product Type, 2020-2035
  • Figure 106: Europe Market Value Share (%) and BPS Analysis by Product Type, 2025-2035
  • Figure 107: Europe Market Y-o-Y Growth (%) Projections by Product Type, 2025-2035
  • Figure 108: Europe Market Value (USD Million) Analysis by Channel, 2020-2035
  • Figure 109: Europe Market Volume (Units) Analysis by Channel, 2020-2035
  • Figure 110: Europe Market Value Share (%) and BPS Analysis by Channel, 2025-2035
  • Figure 111: Europe Market Y-o-Y Growth (%) Projections by Channel, 2025-2035
  • Figure 112: Europe Market Value (USD Million) Analysis by Claim, 2020-2035
  • Figure 113: Europe Market Volume (Units) Analysis by Claim, 2020-2035
  • Figure 114: Europe Market Value Share (%) and BPS Analysis by Claim, 2025-2035
  • Figure 115: Europe Market Y-o-Y Growth (%) Projections by Claim, 2025-2035
  • Figure 116: Europe Market Attractiveness by Function, 2025-2035
  • Figure 117: Europe Market Attractiveness by Product Type, 2025-2035
  • Figure 118: Europe Market Attractiveness by Channel, 2025-2035
  • Figure 119: Europe Market Attractiveness by Claim, 2025-2035
  • Figure 120: Europe Market Attractiveness by Country, 2025-2035
  • Figure 121: East Asia Market Value (USD Million) by Function, 2025-2035
  • Figure 122: East Asia Market Value (USD Million) by Product Type, 2025-2035
  • Figure 123: East Asia Market Value (USD Million) by Channel, 2025-2035
  • Figure 124: East Asia Market Value (USD Million) by Claim, 2025-2035
  • Figure 125: East Asia Market Value (USD Million) by Country, 2025-2035
  • Figure 126: East Asia Market Value (USD Million) Analysis by Country, 2020-2035
  • Figure 127: East Asia Market Volume (Units) Analysis by Country, 2020-2035
  • Figure 128: East Asia Market Value Share (%) and BPS Analysis by Country, 2025-2035
  • Figure 129: East Asia Market Y-o-Y Growth (%) Projections by Country, 2025-2035
  • Figure 130: East Asia Market Value (USD Million) Analysis by Function, 2020-2035
  • Figure 131: East Asia Market Volume (Units) Analysis by Function, 2020-2035
  • Figure 132: East Asia Market Value Share (%) and BPS Analysis by Function, 2025-2035
  • Figure 133: East Asia Market Y-o-Y Growth (%) Projections by Function, 2025-2035
  • Figure 134: East Asia Market Value (USD Million) Analysis by Product Type, 2020-2035
  • Figure 135: East Asia Market Volume (Units) Analysis by Product Type, 2020-2035
  • Figure 136: East Asia Market Value Share (%) and BPS Analysis by Product Type, 2025-2035
  • Figure 137: East Asia Market Y-o-Y Growth (%) Projections by Product Type, 2025-2035
  • Figure 138: East Asia Market Value (USD Million) Analysis by Channel, 2020-2035
  • Figure 139: East Asia Market Volume (Units) Analysis by Channel, 2020-2035
  • Figure 140: East Asia Market Value Share (%) and BPS Analysis by Channel, 2025-2035
  • Figure 141: East Asia Market Y-o-Y Growth (%) Projections by Channel, 2025-2035
  • Figure 142: East Asia Market Value (USD Million) Analysis by Claim, 2020-2035
  • Figure 143: East Asia Market Volume (Units) Analysis by Claim, 2020-2035
  • Figure 144: East Asia Market Value Share (%) and BPS Analysis by Claim, 2025-2035
  • Figure 145: East Asia Market Y-o-Y Growth (%) Projections by Claim, 2025-2035
  • Figure 146: East Asia Market Attractiveness by Function, 2025-2035
  • Figure 147: East Asia Market Attractiveness by Product Type, 2025-2035
  • Figure 148: East Asia Market Attractiveness by Channel, 2025-2035
  • Figure 149: East Asia Market Attractiveness by Claim, 2025-2035
  • Figure 150: East Asia Market Attractiveness by Country, 2025-2035
  • Figure 151: South Asia & Pacific Market Value (USD Million) by Function, 2025-2035
  • Figure 152: South Asia & Pacific Market Value (USD Million) by Product Type, 2025-2035
  • Figure 153: South Asia & Pacific Market Value (USD Million) by Channel, 2025-2035
  • Figure 154: South Asia & Pacific Market Value (USD Million) by Claim, 2025-2035
  • Figure 155: South Asia & Pacific Market Value (USD Million) by Country, 2025-2035
  • Figure 156: South Asia & Pacific Market Value (USD Million) Analysis by Country, 2020-2035
  • Figure 157: South Asia & Pacific Market Volume (Units) Analysis by Country, 2020-2035
  • Figure 158: South Asia & Pacific Market Value Share (%) and BPS Analysis by Country, 2025-2035
  • Figure 159: South Asia & Pacific Market Y-o-Y Growth (%) Projections by Country, 2025-2035
  • Figure 160: South Asia & Pacific Market Value (USD Million) Analysis by Function, 2020-2035
  • Figure 161: South Asia & Pacific Market Volume (Units) Analysis by Function, 2020-2035
  • Figure 162: South Asia & Pacific Market Value Share (%) and BPS Analysis by Function, 2025-2035
  • Figure 163: South Asia & Pacific Market Y-o-Y Growth (%) Projections by Function, 2025-2035
  • Figure 164: South Asia & Pacific Market Value (USD Million) Analysis by Product Type, 2020-2035
  • Figure 165: South Asia & Pacific Market Volume (Units) Analysis by Product Type, 2020-2035
  • Figure 166: South Asia & Pacific Market Value Share (%) and BPS Analysis by Product Type, 2025-2035
  • Figure 167: South Asia & Pacific Market Y-o-Y Growth (%) Projections by Product Type, 2025-2035
  • Figure 168: South Asia & Pacific Market Value (USD Million) Analysis by Channel, 2020-2035
  • Figure 169: South Asia & Pacific Market Volume (Units) Analysis by Channel, 2020-2035
  • Figure 170: South Asia & Pacific Market Value Share (%) and BPS Analysis by Channel, 2025-2035
  • Figure 171: South Asia & Pacific Market Y-o-Y Growth (%) Projections by Channel, 2025-2035
  • Figure 172: South Asia & Pacific Market Value (USD Million) Analysis by Claim, 2020-2035
  • Figure 173: South Asia & Pacific Market Volume (Units) Analysis by Claim, 2020-2035
  • Figure 174: South Asia & Pacific Market Value Share (%) and BPS Analysis by Claim, 2025-2035
  • Figure 175: South Asia & Pacific Market Y-o-Y Growth (%) Projections by Claim, 2025-2035
  • Figure 176: South Asia & Pacific Market Attractiveness by Function, 2025-2035
  • Figure 177: South Asia & Pacific Market Attractiveness by Product Type, 2025-2035
  • Figure 178: South Asia & Pacific Market Attractiveness by Channel, 2025-2035
  • Figure 179: South Asia & Pacific Market Attractiveness by Claim, 2025-2035
  • Figure 180: South Asia & Pacific Market Attractiveness by Country, 2025-2035
  • Figure 181: Middle East and Africa Market Value (USD Million) by Function, 2025-2035
  • Figure 182: Middle East and Africa Market Value (USD Million) by Product Type, 2025-2035
  • Figure 183: Middle East and Africa Market Value (USD Million) by Channel, 2025-2035
  • Figure 184: Middle East and Africa Market Value (USD Million) by Claim, 2025-2035
  • Figure 185: Middle East and Africa Market Value (USD Million) by Country, 2025-2035
  • Figure 186: Middle East and Africa Market Value (USD Million) Analysis by Country, 2020-2035
  • Figure 187: Middle East and Africa Market Volume (Units) Analysis by Country, 2020-2035
  • Figure 188: Middle East and Africa Market Value Share (%) and BPS Analysis by Country, 2025-2035
  • Figure 189: Middle East and Africa Market Y-o-Y Growth (%) Projections by Country, 2025-2035
  • Figure 190: Middle East and Africa Market Value (USD Million) Analysis by Function, 2020-2035
  • Figure 191: Middle East and Africa Market Volume (Units) Analysis by Function, 2020-2035
  • Figure 192: Middle East and Africa Market Value Share (%) and BPS Analysis by Function, 2025-2035
  • Figure 193: Middle East and Africa Market Y-o-Y Growth (%) Projections by Function, 2025-2035
  • Figure 194: Middle East and Africa Market Value (USD Million) Analysis by Product Type, 2020-2035
  • Figure 195: Middle East and Africa Market Volume (Units) Analysis by Product Type, 2020-2035
  • Figure 196: Middle East and Africa Market Value Share (%) and BPS Analysis by Product Type, 2025-2035
  • Figure 197: Middle East and Africa Market Y-o-Y Growth (%) Projections by Product Type, 2025-2035
  • Figure 198: Middle East and Africa Market Value (USD Million) Analysis by Channel, 2020-2035
  • Figure 199: Middle East and Africa Market Volume (Units) Analysis by Channel, 2020-2035
  • Figure 200: Middle East and Africa Market Value Share (%) and BPS Analysis by Channel, 2025-2035
  • Figure 201: Middle East and Africa Market Y-o-Y Growth (%) Projections by Channel, 2025-2035
  • Figure 202: Middle East and Africa Market Value (USD Million) Analysis by Claim, 2020-2035
  • Figure 203: Middle East and Africa Market Volume (Units) Analysis by Claim, 2020-2035
  • Figure 204: Middle East and Africa Market Value Share (%) and BPS Analysis by Claim, 2025-2035
  • Figure 205: Middle East and Africa Market Y-o-Y Growth (%) Projections by Claim, 2025-2035
  • Figure 206: Middle East and Africa Market Attractiveness by Function, 2025-2035
  • Figure 207: Middle East and Africa Market Attractiveness by Product Type, 2025-2035
  • Figure 208: Middle East and Africa Market Attractiveness by Channel, 2025-2035
  • Figure 209: Middle East and Africa Market Attractiveness by Claim, 2025-2035
  • Figure 210: Middle East and Africa Market Attractiveness by Country, 2025-2035

Frequently Asked Questions

How big is the Peony Extracts for Brightening Market in 2025?

The global Peony Extracts for Brightening Market is estimated to be valued at USD 863.4 million in 2025.

What will be the size of Peony Extracts for Brightening Market in 2035?

The market size for the Peony Extracts for Brightening Market is projected to reach USD 2,945.1 million by 2035.

How much will be the Peony Extracts for Brightening Market growth between 2025 and 2035?

The Peony Extracts for Brightening Market is expected to grow at a 13.1% CAGR between 2025 and 2035.

What are the key product types in the Peony Extracts for Brightening Market?

The key product types in the Peony Extracts for Brightening Market are serums, creams/lotions, masks, and toners.

Which product type segment is expected to contribute a significant share in the Peony Extracts for Brightening Market in 2025?

In terms of product type, the serums segment is expected to command the largest share in 2025, accounting for 48.5% of the market, driven by rising consumer demand for concentrated and effective brightening solutions.

Explore Similar Insights

Future Market Insights

Peony Extracts for Brightening Market

Chat With

MaRIA

Hi There, I am MaRIA, Your Market Research Intelligence Assistant. How may I help you?