Aloe Vera Extracts Market Size and Share Forecast Outlook 2025 to 2035

The global aloe vera extracts market is estimated to be worth USD 3.97 billion by 2025 and is projected to reach a value of USD 8.29 billion by 2035, reflecting a CAGR of 6.5% over the assessment period 2025 to 2035.
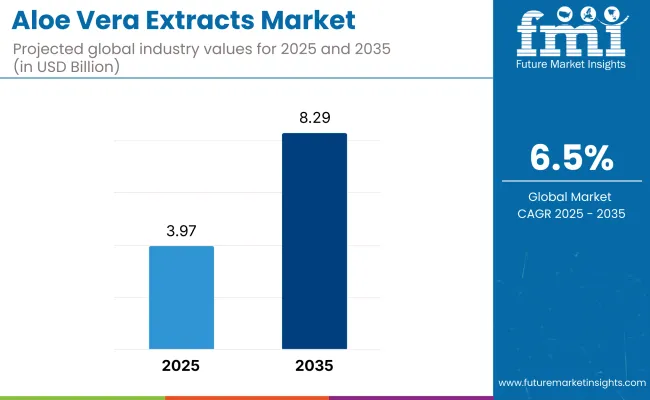
This growth trajectory underscores the steady rise in demand for plant-based and natural wellness ingredients, especially those positioned at the intersection of therapeutic efficacy and cosmetic applications. Aloe vera extract has continued to hold an indispensable place in both personal care and nutraceutical sectors due to its anti-inflammatory, moisturizing, and antioxidant properties, which have been validated through various peer-reviewed dermatological studies.

The cosmetics segment is anticipated to maintain its dominant share throughout the forecast period, as consumer preference shifts increasingly toward clean-label skincare formulations free from synthetic additives and chemicals.

Growth in the personal care sector is being amplified by the inclusion of aloe vera in products such as gels, lotions, sunscreens, face masks, and herbal cleansers. This demand is reinforced by wellness-focused consumer behavior and regulatory encouragement for plant-based actives in North America, Europe, and select Asia-Pacific markets.

Aloe Vera Extracts Market

Furthermore, aloe vera’s usage has extended into the functional food and beverage sector, where it is incorporated into fortified drinks, dietary supplements, and even confectionery. In the food processing industry, aloe vera extract is valued not only for its health benefits but also for its role as a natural preservative and stabilizer. While the demand in food and beverages is rising, the segment still trails cosmetics due to higher formulation complexities and region-specific approvals.

From a supply-side perspective, global manufacturers continue to invest in high-purity extraction technologies and sustainable cultivation practices. Key players such as Lily of the Desert and Terry Laboratories have demonstrated leadership in vertical integration-from certified organic aloe cultivation to advanced extraction and product formulation. These strategies ensure quality traceability and competitive differentiation, especially important in B2B export markets.

Looking ahead, expansion in the market is expected to be further propelled by strategic collaborations between cosmetic brands and aloe extract processors, alongside innovations in encapsulation technologies that improve aloe’s bioavailability and stability. The entry of premium wellness brands is also projected to boost the value of high-grade, food- and cosmetic-compliant aloe vera extracts.

Semi-annual Demand Update

The below table presents a comparative assessment of the variation in CAGR over six months for the base year 2024 and current year 2025 for global aloe vera extracts industry. This analysis reveals crucial shifts in performance and indicates revenue realization patterns, thus providing stakeholders with a better vision about the growth trajectory over the year. The first half of the year, or H1, spans from January to June. The second half, H2, includes the months from July to December.

Particular Value CAGR
H1 15.4% (2024 to 2034)
H2 16.0% (2024 to 2034)
H1 16.3% (2025 to 2035)
H2 17.0% (2025 to 2035)

The above table presents the expected CAGR for the global aloe vera extracts space over semi-annual period spanning from 2025 to 2035. In the first half (H1) of the year 2024, the business is predicted to surge at a CAGR of 15.4%, followed by a slightly higher growth rate of 16.0% in the second half (H2) of the same year.

Moving into year 2025, the CAGR is projected to increase slightly to 16.3% in the first half and remain relatively moderate at 17.0% in the second half. In the first half (H1 2025) the industry witnessed a decrease of 16 BPS while in the second half (H2 2025), it witnessed an increase of 34 BPS.
Analyzing Aloe Vera Extracts Market by Top Investment Segments

Skincare Innovation to Sustain Long-Term Dominance of Aloe in Cosmetics

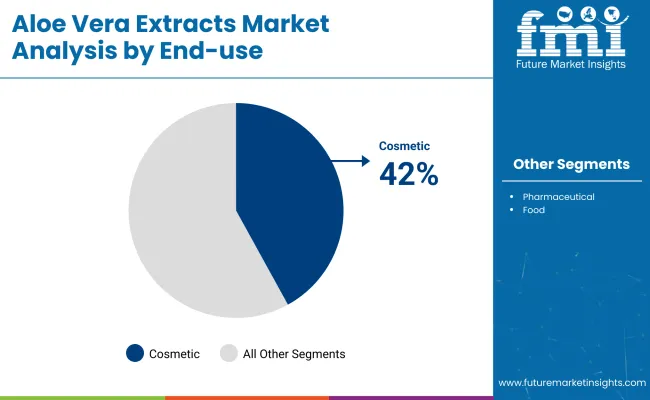
The cosmetics segment accounted for over 42% of the global aloe vera extracts market in 2025 and is expected to grow at a CAGR of 6.9% through 2035. This dominance is supported by the compound’s multifunctionality, clean-label positioning, and scientific validation in topical formulations.

Aloe vera extract has been increasingly positioned as a strategic natural ingredient within premium and mass-market skincare ranges, driven by consumer expectations for transparency, efficacy, and botanical integrity.

Its bioactive compounds, including polysaccharides, glycoproteins, and antioxidants, have been clinically associated with anti-inflammatory and skin-soothing benefits-making it especially attractive for acne-prone, sensitive, or aging skin categories. The growth of the cosmetics segment is further enabled by rising awareness of wellness-oriented routines and the declining consumer tolerance for synthetic additives.

Manufacturers are expected to deepen vertical integration efforts to ensure traceable sourcing and higher bioavailability of key aloe constituents. As dermocosmetic brands increasingly seek nature-derived actives backed by peer-reviewed data, aloe vera’s inclusion is expected to evolve from basic hydration claims to advanced skin barrier restoration and microbiome support functionalities.

The segment’s resilience will also be reinforced by regulatory frameworks encouraging plant-based actives and sustainability-linked innovation pipelines-factors that will continue to elevate aloe vera’s role in global cosmetic formulation strategies.

Bioactive Beverages to Elevate Aloe Extract Demand in Functional Drinks

The functional beverage segment is projected to register a CAGR of 7.3% from 2025 to 2035, gradually expanding its share within the aloe vera extracts market due to consumer interest in holistic hydration and digestive wellness.

Aloe vera extract’s soluble fiber content and bioactive composition position it favorably for use in fortified beverage formulations that target gut health, immunity, and internal detoxification. Beverage formulators have increasingly leveraged aloe’s perceived therapeutic profile as a natural botanical aligned with wellness-driven consumption trends. Its inclusion in low-calorie, plant-based, or digestive-enhancing beverages is expected to gain momentum across both retail and hospitality channels.

Challenges persist in formulation consistency, as aloe vera extract can exhibit instability and sedimentation in liquid matrices. Nevertheless, advancements in processing technologies-such as nanoencapsulation, cold stabilization, and aseptic packaging-are expected to overcome these hurdles, allowing aloe-based drinks to maintain freshness, palatability, and active compound integrity.

As global regulatory acceptance of aloe in consumable formats expands, functional beverage brands are anticipated to prioritize aloe extract in SKUs positioned around clean-label immunity, hydration, and daily detox. Strategic partnerships between aloe processors and beverage innovators will be instrumental in unlocking further market scalability across health-conscious and lifestyle-oriented consumer bases worldwide

Country-wise Insights

Countries Value (2035)
The USA USD 676.9 million
The UK USD 451.3 million
Germany USD 361.0 million
China USD 225.6 million
India USD 90.3 million

The USA

The USA Clean beauty trends, functional beverages, and wellness-driven nutraceuticals dominate the USA industry for botanical extracts. Organic skincare demand is growing as consumers seek chemical-free products in moisturizers, sunscreens, and anti-aging creams. Functional beverages with plant ingredients are gaining traction in gut health and immunity-promoting beverages.

Growth Drivers in the USA

Key Drivers Details
Rise in Clean Beauty Trends Rise in organic, chemical-free skincare.
Rise in Demand for Herbal Skincare Alternatives Demand for natural formulation.
Growth in Functional Beverages Emerging uses in gut well-being beverages.
FDA Regulations for Safe Ingredients Clean-label consumer personal care products bolstered by the formulas.
Nutraceutical Growth Immunostimulating food supplements in which herbal extracts are used.

The UK

The United Kingdom is experiencing rising consumer demand for organic, cruelty-free, and sustainable skincare solutions, making aloe vera extracts a high-demand ingredient in the beauty and personal care sector. British consumers are actively seeking eco-conscious and clean-label alternatives, leading to higher adoption of botanical and plant-based skincare products.

The functional beverage industry is expanding where vegetable health drinks and herbal detoxing drinks are increasingly popular.

Growth Drivers in the UK

Key Drivers Details
Sustainable Skincare Preference High demand for organic, animal-free beauty products.
Tough Cosmetic Regulations Compliance with CPR and UK REACH regulation.
Herbal Functional Beverages Growth Surging demand for digestive well-being and detox beverages.
Need for Plant-Based Alternatives Botanicals replacing the function of synthetic additives.
Expansion of Wellness & Sports Nutrition Usage in sports and fitness hydration beverages.

Germany

In Germany, the demand for aloe vera extracts is heavily influenced by the strong herbal pharmaceutical industry, functional food sector, and preference for organic skincare. Germany has a long-standing tradition of herbal medicine, with apothecaries and pharmaceutical companies integrating plant-based solutions into mainstream healthcare.

Aloe vera is widely used in dermatological treatments, wound care formulations, and digestive health supplements, making it a highly sought-after ingredient in pharmaceutical-grade herbal remedies. The functional beverage industry also uses botanical ingredients for probiotic beverages and herbal tea.

Growth Drivers in Germany

Key Drivers Details
Active Herbal Pharmaceutical Industry Industry for plant extract-based therapeutic formulations.
Organic Food & Beverages Growth Increased consumer demand for food and beverages free of GMOs and chemicals.
Functional Beverage & Supplement Development Emergence of probiotic drinks and digestive health supplements.
Natural Cosmetics Demand Use in anti-aging and dermatological treatments.
Clean-Label & Sustainability Shift Movement towards sustainable, natural ingredients.

China

China beta carotene industry is being fueled by its growing functional drink industry, heightened health awareness, and tough food safety regulations. During the post-pandemic period, immune system supplement consumption has grown significantly. It is also widely utilized in animal nutrition to enhance levels of nutrition.

Growth Drivers in China

Key Drivers Details
Growth in Functional Beverages Growth in consumption of gut health and detox drinks.
Emergence in Herbal Medicine Market TCM-based product extracts with plant extracts.
Natural Skincare Growth Demand for herbal anti-aging and sun-protecting creams.
Health-Conscious Urban Consumers Demand for natural remedies for immune system strength.
Strict Food & Cosmetic Regulation Need for plant-based, safe ingredients.

India

India's market for beta carotene is growing with its use in not only in Ayurveda, functional foods but also in dairy. Increased middle class and rising focus on preventive care have stimulated the use of supplements. Food processing industries are also adopting beta carotene as a natural coloring agent.

Growth Factors in India

Key Drivers Details
Ayurveda & Herbal Medicine Tradition Inclusion in digestive and skin care products.
Emerging Nutraceutical Industry Application in gut and immune supplements.
Increased Dairy & Functional Foods Application in fortified milk and herbal beverages.
Government Appeal For Natural Ingredients Boost for natural ingredient-based herbal preparations.
Higher Disposable Income Growing expenditure on high-end herbal products.

Key Company Insights

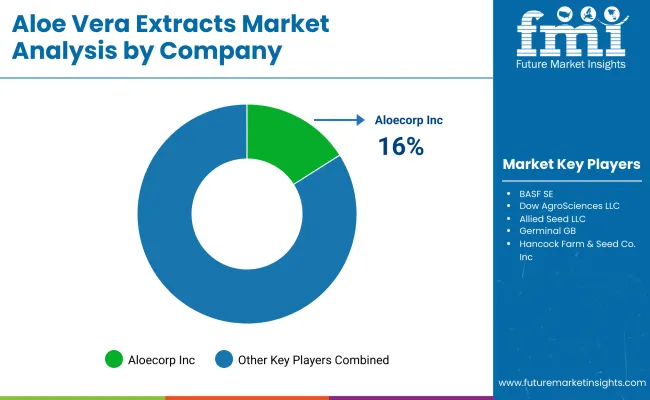
Aloecorp Inc. (16-20%)

Aloecorp is a global player for its raw materials in aloe vera, practicing sustainably as a culture as well as extracting advanced technologies for applications of high purity.

Forever Living Products (14-18%)

As one of the largest vertically integrated producers of aloe vera, it specializes in personal care and nutritional products through direct selling.

Herbalife Nutrition (10-14%)

The company is one of the top names in aloe-based dietary supplements and beverages, taking advantage of a strong global network distribution coverage with which they reach out to the wellness industry.

Terry Laboratories Inc. (8-12%)

Terry Laboratories specializes in premium-grade aloe vera extracts and supplies them to the food, cosmetic, and pharmaceutical sectors. Lily of the desert organic

Aloeceuticals (6-10%)

A pioneer in organic aloe vera products, Lily of the Desert emphasizes sustainability and enhanced bioavailability in its formulations.

Other Key Players (30-40% Combined)

  • Aloe Farms Inc.
  • Foodchem International Cooperation
  • Natural Aloe Costa Rica S.A.
  • Pharmachem Laboratories Inc.
  • Aloe Laboratories Inc.

Key Players

  • Aloecorp Inc.
  • Forever Living Products
  • Herbalife Nutrition
  • Terry Laboratories Inc.
  • Lily of the Desert Organic Aloeceuticals
  • Aloe Farms Inc.
  • Foodchem International Cooperation
  • Natural Aloe Costa Rica S.A.
  • Pharmachem Laboratories Inc.
  • Aloe Laboratories Inc.

Key Segmentation

By Product:

By product, the industry is segmented into aloe vera gel extracts, aloe vera whole leaf extracts, and others.

By Form:

By form, the market is categorized into gels, powders, capsules, drinks, and concentrates.

By End-use:

By end-use industry, the market is divided into pharmaceuticals, food, and cosmetics.

By Region:

By region, the market is segmented into North America, Latin America, Europe, Asia Pacific, and the Middle East & Africa.

Table of Content

  1. Executive Summary
  2. Industry Introduction, including Taxonomy and Market Definition
  3. Trends and Success Factors, including Macro-economic Factors, Market Dynamics, and Recent Industry Developments
  4. Global Market Demand Analysis 2020 to 2024 and Forecast 2025 to 2035, including Historical Analysis and Future Projections
  5. Pricing Analysis
  6. Global Market Analysis 2020 to 2024 and Forecast 2025 to 2035
    • By Product
    • By Form
    • By End Use Industry
  7. By Product
    • Aloe Vera Gel Extracts
    • Aloe Vera Whole Leaf Extracts
    • Others
  8. By Form
    • Gels
    • Powders
    • Capsules
    • Drinks
    • Concentrates
  9. By End Use Industry
    • Pharmaceutical
    • Food
    • Cosmetics
  10. By Region
    • North America
    • Latin America
    • Western Europe
    • Eastern Europe
    • East Asia
    • South Asia & Pacific
    • Central Asia
    • Russia and Belarus
    • Balkan & Baltic Countries
    • Middle East and Africa
  11. North America Sales Analysis 2020 to 2024 and Forecast 2025 to 2035, by Key Segments and Countries
  12. Latin America Sales Analysis 2020 to 2024 and Forecast 2025 to 2035, by Key Segments and Countries
  13. Western Europe Sales Analysis 2020 to 2024 and Forecast 2025 to 2035, by Key Segments and Countries
  14. Eastern Europe Sales Analysis 2020 to 2024 and Forecast 2025 to 2035, by Key Segments and Countries
  15. East Asia Sales Analysis 2020 to 2024 and Forecast 2025 to 2035, by Key Segments and Countries
  16. South Asia & Pacific Sales Analysis 2020 to 2024 and Forecast 2025 to 2035, by Key Segments and Countries
  17. Central Asia Sales Analysis 2020 to 2024 and Forecast 2025 to 2035, by Key Segments and Countries
  18. Russia and Belarus Sales Analysis 2020 to 2024 and Forecast 2025 to 2035, by Key Segments and Countries
  19. Balkan & Baltic Countries Sales Analysis 2020 to 2024 and Forecast 2025 to 2035, by Key Segments and Countries
  20. Middle East and Africa Sales Analysis 2020 to 2024 and Forecast 2025 to 2035, by Key Segments and Countries
  21. Sales Forecast to 2035 by Product, Form, and End Use Industry for 30 Countries
  22. Competitive Assessment, Company Share Analysis by Key Players, and Competition Dashboard
  23. Company Profile
    • Aloe Farms Inc.
    • Terry Laboratories Inc.
    • Foodchem International Cooperation
    • Natural Aloe Costa Rica S.A.
    • Pharmachem Laboratories Inc.
    • Aloecorp Inc.
    • Aloe Laboratories Inc.
    • India Aroma Oils and Company
    • S. International
    • AyurVikalp

List of Tables

Table 1: Global Market Value (US$ Million) Forecast by Region, 2018 to 2033

Table 2: Global Market Volume (Units) Forecast by Region, 2018 to 2033

Table 3: Global Market Value (US$ Million) Forecast by Product, 2018 to 2033

Table 4: Global Market Volume (Units) Forecast by Product, 2018 to 2033

Table 5: Global Market Value (US$ Million) Forecast by Form, 2018 to 2033

Table 6: Global Market Volume (Units) Forecast by Form, 2018 to 2033

Table 7: Global Market Value (US$ Million) Forecast by End Use Industry, 2018 to 2033

Table 8: Global Market Volume (Units) Forecast by End Use Industry, 2018 to 2033

Table 9: North America Market Value (US$ Million) Forecast by Country, 2018 to 2033

Table 10: North America Market Volume (Units) Forecast by Country, 2018 to 2033

Table 11: North America Market Value (US$ Million) Forecast by Product, 2018 to 2033

Table 12: North America Market Volume (Units) Forecast by Product, 2018 to 2033

Table 13: North America Market Value (US$ Million) Forecast by Form, 2018 to 2033

Table 14: North America Market Volume (Units) Forecast by Form, 2018 to 2033

Table 15: North America Market Value (US$ Million) Forecast by End Use Industry, 2018 to 2033

Table 16: North America Market Volume (Units) Forecast by End Use Industry, 2018 to 2033

Table 17: Latin America Market Value (US$ Million) Forecast by Country, 2018 to 2033

Table 18: Latin America Market Volume (Units) Forecast by Country, 2018 to 2033

Table 19: Latin America Market Value (US$ Million) Forecast by Product, 2018 to 2033

Table 20: Latin America Market Volume (Units) Forecast by Product, 2018 to 2033

Table 21: Latin America Market Value (US$ Million) Forecast by Form, 2018 to 2033

Table 22: Latin America Market Volume (Units) Forecast by Form, 2018 to 2033

Table 23: Latin America Market Value (US$ Million) Forecast by End Use Industry, 2018 to 2033

Table 24: Latin America Market Volume (Units) Forecast by End Use Industry, 2018 to 2033

Table 25: Western Europe Market Value (US$ Million) Forecast by Country, 2018 to 2033

Table 26: Western Europe Market Volume (Units) Forecast by Country, 2018 to 2033

Table 27: Western Europe Market Value (US$ Million) Forecast by Product, 2018 to 2033

Table 28: Western Europe Market Volume (Units) Forecast by Product, 2018 to 2033

Table 29: Western Europe Market Value (US$ Million) Forecast by Form, 2018 to 2033

Table 30: Western Europe Market Volume (Units) Forecast by Form, 2018 to 2033

Table 31: Western Europe Market Value (US$ Million) Forecast by End Use Industry, 2018 to 2033

Table 32: Western Europe Market Volume (Units) Forecast by End Use Industry, 2018 to 2033

Table 33: Eastern Europe Market Value (US$ Million) Forecast by Country, 2018 to 2033

Table 34: Eastern Europe Market Volume (Units) Forecast by Country, 2018 to 2033

Table 35: Eastern Europe Market Value (US$ Million) Forecast by Product, 2018 to 2033

Table 36: Eastern Europe Market Volume (Units) Forecast by Product, 2018 to 2033

Table 37: Eastern Europe Market Value (US$ Million) Forecast by Form, 2018 to 2033

Table 38: Eastern Europe Market Volume (Units) Forecast by Form, 2018 to 2033

Table 39: Eastern Europe Market Value (US$ Million) Forecast by End Use Industry, 2018 to 2033

Table 40: Eastern Europe Market Volume (Units) Forecast by End Use Industry, 2018 to 2033

Table 41: South Asia and Pacific Market Value (US$ Million) Forecast by Country, 2018 to 2033

Table 42: South Asia and Pacific Market Volume (Units) Forecast by Country, 2018 to 2033

Table 43: South Asia and Pacific Market Value (US$ Million) Forecast by Product, 2018 to 2033

Table 44: South Asia and Pacific Market Volume (Units) Forecast by Product, 2018 to 2033

Table 45: South Asia and Pacific Market Value (US$ Million) Forecast by Form, 2018 to 2033

Table 46: South Asia and Pacific Market Volume (Units) Forecast by Form, 2018 to 2033

Table 47: South Asia and Pacific Market Value (US$ Million) Forecast by End Use Industry, 2018 to 2033

Table 48: South Asia and Pacific Market Volume (Units) Forecast by End Use Industry, 2018 to 2033

Table 49: East Asia Market Value (US$ Million) Forecast by Country, 2018 to 2033

Table 50: East Asia Market Volume (Units) Forecast by Country, 2018 to 2033

Table 51: East Asia Market Value (US$ Million) Forecast by Product, 2018 to 2033

Table 52: East Asia Market Volume (Units) Forecast by Product, 2018 to 2033

Table 53: East Asia Market Value (US$ Million) Forecast by Form, 2018 to 2033

Table 54: East Asia Market Volume (Units) Forecast by Form, 2018 to 2033

Table 55: East Asia Market Value (US$ Million) Forecast by End Use Industry, 2018 to 2033

Table 56: East Asia Market Volume (Units) Forecast by End Use Industry, 2018 to 2033

Table 57: Middle East and Africa Market Value (US$ Million) Forecast by Country, 2018 to 2033

Table 58: Middle East and Africa Market Volume (Units) Forecast by Country, 2018 to 2033

Table 59: Middle East and Africa Market Value (US$ Million) Forecast by Product, 2018 to 2033

Table 60: Middle East and Africa Market Volume (Units) Forecast by Product, 2018 to 2033

Table 61: Middle East and Africa Market Value (US$ Million) Forecast by Form, 2018 to 2033

Table 62: Middle East and Africa Market Volume (Units) Forecast by Form, 2018 to 2033

Table 63: Middle East and Africa Market Value (US$ Million) Forecast by End Use Industry, 2018 to 2033

Table 64: Middle East and Africa Market Volume (Units) Forecast by End Use Industry, 2018 to 2033

List of Figures

Figure 1: Global Market Value (US$ Million) by Product, 2023 to 2033

Figure 2: Global Market Value (US$ Million) by Form, 2023 to 2033

Figure 3: Global Market Value (US$ Million) by End Use Industry, 2023 to 2033

Figure 4: Global Market Value (US$ Million) by Region, 2023 to 2033

Figure 5: Global Market Value (US$ Million) Analysis by Region, 2018 to 2033

Figure 6: Global Market Volume (Units) Analysis by Region, 2018 to 2033

Figure 7: Global Market Value Share (%) and BPS Analysis by Region, 2023 to 2033

Figure 8: Global Market Y-o-Y Growth (%) Projections by Region, 2023 to 2033

Figure 9: Global Market Value (US$ Million) Analysis by Product, 2018 to 2033

Figure 10: Global Market Volume (Units) Analysis by Product, 2018 to 2033

Figure 11: Global Market Value Share (%) and BPS Analysis by Product, 2023 to 2033

Figure 12: Global Market Y-o-Y Growth (%) Projections by Product, 2023 to 2033

Figure 13: Global Market Value (US$ Million) Analysis by Form, 2018 to 2033

Figure 14: Global Market Volume (Units) Analysis by Form, 2018 to 2033

Figure 15: Global Market Value Share (%) and BPS Analysis by Form, 2023 to 2033

Figure 16: Global Market Y-o-Y Growth (%) Projections by Form, 2023 to 2033

Figure 17: Global Market Value (US$ Million) Analysis by End Use Industry, 2018 to 2033

Figure 18: Global Market Volume (Units) Analysis by End Use Industry, 2018 to 2033

Figure 19: Global Market Value Share (%) and BPS Analysis by End Use Industry, 2023 to 2033

Figure 20: Global Market Y-o-Y Growth (%) Projections by End Use Industry, 2023 to 2033

Figure 21: Global Market Attractiveness by Product, 2023 to 2033

Figure 22: Global Market Attractiveness by Form, 2023 to 2033

Figure 23: Global Market Attractiveness by End Use Industry, 2023 to 2033

Figure 24: Global Market Attractiveness by Region, 2023 to 2033

Figure 25: North America Market Value (US$ Million) by Product, 2023 to 2033

Figure 26: North America Market Value (US$ Million) by Form, 2023 to 2033

Figure 27: North America Market Value (US$ Million) by End Use Industry, 2023 to 2033

Figure 28: North America Market Value (US$ Million) by Country, 2023 to 2033

Figure 29: North America Market Value (US$ Million) Analysis by Country, 2018 to 2033

Figure 30: North America Market Volume (Units) Analysis by Country, 2018 to 2033

Figure 31: North America Market Value Share (%) and BPS Analysis by Country, 2023 to 2033

Figure 32: North America Market Y-o-Y Growth (%) Projections by Country, 2023 to 2033

Figure 33: North America Market Value (US$ Million) Analysis by Product, 2018 to 2033

Figure 34: North America Market Volume (Units) Analysis by Product, 2018 to 2033

Figure 35: North America Market Value Share (%) and BPS Analysis by Product, 2023 to 2033

Figure 36: North America Market Y-o-Y Growth (%) Projections by Product, 2023 to 2033

Figure 37: North America Market Value (US$ Million) Analysis by Form, 2018 to 2033

Figure 38: North America Market Volume (Units) Analysis by Form, 2018 to 2033

Figure 39: North America Market Value Share (%) and BPS Analysis by Form, 2023 to 2033

Figure 40: North America Market Y-o-Y Growth (%) Projections by Form, 2023 to 2033

Figure 41: North America Market Value (US$ Million) Analysis by End Use Industry, 2018 to 2033

Figure 42: North America Market Volume (Units) Analysis by End Use Industry, 2018 to 2033

Figure 43: North America Market Value Share (%) and BPS Analysis by End Use Industry, 2023 to 2033

Figure 44: North America Market Y-o-Y Growth (%) Projections by End Use Industry, 2023 to 2033

Figure 45: North America Market Attractiveness by Product, 2023 to 2033

Figure 46: North America Market Attractiveness by Form, 2023 to 2033

Figure 47: North America Market Attractiveness by End Use Industry, 2023 to 2033

Figure 48: North America Market Attractiveness by Country, 2023 to 2033

Figure 49: Latin America Market Value (US$ Million) by Product, 2023 to 2033

Figure 50: Latin America Market Value (US$ Million) by Form, 2023 to 2033

Figure 51: Latin America Market Value (US$ Million) by End Use Industry, 2023 to 2033

Figure 52: Latin America Market Value (US$ Million) by Country, 2023 to 2033

Figure 53: Latin America Market Value (US$ Million) Analysis by Country, 2018 to 2033

Figure 54: Latin America Market Volume (Units) Analysis by Country, 2018 to 2033

Figure 55: Latin America Market Value Share (%) and BPS Analysis by Country, 2023 to 2033

Figure 56: Latin America Market Y-o-Y Growth (%) Projections by Country, 2023 to 2033

Figure 57: Latin America Market Value (US$ Million) Analysis by Product, 2018 to 2033

Figure 58: Latin America Market Volume (Units) Analysis by Product, 2018 to 2033

Figure 59: Latin America Market Value Share (%) and BPS Analysis by Product, 2023 to 2033

Figure 60: Latin America Market Y-o-Y Growth (%) Projections by Product, 2023 to 2033

Figure 61: Latin America Market Value (US$ Million) Analysis by Form, 2018 to 2033

Figure 62: Latin America Market Volume (Units) Analysis by Form, 2018 to 2033

Figure 63: Latin America Market Value Share (%) and BPS Analysis by Form, 2023 to 2033

Figure 64: Latin America Market Y-o-Y Growth (%) Projections by Form, 2023 to 2033

Figure 65: Latin America Market Value (US$ Million) Analysis by End Use Industry, 2018 to 2033

Figure 66: Latin America Market Volume (Units) Analysis by End Use Industry, 2018 to 2033

Figure 67: Latin America Market Value Share (%) and BPS Analysis by End Use Industry, 2023 to 2033

Figure 68: Latin America Market Y-o-Y Growth (%) Projections by End Use Industry, 2023 to 2033

Figure 69: Latin America Market Attractiveness by Product, 2023 to 2033

Figure 70: Latin America Market Attractiveness by Form, 2023 to 2033

Figure 71: Latin America Market Attractiveness by End Use Industry, 2023 to 2033

Figure 72: Latin America Market Attractiveness by Country, 2023 to 2033

Figure 73: Western Europe Market Value (US$ Million) by Product, 2023 to 2033

Figure 74: Western Europe Market Value (US$ Million) by Form, 2023 to 2033

Figure 75: Western Europe Market Value (US$ Million) by End Use Industry, 2023 to 2033

Figure 76: Western Europe Market Value (US$ Million) by Country, 2023 to 2033

Figure 77: Western Europe Market Value (US$ Million) Analysis by Country, 2018 to 2033

Figure 78: Western Europe Market Volume (Units) Analysis by Country, 2018 to 2033

Figure 79: Western Europe Market Value Share (%) and BPS Analysis by Country, 2023 to 2033

Figure 80: Western Europe Market Y-o-Y Growth (%) Projections by Country, 2023 to 2033

Figure 81: Western Europe Market Value (US$ Million) Analysis by Product, 2018 to 2033

Figure 82: Western Europe Market Volume (Units) Analysis by Product, 2018 to 2033

Figure 83: Western Europe Market Value Share (%) and BPS Analysis by Product, 2023 to 2033

Figure 84: Western Europe Market Y-o-Y Growth (%) Projections by Product, 2023 to 2033

Figure 85: Western Europe Market Value (US$ Million) Analysis by Form, 2018 to 2033

Figure 86: Western Europe Market Volume (Units) Analysis by Form, 2018 to 2033

Figure 87: Western Europe Market Value Share (%) and BPS Analysis by Form, 2023 to 2033

Figure 88: Western Europe Market Y-o-Y Growth (%) Projections by Form, 2023 to 2033

Figure 89: Western Europe Market Value (US$ Million) Analysis by End Use Industry, 2018 to 2033

Figure 90: Western Europe Market Volume (Units) Analysis by End Use Industry, 2018 to 2033

Figure 91: Western Europe Market Value Share (%) and BPS Analysis by End Use Industry, 2023 to 2033

Figure 92: Western Europe Market Y-o-Y Growth (%) Projections by End Use Industry, 2023 to 2033

Figure 93: Western Europe Market Attractiveness by Product, 2023 to 2033

Figure 94: Western Europe Market Attractiveness by Form, 2023 to 2033

Figure 95: Western Europe Market Attractiveness by End Use Industry, 2023 to 2033

Figure 96: Western Europe Market Attractiveness by Country, 2023 to 2033

Figure 97: Eastern Europe Market Value (US$ Million) by Product, 2023 to 2033

Figure 98: Eastern Europe Market Value (US$ Million) by Form, 2023 to 2033

Figure 99: Eastern Europe Market Value (US$ Million) by End Use Industry, 2023 to 2033

Figure 100: Eastern Europe Market Value (US$ Million) by Country, 2023 to 2033

Figure 101: Eastern Europe Market Value (US$ Million) Analysis by Country, 2018 to 2033

Figure 102: Eastern Europe Market Volume (Units) Analysis by Country, 2018 to 2033

Figure 103: Eastern Europe Market Value Share (%) and BPS Analysis by Country, 2023 to 2033

Figure 104: Eastern Europe Market Y-o-Y Growth (%) Projections by Country, 2023 to 2033

Figure 105: Eastern Europe Market Value (US$ Million) Analysis by Product, 2018 to 2033

Figure 106: Eastern Europe Market Volume (Units) Analysis by Product, 2018 to 2033

Figure 107: Eastern Europe Market Value Share (%) and BPS Analysis by Product, 2023 to 2033

Figure 108: Eastern Europe Market Y-o-Y Growth (%) Projections by Product, 2023 to 2033

Figure 109: Eastern Europe Market Value (US$ Million) Analysis by Form, 2018 to 2033

Figure 110: Eastern Europe Market Volume (Units) Analysis by Form, 2018 to 2033

Figure 111: Eastern Europe Market Value Share (%) and BPS Analysis by Form, 2023 to 2033

Figure 112: Eastern Europe Market Y-o-Y Growth (%) Projections by Form, 2023 to 2033

Figure 113: Eastern Europe Market Value (US$ Million) Analysis by End Use Industry, 2018 to 2033

Figure 114: Eastern Europe Market Volume (Units) Analysis by End Use Industry, 2018 to 2033

Figure 115: Eastern Europe Market Value Share (%) and BPS Analysis by End Use Industry, 2023 to 2033

Figure 116: Eastern Europe Market Y-o-Y Growth (%) Projections by End Use Industry, 2023 to 2033

Figure 117: Eastern Europe Market Attractiveness by Product, 2023 to 2033

Figure 118: Eastern Europe Market Attractiveness by Form, 2023 to 2033

Figure 119: Eastern Europe Market Attractiveness by End Use Industry, 2023 to 2033

Figure 120: Eastern Europe Market Attractiveness by Country, 2023 to 2033

Figure 121: South Asia and Pacific Market Value (US$ Million) by Product, 2023 to 2033

Figure 122: South Asia and Pacific Market Value (US$ Million) by Form, 2023 to 2033

Figure 123: South Asia and Pacific Market Value (US$ Million) by End Use Industry, 2023 to 2033

Figure 124: South Asia and Pacific Market Value (US$ Million) by Country, 2023 to 2033

Figure 125: South Asia and Pacific Market Value (US$ Million) Analysis by Country, 2018 to 2033

Figure 126: South Asia and Pacific Market Volume (Units) Analysis by Country, 2018 to 2033

Figure 127: South Asia and Pacific Market Value Share (%) and BPS Analysis by Country, 2023 to 2033

Figure 128: South Asia and Pacific Market Y-o-Y Growth (%) Projections by Country, 2023 to 2033

Figure 129: South Asia and Pacific Market Value (US$ Million) Analysis by Product, 2018 to 2033

Figure 130: South Asia and Pacific Market Volume (Units) Analysis by Product, 2018 to 2033

Figure 131: South Asia and Pacific Market Value Share (%) and BPS Analysis by Product, 2023 to 2033

Figure 132: South Asia and Pacific Market Y-o-Y Growth (%) Projections by Product, 2023 to 2033

Figure 133: South Asia and Pacific Market Value (US$ Million) Analysis by Form, 2018 to 2033

Figure 134: South Asia and Pacific Market Volume (Units) Analysis by Form, 2018 to 2033

Figure 135: South Asia and Pacific Market Value Share (%) and BPS Analysis by Form, 2023 to 2033

Figure 136: South Asia and Pacific Market Y-o-Y Growth (%) Projections by Form, 2023 to 2033

Figure 137: South Asia and Pacific Market Value (US$ Million) Analysis by End Use Industry, 2018 to 2033

Figure 138: South Asia and Pacific Market Volume (Units) Analysis by End Use Industry, 2018 to 2033

Figure 139: South Asia and Pacific Market Value Share (%) and BPS Analysis by End Use Industry, 2023 to 2033

Figure 140: South Asia and Pacific Market Y-o-Y Growth (%) Projections by End Use Industry, 2023 to 2033

Figure 141: South Asia and Pacific Market Attractiveness by Product, 2023 to 2033

Figure 142: South Asia and Pacific Market Attractiveness by Form, 2023 to 2033

Figure 143: South Asia and Pacific Market Attractiveness by End Use Industry, 2023 to 2033

Figure 144: South Asia and Pacific Market Attractiveness by Country, 2023 to 2033

Figure 145: East Asia Market Value (US$ Million) by Product, 2023 to 2033

Figure 146: East Asia Market Value (US$ Million) by Form, 2023 to 2033

Figure 147: East Asia Market Value (US$ Million) by End Use Industry, 2023 to 2033

Figure 148: East Asia Market Value (US$ Million) by Country, 2023 to 2033

Figure 149: East Asia Market Value (US$ Million) Analysis by Country, 2018 to 2033

Figure 150: East Asia Market Volume (Units) Analysis by Country, 2018 to 2033

Figure 151: East Asia Market Value Share (%) and BPS Analysis by Country, 2023 to 2033

Figure 152: East Asia Market Y-o-Y Growth (%) Projections by Country, 2023 to 2033

Figure 153: East Asia Market Value (US$ Million) Analysis by Product, 2018 to 2033

Figure 154: East Asia Market Volume (Units) Analysis by Product, 2018 to 2033

Figure 155: East Asia Market Value Share (%) and BPS Analysis by Product, 2023 to 2033

Figure 156: East Asia Market Y-o-Y Growth (%) Projections by Product, 2023 to 2033

Figure 157: East Asia Market Value (US$ Million) Analysis by Form, 2018 to 2033

Figure 158: East Asia Market Volume (Units) Analysis by Form, 2018 to 2033

Figure 159: East Asia Market Value Share (%) and BPS Analysis by Form, 2023 to 2033

Figure 160: East Asia Market Y-o-Y Growth (%) Projections by Form, 2023 to 2033

Figure 161: East Asia Market Value (US$ Million) Analysis by End Use Industry, 2018 to 2033

Figure 162: East Asia Market Volume (Units) Analysis by End Use Industry, 2018 to 2033

Figure 163: East Asia Market Value Share (%) and BPS Analysis by End Use Industry, 2023 to 2033

Figure 164: East Asia Market Y-o-Y Growth (%) Projections by End Use Industry, 2023 to 2033

Figure 165: East Asia Market Attractiveness by Product, 2023 to 2033

Figure 166: East Asia Market Attractiveness by Form, 2023 to 2033

Figure 167: East Asia Market Attractiveness by End Use Industry, 2023 to 2033

Figure 168: East Asia Market Attractiveness by Country, 2023 to 2033

Figure 169: Middle East and Africa Market Value (US$ Million) by Product, 2023 to 2033

Figure 170: Middle East and Africa Market Value (US$ Million) by Form, 2023 to 2033

Figure 171: Middle East and Africa Market Value (US$ Million) by End Use Industry, 2023 to 2033

Figure 172: Middle East and Africa Market Value (US$ Million) by Country, 2023 to 2033

Figure 173: Middle East and Africa Market Value (US$ Million) Analysis by Country, 2018 to 2033

Figure 174: Middle East and Africa Market Volume (Units) Analysis by Country, 2018 to 2033

Figure 175: Middle East and Africa Market Value Share (%) and BPS Analysis by Country, 2023 to 2033

Figure 176: Middle East and Africa Market Y-o-Y Growth (%) Projections by Country, 2023 to 2033

Figure 177: Middle East and Africa Market Value (US$ Million) Analysis by Product, 2018 to 2033

Figure 178: Middle East and Africa Market Volume (Units) Analysis by Product, 2018 to 2033

Figure 179: Middle East and Africa Market Value Share (%) and BPS Analysis by Product, 2023 to 2033

Figure 180: Middle East and Africa Market Y-o-Y Growth (%) Projections by Product, 2023 to 2033

Figure 181: Middle East and Africa Market Value (US$ Million) Analysis by Form, 2018 to 2033

Figure 182: Middle East and Africa Market Volume (Units) Analysis by Form, 2018 to 2033

Figure 183: Middle East and Africa Market Value Share (%) and BPS Analysis by Form, 2023 to 2033

Figure 184: Middle East and Africa Market Y-o-Y Growth (%) Projections by Form, 2023 to 2033

Figure 185: Middle East and Africa Market Value (US$ Million) Analysis by End Use Industry, 2018 to 2033

Figure 186: Middle East and Africa Market Volume (Units) Analysis by End Use Industry, 2018 to 2033

Figure 187: Middle East and Africa Market Value Share (%) and BPS Analysis by End Use Industry, 2023 to 2033

Figure 188: Middle East and Africa Market Y-o-Y Growth (%) Projections by End Use Industry, 2023 to 2033

Figure 189: Middle East and Africa Market Attractiveness by Product, 2023 to 2033

Figure 190: Middle East and Africa Market Attractiveness by Form, 2023 to 2033

Figure 191: Middle East and Africa Market Attractiveness by End Use Industry, 2023 to 2033

Figure 192: Middle East and Africa Market Attractiveness by Country, 2023 to 2033

Frequently Asked Questions

What is the estimated value of the aloe vera extracts industry for 2025?

The market is estimated at a value of USD 3.97 billion in 2025.

What is the anticipated value of the aloe vera extracts industry by 2035?

The anticipated value of the market by 2035 is USD 8.29 billion.

At what rate will the revenue stream for aloe vera extracts grow between 2025 and 2035?

The sales of the market are expected to increase at a CAGR of 6.5% between 2025 and 2035.

Who are the leading manufacturers of aloe vera extracts?

Forever Living Products, Aloe Farms Inc., Herbalife Nutrition Ltd., Lily of the Desert Organic Aloeceuticals, and Aloecorp Inc. are some of the leading manufacturers in this industry.

Which region will garner a significant value share by 2035?

The Asia-Pacific region is projected to hold a revenue share of 29% over the forecast period, driven by high consumer demand for herbal skincare, functional beverages, and dietary supplements.

Explore Similar Insights

Future Market Insights

Aloe Vera Extracts Market