Fermented Extracts Market Size and Share Forecast Outlook 2025 to 2035

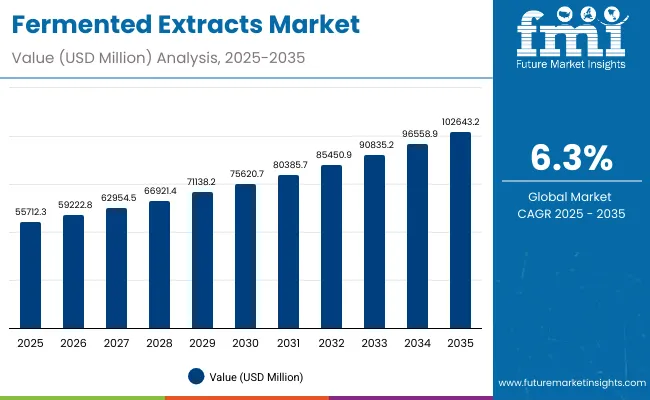
The Fermented Extracts Market is expected to record a valuation of USD 55,712.3 million in 2025 and USD 102,643.2 million in 2035, with an increase of USD 46,930.9 million, which equals a growth of 193% over the decade. The overall expansion represents a CAGR of 6.3% and a 2X increase in market size.
Quick Stats for Fermented Extracts Market

  • Fermented Extracts Market Value (2025): USD 55,712.3 million
  • Fermented Extracts Market Forecast Value (2035): USD 102,643.2 million
  • Fermented Extracts Market Forecast CAGR: 6.3%
  • Leading Segment in Fermented Extracts Market in 2025: Food & Beverage (38.5%)
  • Key Growth Regions in the Fermented Extracts Market: Asia-Pacific, Europe, North America
  • Top Key Players in Fermented Extracts Market: DuPont, Kerry Group, Cargill Incorporated, BASF SE, Chr. Hansen, Lonza Group, Ajinomoto Corporation, Associated British Foods PLC, Dohler Group SE, Evonik Industries AG, Lallemand Inc., Kyowa Hakko Kirin Co. Ltd, Lesaffre, Corbion N.V., Arjuna Natural Extracts Ltd.

Fermented Extracts Market

Fermented Extracts Market Key Takeaways

Metric Value
Market Estimated Value in (2025E) 55,712.3 million
Market Forecast Value in (2035F) USD 102,643.2 million
Forecast CAGR (2025 to 2035) 6.3%

During the first five-year period from 2025 to 2030, the market increases from USD 55,712.3 million to USD 75,620.7 million, adding USD 19,908.4 million, which accounts for 42.4% of the total decade growth. This phase records steady adoption in functional beverages, dairy alternatives, and nutraceutical formulations, driven by the need for bioactive and natural extracts. Food & Beverage end-use dominates this period as it caters to over 38.5% of global applications requiring functional health and flavor benefits.

The second half from 2030 to 2035 contributes USD 27,022.5 million, equal to 57.6% of total growth, as the market jumps from USD 75,620.7 million to USD 102,643.2 million. This acceleration is powered by widespread deployment of fermented botanicals, postbiotic complexes, and cosmetics-grade ferments. Nutraceuticals, dietary supplements, and pharmaceutical-adjacent categories expand rapidly, while encapsulated and powder-based forms capture a larger share above 43.8% by the end of the decade. Direct-to-manufacturer channels and ingredient distributors add recurring revenue, increasing the distribution-driven share beyond 60% in total value.

From 2020 to 2024, the Global Fermented Extracts Market grew from USD 41,700 million to USD 55,712.3 million, driven by food & beverage-centric adoption. During this period, the competitive landscape was dominated by ingredient manufacturers controlling nearly 70% of revenue, with leaders such as DuPont, Kerry Group, and Chr. Hansen focusing on plant-based and microbial fermentation for functional foods and nutraceuticals. Competitive differentiation relied on bioavailability, purity, and regulatory compliance, while cosmetics and pharmaceuticals were emerging but secondary contributors. Distribution-led and service-based models had minimal traction, contributing less than 15% of the total market value.

Demand for fermented extracts will expand to USD 55,712.3 million in 2025, and the revenue mix will shift as nutraceuticals, cosmetics, and pharmaceuticals grow to over 35% share. Traditional food ingredient leaders face rising competition from biotechnology-driven players offering postbiotic actives, microencapsulated delivery systems, and subscription-based supply models. Major ingredient vendors are pivoting to hybrid models, integrating sustainability credentials, clean-label certifications, and personalized nutrition solutions to retain relevance. Emerging entrants specializing in marine and algal ferments, AR/VR-backed consumer engagement in cosmetics, and industry-specific delivery platforms are gaining share. The competitive advantage is moving away from ingredient purity alone to ecosystem integration, scalability, and recurring supply agreements.

Why the Fermented Extracts Market is growing?

Advances in fermentation technology have improved yields, purity, and bioactive compound stability, allowing for more efficient extract applications across diverse industries. Plant-based and microbial-derived ferments have gained popularity due to their suitability for natural health benefits, clean-label food formulations, and eco-friendly cosmetics. The rise of powders and encapsulated formats has contributed to enhanced shelf stability and targeted release capabilities. Industries such as food & beverage, nutraceuticals, and cosmetics are driving demand for fermented extracts that can integrate seamlessly into existing workflows. Expansion of dietary supplements, functional beverages, and postbiotic applications has fueled market growth. Innovations in encapsulation, oil-dispersible grades, and mixed microbial consortia are expected to open new application areas. Segment growth is expected to be led by food & beverage components, plant-based sources, and powder forms due to their precision, adaptability, and consumer acceptance.

Segmental Analysis

The market is segmented by end-use industry, source, extract form, and distribution channel. End-use industries include food & beverage (functional beverages, dairy & alt-dairy bases, bakery & cereal ingredients, sauces, seasonings, umami extracts, meat & alternative protein processing aids), nutraceuticals & dietary supplements, cosmetics & personal care (skin, hair, hygiene), pharmaceutical & biopharma-adjacent (wound care, oral care), agriculture & horticulture (plant bio stimulants, soil & root zone postbiotics), animal nutrition & pet care (gut health, palatants, feed efficiency), and home care & fabric care (odor control, enzyme boosters). Sources include plant-based, fungal-based, bacterial-based, algal/marine-based, and mixed microbial consortia. Extract forms cover liquid concentrates, powders, pastes/slurries, encapsulated/microencapsulated, and oil- or water-dispersible grades. Distribution channels span direct-to-manufacturer supply, ingredient distributors, and private label/OEM ingredient supply.
Insights into the End-Use Industry Segment with Food & Beverage Leading in Market Share

Fermented Extracts Market By End Use

End-Use Industry Segment Market Value Share, 2025
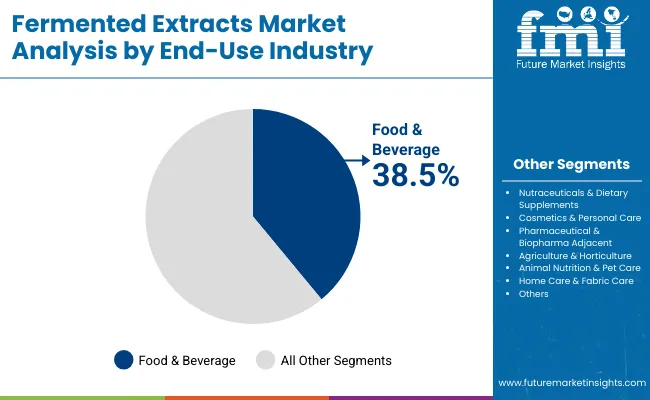
Food & Beverage 38.5%
Others 61.5%

The Food & Beverage segment is projected to contribute 38.5% of the Global Fermented Extracts Market revenue in 2025, maintaining its lead as the dominant end-use category. This is driven by ongoing demand for functional beverages, dairy and alt-dairy bases, bakery ingredients, and flavor-enhancing fermented extracts. Consumers are increasingly seeking natural, bioactive ingredients that support gut health, immunity, and clean-label nutrition. The segment’s growth is also supported by the integration of fermented proteins and postbiotics into alternative protein products and sports nutrition. As functional food formulations expand globally, manufacturers are prioritizing fermented extracts for their health benefits and flavor-enhancement properties. The Food & Beverage segment is expected to retain its position as the backbone of demand for fermented extracts.
Insights into the Source Segment with Plant-Based Leading in Market Share

Fermented Extracts Market By Source

Source Segment Market Value Share, 2025
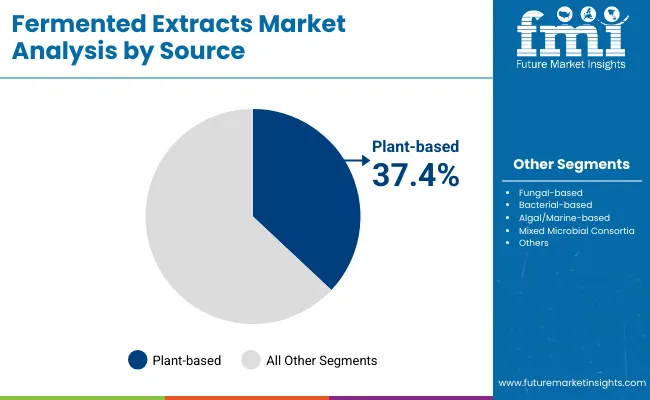
Plant-Based 37.4%
Others 62.6%

The Plant-based segment is projected to contribute 37.4% of the Global Fermented Extracts Market revenue in 2025, making it the leading source category. This growth is driven by the global shift toward sustainability, vegan lifestyles, and the demand for clean-label plant-derived bio-actives. Plant-based ferments are increasingly used in functional beverages, nutraceuticals, and cosmetics due to their natural health appeal and consumer-friendly positioning. The segment’s expansion is further supported by innovation in algal and botanical substrates, which provide unique phytonutrients and antioxidants. As consumer awareness of plant-based wellness rises, ingredient manufacturers are diversifying portfolios with fermented botanicals, seeds, and plant proteins. The Plant-based segment is expected to continue as the core growth driver in the source category.
Insights into the Extract Form Segment with Powders Leading in Market Share

Fermented Extracts Market By Extract

Extract Form Segment Market Value Share, 2025
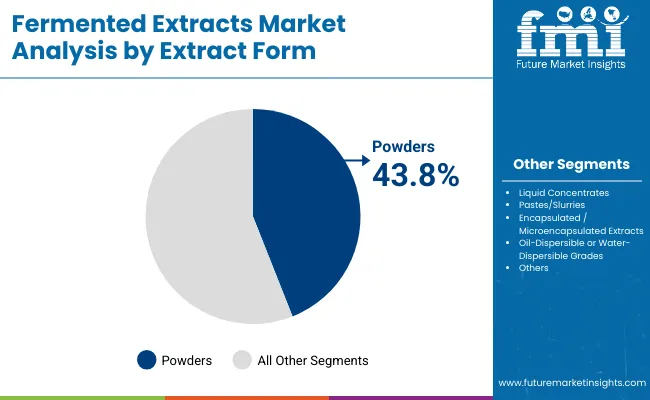
Powder 43.8%
Others 56.2%

The Powder segment is projected to contribute 43.8% of the Global Fermented Extracts Market revenue in 2025, securing its position as the dominant extract form. This leadership is driven by the widespread use of powdered fermented extracts in food formulations, nutraceuticals, and dietary supplements, where stability, dosing precision, and extended shelf life are key. The segment’s growth is also supported by increasing demand for encapsulated and microencapsulated powder formats that enable controlled release and improved bioavailability. As functional foods, sports nutrition, and pharmaceutical-adjacent applications expand, powders are emerging as the most versatile format. The Powder segment is expected to remain the preferred form for both manufacturers and end users due to its adaptability and cost-effectiveness.

What are the Drivers, Restraints, and Key Trends of the Global Fermented Extracts Market?

Drivers

Rising Demand for Functional Foods & Nutraceuticals

One of the strongest growth drivers for the global fermented extracts market is the rising consumer demand for functional foods, beverages, and nutraceuticals. The pandemic has permanently shifted consumer preferences toward preventive healthcare, leading to increased use of bioactive ingredients that support immunity, gut health, and metabolic balance. Fermented extracts, particularly postbiotic complexes, fermented botanicals, and bioavailable minerals, are increasingly being recognized as critical components of dietary supplements and functional beverages.

For example, fermented proteins and amino acids are being integrated into sports nutrition, while dairy and alternative-dairy bases fortified with fermented extracts are addressing lactose intolerance and plant-based nutrition demands. The USA and Europe are leading in terms of consumer adoption, but Asia-Pacifice specially India and China are the fastest-growing regions due to rising middle-class incomes, greater consumer awareness, and government initiatives promoting nutrition-rich diets.

The nutraceuticals and dietary supplements industry, which is expanding at double-digit rates in Asia, is directly fueling the uptake of fermented extracts. Manufacturers are investing heavily in marketing strategies that link fermented ingredients to specific health benefits such as immune defense, digestive wellness, and energy enhancement, which resonates strongly with millennial and Gen Z consumers. As food and beverage players continue to reformulate products around “clean-label” and “functional” trends, fermented extracts are becoming the backbone of innovation pipelines, cementing their role as a major demand driver.

Shift Toward Plant-Based & Sustainable Ingredients

The second major driver is the rapid shift toward plant-based and sustainable ingredient sourcing. In 2025, plant-based extracts already account for 37.4% of global market revenue, and this share is projected to grow as consumer lifestyles evolve. The “green wave” in global consumption is not limited to food and beverages but extends to personal care, pharmaceuticals, and animal nutrition. Plant-based ferments derived from botanicals, seeds, herbs, and marine algae are being prioritized because they align with consumer values of sustainability, natural origin, and reduced ecological impact.

Veganism and flexitarian diets are further pushing food companies to incorporate fermented plant proteins into alternative meats, dairy substitutes, and high-protein bakery items. Beyond food, personal care brands are launching fermented filtrates from rice, soy, and green tea to deliver skin-enhancing antioxidants and microbiome-friendly actives. In agriculture, fermented plant-based biostimulants and postbiotics are replacing synthetic chemicals, helping to meet regulatory mandates for reduced pesticide use.

This shift is reinforced by investors, who are increasingly channeling funds toward biotech players specializing in plant and algal fermentations. With regulatory approvals for plant-based claims easier to secure compared to bacterial or fungal ferments, companies are leveraging this pathway for faster commercialization. Overall, the sustainability narrative and consumer willingness to pay a premium for plant-based products are ensuring strong momentum for this driver.

Restraints

High Production Costs and Yield Variability

Despite its promising outlook, the fermented extracts market faces a significant restraint in terms of production costs and yield management. Fermentation processes require controlled bioreactors, specialized microbial strains, and precise monitoring of temperature, pH, and nutrient levels. These conditions are expensive to maintain, especially when scaling up from laboratory batches to commercial production. Variability in yield between batches is another challenge, with minor changes in fermentation conditions leading to fluctuations in product quality and potency.

This is particularly problematic in nutraceutical and pharmaceutical applications, where consistency is critical for regulatory compliance and consumer trust. Smaller companies and startups face significant barriers to entry due to the high capital investment needed for production facilities. Additionally, sourcing high-quality raw substrates for plant and microbial fermentation adds to costs, particularly for companies operating in regions with limited access to bio-feedstocks. While technological advances such as continuous fermentation and AI-driven process optimization are gradually reducing these costs, they remain a key obstacle limiting broader adoption across price-sensitive markets.

Regulatory and Labeling Complexities

The second restraint comes from regulatory and labeling challenges across different markets. Fermented extracts, especially postbiotics, microbial consortia, and pharmaceutical-adjacent ferments, fall into regulatory gray areas where definitions and guidelines are still evolving. For example, while probiotics and prebiotics have well-defined regulatory categories, postbiotics and bioactive fermented botanicals are often treated inconsistently across countries. The European Food Safety Authority (EFSA) requires rigorous scientific evidence for health claims, while the USA Food and Drug Administration (FDA) places fermented extracts under dietary supplement rules with less standardized frameworks.

In Asia, approvals differ by country, with China having one of the most complex registration systems. This inconsistency in regulation increases time-to-market and costs for global manufacturers, who must adapt formulations, labeling, and claims for each region. Moreover, consumer confusion around terms like probiotics, postbiotics, and fermented actives can reduce trust and slow adoption. Companies must invest heavily in compliance, education, and clinical research to navigate these challenges, which restricts smaller firms and adds to industry consolidation.

Key Trends

Growth of Postbiotics & Next-Generation Ferments

One of the most notable trends shaping the market is the rise of postbiotics and next-generation ferments. While probiotics once dominated the microbiome conversation, postbiotics non-living microbial components that provide health benefits are gaining strong traction due to their stability, safety, and wide applicability. Postbiotic complexes are now entering dietary supplements, skincare formulations, and even agriculture, where they enhance plant resilience.

Fermented botanicals such as rice filtrates, green tea ferments, and adaptogen-based extracts are finding space in the cosmetics sector, targeting skin hydration, barrier repair, and anti-aging benefits. Sports nutrition is adopting amino acid and peptide ferments to improve recovery and endurance, while pharmaceutical players are integrating fermented actives into wound care and oral health. As next-generation ferments expand their applications beyond traditional food and beverage, they are redefining market opportunities and driving premiumization.

Expansion of Powdered & Encapsulated Formats

Another significant trend is the growing preference for powdered and encapsulated extract forms. In 2025, powders already account for 43.8% of market revenue, making them the largest format due to their versatility, stability, and ease of use in multiple applications. Encapsulation and microencapsulation technologies are further enhancing the value proposition by improving bioavailability, controlled release, and taste-masking properties. In pharmaceuticals, encapsulated ferments ensure targeted delivery, while in cosmetics, they stabilize sensitive actives against oxidation.

Oil- and water-dispersible grades are also enabling formulators to expand fermented actives into beverages, emulsions, and topical creams. This trend is reinforced by consumer demand for convenience and manufacturers’ desire for longer shelf life and consistent product quality. Over the next decade, encapsulated powders will be at the forefront of innovation pipelines, particularly in dietary supplements and personal care.
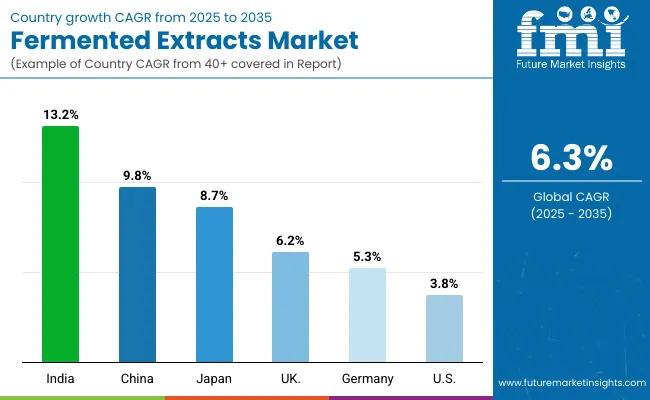
Analysis of Global Fermented Extracts Market By Key Countries

Fermented Extracts Market By Country

Countries CAGR (2025 to 2035)
China 9.8%
India 13.2%
Germany 5.3%
USA 3.8%
UK 6.2%
Japan 8.7%

The global fermented extracts market shows a pronounced regional disparity in adoption speed, strongly influenced by dietary supplement penetration, clean-label demand, and regulatory mandates. Asia-Pacific emerges as the fastest-growing region, anchored by China at 9.8% CAGR and India at 13.2% CAGR. This acceleration is driven by large-scale functional food ecosystems, aggressive investment in nutraceuticals, and government-backed programs promoting herbal and plant-based formulations. China’s regulatory framework promoting natural health foods and traditional Chinese medicine integration further accelerates adoption of fermented extracts in dietary and personal care products. India’s trajectory reflects rapid expansion of dietary supplements and plant-based nutrition, supported by cost competitiveness, Ayurveda-aligned innovation, and export-oriented production.

Europe maintains a strong growth profile, led by Germany at 5.3%, France at 5.6%, and the UK at 6.2%, supported by stringent quality compliance for food safety standards and sustainability reporting. High penetration of functional beverages, probiotics, and postbiotic skincare keeps Europe ahead of North America, particularly in the application of fermented extracts for clean-label foods and natural cosmetics. North America shows moderate expansion, with the USA at 3.8% CAGR, reflecting maturity in core industries and slower nutraceutical adoption relative to Asia. Growth in North America is more service-driven, with increasing demand for encapsulated formats, biotech-derived postbiotics, and functional beverage innovation rather than basic ingredient volume.
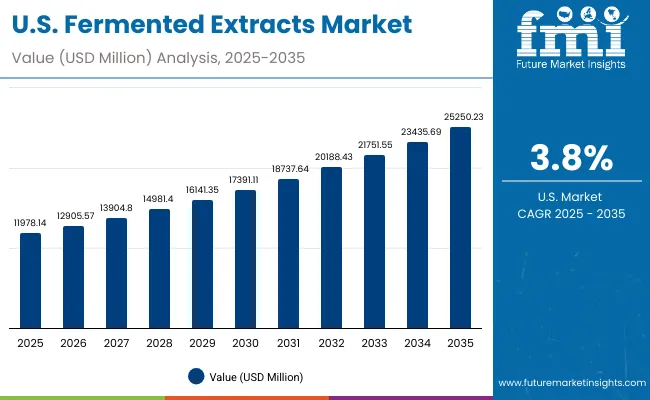
Sales Outlook for Fermented Extracts in the United States

Fermented Extracts Market Usa

Year USA Fermented Extracts Market
2025 11978.1
2026 12905.6
2027 13904.8
2028 14981.4
2029 16141.3
2030 17391.1
2031 18737.6
2032 20188.4
2033 21751.5
2034 23435.7
2035 25250.2

The fermented extracts market in the United States is projected to grow at a CAGR of 3.8%, led by increased investment across food & beverage, cosmetics, and pharmaceuticals. Functional beverage applications recorded a notable year-on-year rise, particularly among sports nutrition and alternative dairy producers. The healthcare and nutraceutical segments, especially gut-health oriented supplements, have integrated postbiotic complexes for faster market traction. Adoption is also rising in personal care, with fermented filtrates being introduced in skin care and hair care. High consumer demand for premium wellness and clean-label products is creating opportunities for bundled ingredient solutions and long-term supplier partnerships.

  • Functional beverages and dairy alternatives are a major use case driving fermented extract adoption.
  • Nutraceutical companies are integrating postbiotics into gut health and immune support products.
  • Cosmetics firms are bundling fermented filtrates with natural actives to differentiate premium skincare.

Growth and Expansion Outlook for Fermented Extracts Market in the United Kingdom

The fermented extracts market in the United Kingdom is expected to grow at a CAGR of 6.2%, supported by applications in functional beverages, bakery, and personal care. Alternative protein firms and functional food startups have accelerated usage of plant-based ferments to improve nutrition density and flavor. Skincare and cosmetics players are rapidly integrating fermented rice, tea, and botanical filtrates into formulations for hydration and barrier repair. In retail, fermented flavor enhancers and seasoning extracts are finding space in sauces and convenience foods. The combination of government grants, public-private innovation programs, and academic collaboration continues to fuel both enterprise and consumer adoption.

  • Functional beverage startups are using fermented extracts for enhanced nutritional profiles.
  • Cosmetics companies are leveraging fermented botanicals for anti-aging and hydration benefits.
  • Food manufacturers are incorporating fermented umami extracts into sauces and seasonings.

Growth and Expansion Outlook for Fermented Extracts Market in India

India is witnessing rapid growth in the fermented extracts market, which is forecast to expand at a CAGR of 13.2% through 2035. A sharp increase in adoption across dietary supplements and functional foods has been driven by affordability and rising awareness among urban and semi-urban populations. Nutraceutical brands are using fermented minerals and postbiotics to align with Ayurveda-inspired wellness trends. Educational institutes and biotech hubs are introducing fermentation research into their programs, while agri-tech companies are deploying plant biostimulants and postbiotic soil treatments. Public health initiatives and consumer interest in immunity-boosting foods are further accelerating demand.
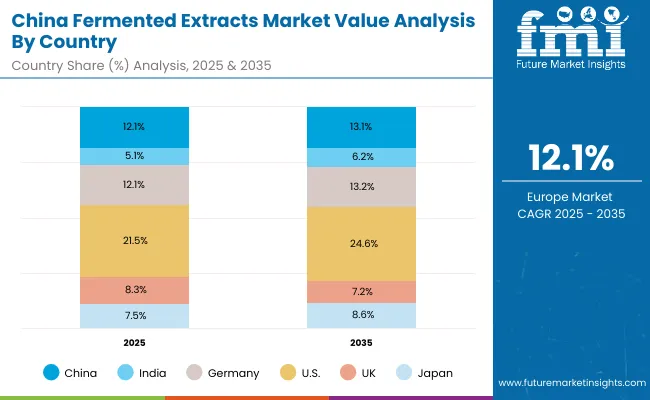
  • Nutraceutical suppliers are adopting fermented actives for Ayurveda-aligned product launches.
  • Plant-based food brands are integrating fermented proteins into dairy and meat alternatives.
  • Agricultural firms are leveraging postbiotics to improve soil health and crop resilience.

Sales Outlook for Fermented Extracts in China

Fermented Extracts Market China

The fermented extracts market in China is expected to grow at a CAGR of 9.8%, the highest among leading economies. This momentum is driven by functional beverage rollouts, large-scale traditional medicine integration, and competitive innovation by local biotech firms. Industrial demand for fermented amino acids, proteins, and seasonings has accelerated across the F&B and alternative protein sectors. Municipal and regional authorities are increasingly supporting fermented agricultural inputs and plant-based biostimulants. Affordable products produced by domestic firms are enabling widespread use in cosmetics, sports nutrition, and consumer health. Cross-sector adoption remains a key growth lever.
  • Functional beverage and alternative dairy firms are driving large-scale adoption of plant-based ferments.
  • Nutraceutical and pharma companies are implementing postbiotics for immune and gut health.
  • Domestic biotech firms are enabling affordable ferments for cosmetics and sports nutrition.

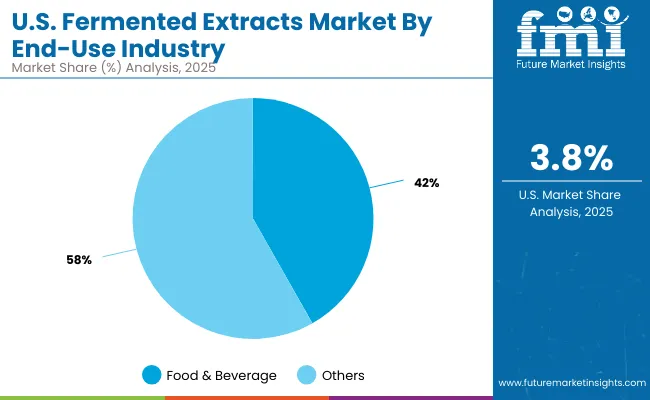
Opportunity Analysis of USA Fermented Extracts Market

Fermented Extracts Market Usa 2

End-Use Segment Market Value Share, 2025
Food & Beverage 41.8%
Segment 58.2%

The USA fermented extracts market presents strong opportunities in the food & beverage sector, which accounts for 41.8% of total revenue in 2025 (USD 5,006.9 million). This leadership is anchored in the rapid growth of functional beverages, alternative dairy formulations, and fortified bakery products. Consumers are seeking gut-health, immunity, and energy-boosting formulations, creating demand for fermented proteins, postbiotics, and flavor-enhancing extracts. The remaining 58.2% of market value is distributed across nutraceuticals, cosmetics, pharmaceuticals, agriculture, and home care applications, each offering significant headroom for diversification. Cosmetics, in particular, are gaining momentum with fermented filtrates entering skin, hair, and scalp care portfolios. As USA consumers demand natural, clean-label, and bioavailable ingredients, the opportunity lies in cross-industry innovation pairing food-grade extracts with pharmaceutical-adjacent uses and expanding powder and encapsulated formats.
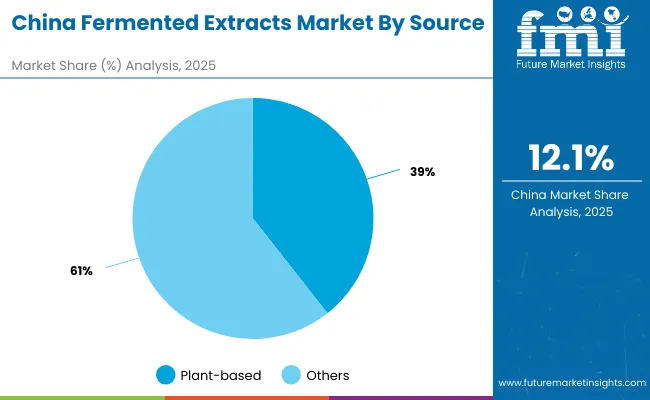
Opportunity Analysis of China Fermented Extracts Market

Fermented Extracts Market China 2

Source Segment Market Value Share, 2025
Plant-based 39.4%
Others 60.6%

In China, the greatest opportunity lies in plant-based fermented extracts, which contribute 39.4% of total revenue in 2025 (USD 2,656.0 million). The dominance of plant-based formats is driven by consumer preference for natural, herbal, and traditional Chinese medicine (TCM)-aligned formulations. This segment is being accelerated by the expansion of functional beverages, dietary supplements, and plant-based alternative foods. The remaining 60.6% share represents fungal, bacterial, algal, and mixed microbial consortia extracts, which hold long-term opportunity in pharmaceuticals, cosmetics, and agriculture. As consumer awareness of postbiotics and fermented actives grows, demand is expanding into skincare, sports nutrition, and plant biostimulants. Affordable production capabilities of domestic biotech firms will help accelerate penetration across broader consumer categories, positioning China as a key growth driver for the global market.

Key Developments in the Global Fermented Extracts Market

  • On March 8, 2025, Kerry Group launched Tastesense™ Advanced and Umamex clean-label flavor enhancers, expanding its fermented ingredient portfolio for sugar reduction and umami/kokumi taste modulation in beverages and savory foods
  • On September 12, 2024, DuPont introduced its YO-MIX PRIME and YO-MIX FAST 1.0 yogurt cultures in China, designed for faster fermentation, improved texture, reduced formulation cost, and higher probiotic survival rates in dairy and alt-dairy products.

Scope of the Report

Item Value
Quantitative Units USD 55,712.3 million
Source Plant-based, Fungal-based, Bacterial-based, Algal/Marine-based, Mixed Microbial Consortia
Extract Form Liquid Concentrates, Powders, Pastes/Slurries, Encapsulated/Microencapsulated Extracts, Oil-Dispersible or Water-Dispersible Grades
End-use Industry Food & Beverage, Nutraceuticals & Dietary Supplements, Cosmetics & Personal Care, Pharmaceutical & Biopharma Adjacent, Agriculture & Horticulture, Animal Nutrition & Pet Care, Home Care & Fabric Care
Distribution Channel Direct-to-Manufacturer, Ingredient Distributors, Private Label/OEM Ingredient Supply
Regions Covered North America, Europe, Asia-Pacific, Latin America, Middle East & Africa
Country Covered United States, Canada, Germany, France, United Kingdom, China, Japan, India, Brazil, South Africa
Key Companies Profiled DuPont, Kerry Group, Cargill Incorporated, BASF SE, Chr. Hansen, Lonza Group, Ajinomoto Corporation, Associated British Foods PLC, Döhler Group SE, Evonik Industries AG, Lallemand Inc., Kyowa Hakko Kirin Co. Ltd, Lesaffre, Corbion N.V., Arjuna Natural Extracts Ltd.
Additional Attributes Dollar sales by source and extract form, adoption trends in postbiotics and fermented botanicals, rising demand for plant-based and powder formats, sector-specific growth in functional beverages, nutraceuticals, and cosmetics, revenue segmentation across food, pharma, and agriculture, integration with encapsulation and controlled-release technologies, regional trends influenced by clean-label and sustainability initiatives, and innovations in microbial, algal, and mixed consortia fermentation.

Key Segments

By End-Use Industry:

  • Food & Beverage
    • Functional Beverages
    • Dairy & Alt-Dairy Bases
    • Bakery & Cereal Ingredients
    • Sauces, Seasonings & Umami Extracts
    • Meat & Alternative Protein Processing Aids
  • Nutraceuticals & Dietary Supplements
    • Postbiotic Complexes
    • Fermented Botanicals
    • Fermented Minerals & Vitamins
    • Sports Nutrition Ferments
  • Cosmetics & Personal Care
    • Fermented Filtrates for Skin Care
    • Hair & Scalp Care Ferments
    • Body & Hygiene Applications
  • Pharmaceutical & Biopharma Adjacent
    • Wound Care & Dermaceutical Ingredients
    • Oral Care Actives
  • Agriculture & Horticulture
    • Plant Biostimulants
    • Soil & Root Zone Postbiotics
    • Foliar Sprays & Seed Treatments
  • Animal Nutrition & Pet Care
    • Gut Health Postbiotics
    • Flavor Enhancers & Palatants
    • Feed Efficiency & Odor Control Ingredients
  • Home Care & Fabric Care
    • Odor Control Ferments
    • Enzyme Cleaning Boosters

By Source:

  • Plant-based
  • Fungal-based
  • Bacterial-based
  • Algal/Marine-based
  • Mixed Microbial Consortia

By Extract Form:

  • Liquid Concentrates
  • Powders
  • Pastes/Slurries
  • Encapsulated/Microencapsulated Extracts
  • Oil-Dispersible or Water-Dispersible Grades

By Distribution Channel:

  • Direct-to-Manufacturer
  • Ingredient Distributors
  • Private Label/OEM Ingredient Supply

By Region:

  • North America
  • Latin America
  • Europe
  • East Asia
  • South Asia & Pacific
  • Middle East and Africa

Table of Content

  1. Executive Summary
    • Global Market Outlook
    • Demand-side Trends
    • Supply-side Trends
    • Technology Roadmap Analysis
    • Analysis and Recommendations
  2. Market Overview
    • Market Coverage / Taxonomy
    • Market Definition / Scope / Limitations
  3. Market Background
    • Market Dynamics
      • Drivers
      • Restraints
      • Opportunity
      • Trends
    • Scenario Forecast
      • Demand in Optimistic Scenario
      • Demand in Likely Scenario
      • Demand in Conservative Scenario
    • Opportunity Map Analysis
    • Product Life Cycle Analysis
    • Supply Chain Analysis
      • Supply Side Participants and their Roles
        • Producers
        • Mid-Level Participants (Traders/ Agents/ Brokers)
        • Wholesalers and Distributors
      • Value Added and Value Created at Node in the Supply Chain
      • List of Raw Material Suppliers
      • List of Existing and Potential Buyer’s
    • Investment Feasibility Matrix
    • Value Chain Analysis
      • Profit Margin Analysis
      • Wholesalers and Distributors
      • Retailers
    • PESTLE and Porter’s Analysis
    • Regulatory Landscape
      • By Key Regions
      • By Key Countries
    • Regional Parent Market Outlook
    • Production and Consumption Statistics
    • Import and Export Statistics
  4. Global Market Analysis 2020 to 2024 and Forecast, 2025 to 2035
    • Historical Market Size Value (USD Million) & Volume (Units) Analysis, 2020 to 2024
    • Current and Future Market Size Value (USD Million) & Volume (Units) Projections, 2025 to 2035
      • Y-o-Y Growth Trend Analysis
      • Absolute $ Opportunity Analysis
  5. Global Market Analysis 2020 to 2024 and Forecast 2025 to 2035, By End-Use Industry
    • Introduction / Key Findings
    • Historical Market Size Value (USD Million) & Volume (Units) Analysis By End-Use Industry, 2020 to 2024
    • Current and Future Market Size Value (USD Million) & Volume (Units) Analysis and Forecast By End-Use Industry, 2025 to 2035
      • Food & Beverage
        • Functional Beverages
        • Dairy & Alt-Dairy Bases
        • Bakery & Cereal Ingredients
        • Sauces, Seasonings & Umami Extracts
        • Meat & Alternative Protein Processing Aids
      • Nutraceuticals & Dietary Supplements
        • Postbiotic Complexes
        • Fermented Botanicals
        • Fermented Minerals & Vitamins
        • Sports Nutrition Ferments
      • Cosmetics & Personal Care
        • Fermented Filtrates for Skin Care
        • Hair & Scalp Care Ferments
        • Body & Hygiene Applications
      • Pharmaceutical & Biopharma Adjacent
        • Wound Care & Dermaceutical Ingredients
        • Oral Care Actives
      • Agriculture & Horticulture
        • Plant Biostimulants
        • Soil & Root Zone Postbiotics
        • Foliar Sprays & Seed Treatments
      • Animal Nutrition & Pet Care
        • Gut Health Postbiotics
        • Flavor Enhancers & Palatants
        • Feed Efficiency & Odor Control Ingredients
      • Home Care & Fabric Care
        • Odor Control Ferments
        • Enzyme Cleaning Boosters
    • Y-o-Y Growth Trend Analysis By End-Use Industry, 2020 to 2024
    • Absolute $ Opportunity Analysis By End-Use Industry, 2025 to 2035
  6. Global Market Analysis 2020 to 2024 and Forecast 2025 to 2035, By Source
    • Introduction / Key Findings
    • Historical Market Size Value (USD Million) & Volume (Units) Analysis By Source, 2020 to 2024
    • Current and Future Market Size Value (USD Million) & Volume (Units) Analysis and Forecast By Source, 2025 to 2035
      • Plant-based
      • Fungal-based
      • Bacterial-based
      • Algal/Marine-based
      • Mixed Microbial Consortia
    • Y-o-Y Growth Trend Analysis By Source, 2020 to 2024
    • Absolute $ Opportunity Analysis By Source, 2025 to 2035
  7. Global Market Analysis 2020 to 2024 and Forecast 2025 to 2035, By Extract Form
    • Introduction / Key Findings
    • Historical Market Size Value (USD Million) & Volume (Units) Analysis By Extract Form, 2020 to 2024
    • Current and Future Market Size Value (USD Million) & Volume (Units) Analysis and Forecast By Extract Form, 2025 to 2035
      • Liquid Concentrates
      • Powders
      • Pastes/Slurries
      • Encapsulated/Microencapsulated Extracts
      • Oil-Dispersible or Water-Dispersible Grades
    • Y-o-Y Growth Trend Analysis By Extract Form, 2020 to 2024
    • Absolute $ Opportunity Analysis By Extract Form, 2025 to 2035
  8. Global Market Analysis 2020 to 2024 and Forecast 2025 to 2035, By Distribution Channel
    • Introduction / Key Findings
    • Historical Market Size Value (USD Million) & Volume (Units) Analysis By Distribution Channel , 2020 to 2024
    • Current and Future Market Size Value (USD Million) & Volume (Units) Analysis and Forecast By Distribution Channel , 2025 to 2035
      • Direct-to-Manufacturer
      • Ingredient Distributors
      • Private Label/OEM Ingredient Supply
    • Y-o-Y Growth Trend Analysis By Distribution Channel , 2020 to 2024
    • Absolute $ Opportunity Analysis By Distribution Channel , 2025 to 2035
  9. Global Market Analysis 2020 to 2024 and Forecast 2025 to 2035, By Region
    • Introduction
    • Historical Market Size Value (USD Million) & Volume (Units) Analysis By Region, 2020 to 2024
    • Current Market Size Value (USD Million) & Volume (Units) Analysis and Forecast By Region, 2025 to 2035
      • North America
      • Latin America
      • Europe
      • East Asia
      • South Asia & Pacific
      • Middle East and Africa
    • Market Attractiveness Analysis By Region
  10. North America Market Analysis 2020 to 2024 and Forecast 2025 to 2035, By Country
    • Historical Market Size Value (USD Million) & Volume (Units) Trend Analysis By Market Taxonomy, 2020 to 2024
    • Market Size Value (USD Million) & Volume (Units) Forecast By Market Taxonomy, 2025 to 2035
      • By Country
        • USA
        • Canada
      • By End-Use Industry
      • By Source
      • By Extract Form
      • By Distribution Channel
    • Market Attractiveness Analysis
      • By Country
      • By End-Use Industry
      • By Source
      • By Extract Form
      • By Distribution Channel
    • Key Takeaways
  11. Latin America Market Analysis 2020 to 2024 and Forecast 2025 to 2035, By Country
    • Historical Market Size Value (USD Million) & Volume (Units) Trend Analysis By Market Taxonomy, 2020 to 2024
    • Market Size Value (USD Million) & Volume (Units) Forecast By Market Taxonomy, 2025 to 2035
      • By Country
        • Brazil
        • Mexico
        • Colombia
        • Rest of Latin America
      • By End-Use Industry
      • By Source
      • By Extract Form
      • By Distribution Channel
    • Market Attractiveness Analysis
      • By Country
      • By End-Use Industry
      • By Source
      • By Extract Form
      • By Distribution Channel
    • Key Takeaways
  12. Europe Market Analysis 2020 to 2024 and Forecast 2025 to 2035, By Country
    • Historical Market Size Value (USD Million) & Volume (Units) Trend Analysis By Market Taxonomy, 2020 to 2024
    • Market Size Value (USD Million) & Volume (Units) Forecast By Market Taxonomy, 2025 to 2035
      • By Country
        • Germany
        • UK
        • France
        • Italy
        • Spain
        • Belgium
        • Netherlands
        • Nordic
        • Switzerland
        • Russia
        • Poland
        • Rest of Europe
      • By End-Use Industry
      • By Source
      • By Extract Form
      • By Distribution Channel
    • Market Attractiveness Analysis
      • By Country
      • By End-Use Industry
      • By Source
      • By Extract Form
      • By Distribution Channel
    • Key Takeaways
  13. East Asia Market Analysis 2020 to 2024 and Forecast 2025 to 2035, By Country
    • Historical Market Size Value (USD Million) & Volume (Units) Trend Analysis By Market Taxonomy, 2020 to 2024
    • Market Size Value (USD Million) & Volume (Units) Forecast By Market Taxonomy, 2025 to 2035
      • By Country
        • China
        • Japan
        • South Korea
      • By End-Use Industry
      • By Source
      • By Extract Form
      • By Distribution Channel
    • Market Attractiveness Analysis
      • By Country
      • By End-Use Industry
      • By Source
      • By Extract Form
      • By Distribution Channel
    • Key Takeaways
  14. South Asia & Pacific Market Analysis 2020 to 2024 and Forecast 2025 to 2035, By Country
    • Historical Market Size Value (USD Million) & Volume (Units) Trend Analysis By Market Taxonomy, 2020 to 2024
    • Market Size Value (USD Million) & Volume (Units) Forecast By Market Taxonomy, 2025 to 2035
      • By Country
        • India
        • Thailand
        • Malaysia
        • Indonesia
        • Singapore
        • Vietnam
        • Australia
        • New Zealand
        • Rest of South Asia
      • By End-Use Industry
      • By Source
      • By Extract Form
      • By Distribution Channel
    • Market Attractiveness Analysis
      • By Country
      • By End-Use Industry
      • By Source
      • By Extract Form
      • By Distribution Channel
    • Key Takeaways
  15. Middle East and Africa Market Analysis 2020 to 2024 and Forecast 2025 to 2035, By Country
    • Historical Market Size Value (USD Million) & Volume (Units) Trend Analysis By Market Taxonomy, 2020 to 2024
    • Market Size Value (USD Million) & Volume (Units) Forecast By Market Taxonomy, 2025 to 2035
      • By Country
        • Turkey
        • UAE
        • Saudi Arabia
        • Israel
        • Other GCC Countries
        • North Africa
        • South Africa
      • By End-Use Industry
      • By Source
      • By Extract Form
      • By Distribution Channel
    • Market Attractiveness Analysis
      • By Country
      • By End-Use Industry
      • By Source
      • By Extract Form
      • By Distribution Channel
    • Key Takeaways
  16. Key Countries Market Analysis
    • USA
      • Pricing Analysis
      • Market Share Analysis, 2024
        • By End-Use Industry
        • By Source
        • By Extract Form
        • By Distribution Channel
    • Canada
      • Pricing Analysis
      • Market Share Analysis, 2024
        • By End-Use Industry
        • By Source
        • By Extract Form
        • By Distribution Channel
    • Brazil
      • Pricing Analysis
      • Market Share Analysis, 2024
        • By End-Use Industry
        • By Source
        • By Extract Form
        • By Distribution Channel
    • Mexico
      • Pricing Analysis
      • Market Share Analysis, 2024
        • By End-Use Industry
        • By Source
        • By Extract Form
        • By Distribution Channel
    • Colombia
      • Pricing Analysis
      • Market Share Analysis, 2024
        • By End-Use Industry
        • By Source
        • By Extract Form
        • By Distribution Channel
    • Germany
      • Pricing Analysis
      • Market Share Analysis, 2024
        • By End-Use Industry
        • By Source
        • By Extract Form
        • By Distribution Channel
    • UK
      • Pricing Analysis
      • Market Share Analysis, 2024
        • By End-Use Industry
        • By Source
        • By Extract Form
        • By Distribution Channel
    • France
      • Pricing Analysis
      • Market Share Analysis, 2024
        • By End-Use Industry
        • By Source
        • By Extract Form
        • By Distribution Channel
    • Italy
      • Pricing Analysis
      • Market Share Analysis, 2024
        • By End-Use Industry
        • By Source
        • By Extract Form
        • By Distribution Channel
    • Spain
      • Pricing Analysis
      • Market Share Analysis, 2024
        • By End-Use Industry
        • By Source
        • By Extract Form
        • By Distribution Channel
    • Belgium
      • Pricing Analysis
      • Market Share Analysis, 2024
        • By End-Use Industry
        • By Source
        • By Extract Form
        • By Distribution Channel
    • Netherlands
      • Pricing Analysis
      • Market Share Analysis, 2024
        • By End-Use Industry
        • By Source
        • By Extract Form
        • By Distribution Channel
    • Nordic
      • Pricing Analysis
      • Market Share Analysis, 2024
        • By End-Use Industry
        • By Source
        • By Extract Form
        • By Distribution Channel
    • Switzerland
      • Pricing Analysis
      • Market Share Analysis, 2024
        • By End-Use Industry
        • By Source
        • By Extract Form
        • By Distribution Channel
    • Russia
      • Pricing Analysis
      • Market Share Analysis, 2024
        • By End-Use Industry
        • By Source
        • By Extract Form
        • By Distribution Channel
    • Poland
      • Pricing Analysis
      • Market Share Analysis, 2024
        • By End-Use Industry
        • By Source
        • By Extract Form
        • By Distribution Channel
    • China
      • Pricing Analysis
      • Market Share Analysis, 2024
        • By End-Use Industry
        • By Source
        • By Extract Form
        • By Distribution Channel
    • Japan
      • Pricing Analysis
      • Market Share Analysis, 2024
        • By End-Use Industry
        • By Source
        • By Extract Form
        • By Distribution Channel
    • South Korea
      • Pricing Analysis
      • Market Share Analysis, 2024
        • By End-Use Industry
        • By Source
        • By Extract Form
        • By Distribution Channel
    • India
      • Pricing Analysis
      • Market Share Analysis, 2024
        • By End-Use Industry
        • By Source
        • By Extract Form
        • By Distribution Channel
    • Thailand
      • Pricing Analysis
      • Market Share Analysis, 2024
        • By End-Use Industry
        • By Source
        • By Extract Form
        • By Distribution Channel
    • Indonesia
      • Pricing Analysis
      • Market Share Analysis, 2024
        • By End-Use Industry
        • By Source
        • By Extract Form
        • By Distribution Channel
    • Australia
      • Pricing Analysis
      • Market Share Analysis, 2024
        • By End-Use Industry
        • By Source
        • By Extract Form
        • By Distribution Channel
    • New Zealand
      • Pricing Analysis
      • Market Share Analysis, 2024
        • By End-Use Industry
        • By Source
        • By Extract Form
        • By Distribution Channel
    • Turkey
      • Pricing Analysis
      • Market Share Analysis, 2024
        • By End-Use Industry
        • By Source
        • By Extract Form
        • By Distribution Channel
    • UAE
      • Pricing Analysis
      • Market Share Analysis, 2024
        • By End-Use Industry
        • By Source
        • By Extract Form
        • By Distribution Channel
    • Saudi Arabia
      • Pricing Analysis
      • Market Share Analysis, 2024
        • By End-Use Industry
        • By Source
        • By Extract Form
        • By Distribution Channel
    • Israel
      • Pricing Analysis
      • Market Share Analysis, 2024
        • By End-Use Industry
        • By Source
        • By Extract Form
        • By Distribution Channel
    • North Africa
      • Pricing Analysis
      • Market Share Analysis, 2024
        • By End-Use Industry
        • By Source
        • By Extract Form
        • By Distribution Channel
    • South Africa
      • Pricing Analysis
      • Market Share Analysis, 2024
        • By End-Use Industry
        • By Source
        • By Extract Form
        • By Distribution Channel
  17. Market Structure Analysis
    • Competition Dashboard
    • Competition Benchmarking
    • Market Share Analysis of Top Players
      • By Regional
      • By End-Use Industry
      • By Source
      • By Extract Form
      • By Distribution Channel
  18. Competition Analysis
    • Competition Deep Dive
      • DuPont
        • Overview
        • Product Portfolio
        • Profitability by Market Segments (Product/Age /Sales Channel/Region)
        • Sales Footprint
        • Strategy Overview
          • Marketing Strategy
          • Product Strategy
          • Channel Strategy
      • Kerry Group
        • Overview
        • Product Portfolio
        • Profitability by Market Segments (Product/Age /Sales Channel/Region)
        • Sales Footprint
        • Strategy Overview
          • Marketing Strategy
          • Product Strategy
          • Channel Strategy
      • Cargill Incorporated
        • Overview
        • Product Portfolio
        • Profitability by Market Segments (Product/Age /Sales Channel/Region)
        • Sales Footprint
        • Strategy Overview
          • Marketing Strategy
          • Product Strategy
          • Channel Strategy
      • BASF SE
        • Overview
        • Product Portfolio
        • Profitability by Market Segments (Product/Age /Sales Channel/Region)
        • Sales Footprint
        • Strategy Overview
          • Marketing Strategy
          • Product Strategy
          • Channel Strategy
      • Chr. Hansen
        • Overview
        • Product Portfolio
        • Profitability by Market Segments (Product/Age /Sales Channel/Region)
        • Sales Footprint
        • Strategy Overview
          • Marketing Strategy
          • Product Strategy
          • Channel Strategy
      • Lonza Group
        • Overview
        • Product Portfolio
        • Profitability by Market Segments (Product/Age /Sales Channel/Region)
        • Sales Footprint
        • Strategy Overview
          • Marketing Strategy
          • Product Strategy
          • Channel Strategy
      • Ajinomoto Corporation
        • Overview
        • Product Portfolio
        • Profitability by Market Segments (Product/Age /Sales Channel/Region)
        • Sales Footprint
        • Strategy Overview
          • Marketing Strategy
          • Product Strategy
          • Channel Strategy
      • Associated British Foods PLC
        • Overview
        • Product Portfolio
        • Profitability by Market Segments (Product/Age /Sales Channel/Region)
        • Sales Footprint
        • Strategy Overview
          • Marketing Strategy
          • Product Strategy
          • Channel Strategy
      • Dohler Group SE
        • Overview
        • Product Portfolio
        • Profitability by Market Segments (Product/Age /Sales Channel/Region)
        • Sales Footprint
        • Strategy Overview
          • Marketing Strategy
          • Product Strategy
          • Channel Strategy
      • Evonik Industries AG
        • Overview
        • Product Portfolio
        • Profitability by Market Segments (Product/Age /Sales Channel/Region)
        • Sales Footprint
        • Strategy Overview
          • Marketing Strategy
          • Product Strategy
          • Channel Strategy
      • Lallemand Inc.
        • Overview
        • Product Portfolio
        • Profitability by Market Segments (Product/Age /Sales Channel/Region)
        • Sales Footprint
        • Strategy Overview
          • Marketing Strategy
          • Product Strategy
          • Channel Strategy
      • Kyowa Hakko Kirin Co. Ltd
        • Overview
        • Product Portfolio
        • Profitability by Market Segments (Product/Age /Sales Channel/Region)
        • Sales Footprint
        • Strategy Overview
          • Marketing Strategy
          • Product Strategy
          • Channel Strategy
      • Lesaffre
        • Overview
        • Product Portfolio
        • Profitability by Market Segments (Product/Age /Sales Channel/Region)
        • Sales Footprint
        • Strategy Overview
          • Marketing Strategy
          • Product Strategy
          • Channel Strategy
      • Corbion N.V.
        • Overview
        • Product Portfolio
        • Profitability by Market Segments (Product/Age /Sales Channel/Region)
        • Sales Footprint
        • Strategy Overview
          • Marketing Strategy
          • Product Strategy
          • Channel Strategy
      • Arjuna Natural Extracts Ltd.
        • Overview
        • Product Portfolio
        • Profitability by Market Segments (Product/Age /Sales Channel/Region)
        • Sales Footprint
        • Strategy Overview
          • Marketing Strategy
          • Product Strategy
          • Channel Strategy
  19. Assumptions & Acronyms Used
  20. Research Methodology

List of Tables

  • Table 1: Globals Market Value (USD Million) Forecast by Region, 2020-2035
  • Table 2: Globals Market Volume (Units) Forecast by Region, 2020-2035
  • Table 3: Globals Market Value (USD Million) Forecast by End-Use Industry, 2020-2035
  • Table 4: Globals Market Volume (Units) Forecast by End-Use Industry, 2020-2035
  • Table 5: Globals Market Value (USD Million) Forecast by Source, 2020-2035
  • Table 6: Globals Market Volume (Units) Forecast by Source, 2020-2035
  • Table 7: Globals Market Value (USD Million) Forecast by Extract Form, 2020-2035
  • Table 8: Globals Market Volume (Units) Forecast by Extract Form, 2020-2035
  • Table 9: Globals Market Value (USD Million) Forecast by Distribution Channel , 2020-2035
  • Table 10: Globals Market Volume (Units) Forecast by Distribution Channel , 2020-2035
  • Table 11: North Americas Market Value (USD Million) Forecast by Country, 2020-2035
  • Table 12: North Americas Market Volume (Units) Forecast by Country, 2020-2035
  • Table 13: North Americas Market Value (USD Million) Forecast by End-Use Industry, 2020-2035
  • Table 14: North Americas Market Volume (Units) Forecast by End-Use Industry, 2020-2035
  • Table 15: North Americas Market Value (USD Million) Forecast by Source, 2020-2035
  • Table 16: North Americas Market Volume (Units) Forecast by Source, 2020-2035
  • Table 17: North Americas Market Value (USD Million) Forecast by Extract Form, 2020-2035
  • Table 18: North Americas Market Volume (Units) Forecast by Extract Form, 2020-2035
  • Table 19: North Americas Market Value (USD Million) Forecast by Distribution Channel , 2020-2035
  • Table 20: North Americas Market Volume (Units) Forecast by Distribution Channel , 2020-2035
  • Table 21: Latin Americas Market Value (USD Million) Forecast by Country, 2020-2035
  • Table 22: Latin Americas Market Volume (Units) Forecast by Country, 2020-2035
  • Table 23: Latin Americas Market Value (USD Million) Forecast by End-Use Industry, 2020-2035
  • Table 24: Latin Americas Market Volume (Units) Forecast by End-Use Industry, 2020-2035
  • Table 25: Latin Americas Market Value (USD Million) Forecast by Source, 2020-2035
  • Table 26: Latin Americas Market Volume (Units) Forecast by Source, 2020-2035
  • Table 27: Latin Americas Market Value (USD Million) Forecast by Extract Form, 2020-2035
  • Table 28: Latin Americas Market Volume (Units) Forecast by Extract Form, 2020-2035
  • Table 29: Latin Americas Market Value (USD Million) Forecast by Distribution Channel , 2020-2035
  • Table 30: Latin Americas Market Volume (Units) Forecast by Distribution Channel , 2020-2035
  • Table 31: Europes Market Value (USD Million) Forecast by Country, 2020-2035
  • Table 32: Europes Market Volume (Units) Forecast by Country, 2020-2035
  • Table 33: Europes Market Value (USD Million) Forecast by End-Use Industry, 2020-2035
  • Table 34: Europes Market Volume (Units) Forecast by End-Use Industry, 2020-2035
  • Table 35: Europes Market Value (USD Million) Forecast by Source, 2020-2035
  • Table 36: Europes Market Volume (Units) Forecast by Source, 2020-2035
  • Table 37: Europes Market Value (USD Million) Forecast by Extract Form, 2020-2035
  • Table 38: Europes Market Volume (Units) Forecast by Extract Form, 2020-2035
  • Table 39: Europes Market Value (USD Million) Forecast by Distribution Channel , 2020-2035
  • Table 40: Europes Market Volume (Units) Forecast by Distribution Channel , 2020-2035
  • Table 41: East Asias Market Value (USD Million) Forecast by Country, 2020-2035
  • Table 42: East Asias Market Volume (Units) Forecast by Country, 2020-2035
  • Table 43: East Asias Market Value (USD Million) Forecast by End-Use Industry, 2020-2035
  • Table 44: East Asias Market Volume (Units) Forecast by End-Use Industry, 2020-2035
  • Table 45: East Asias Market Value (USD Million) Forecast by Source, 2020-2035
  • Table 46: East Asias Market Volume (Units) Forecast by Source, 2020-2035
  • Table 47: East Asias Market Value (USD Million) Forecast by Extract Form, 2020-2035
  • Table 48: East Asias Market Volume (Units) Forecast by Extract Form, 2020-2035
  • Table 49: East Asias Market Value (USD Million) Forecast by Distribution Channel , 2020-2035
  • Table 50: East Asias Market Volume (Units) Forecast by Distribution Channel , 2020-2035
  • Table 51: South Asia & Pacifics Market Value (USD Million) Forecast by Country, 2020-2035
  • Table 52: South Asia & Pacifics Market Volume (Units) Forecast by Country, 2020-2035
  • Table 53: South Asia & Pacifics Market Value (USD Million) Forecast by End-Use Industry, 2020-2035
  • Table 54: South Asia & Pacifics Market Volume (Units) Forecast by End-Use Industry, 2020-2035
  • Table 55: South Asia & Pacifics Market Value (USD Million) Forecast by Source, 2020-2035
  • Table 56: South Asia & Pacifics Market Volume (Units) Forecast by Source, 2020-2035
  • Table 57: South Asia & Pacifics Market Value (USD Million) Forecast by Extract Form, 2020-2035
  • Table 58: South Asia & Pacifics Market Volume (Units) Forecast by Extract Form, 2020-2035
  • Table 59: South Asia & Pacifics Market Value (USD Million) Forecast by Distribution Channel , 2020-2035
  • Table 60: South Asia & Pacifics Market Volume (Units) Forecast by Distribution Channel , 2020-2035
  • Table 61: Middle East and Africas Market Value (USD Million) Forecast by Country, 2020-2035
  • Table 62: Middle East and Africas Market Volume (Units) Forecast by Country, 2020-2035
  • Table 63: Middle East and Africas Market Value (USD Million) Forecast by End-Use Industry, 2020-2035
  • Table 64: Middle East and Africas Market Volume (Units) Forecast by End-Use Industry, 2020-2035
  • Table 65: Middle East and Africas Market Value (USD Million) Forecast by Source, 2020-2035
  • Table 66: Middle East and Africas Market Volume (Units) Forecast by Source, 2020-2035
  • Table 67: Middle East and Africas Market Value (USD Million) Forecast by Extract Form, 2020-2035
  • Table 68: Middle East and Africas Market Volume (Units) Forecast by Extract Form, 2020-2035
  • Table 69: Middle East and Africas Market Value (USD Million) Forecast by Distribution Channel , 2020-2035
  • Table 70: Middle East and Africas Market Volume (Units) Forecast by Distribution Channel , 2020-2035

List of Figures

  • Figure 1: Global Market Value (USD Million) by End-Use Industry, 2025-2035
  • Figure 2: Global Market Value (USD Million) by Source, 2025-2035
  • Figure 3: Global Market Value (USD Million) by Extract Form, 2025-2035
  • Figure 4: Global Market Value (USD Million) by Distribution Channel , 2025-2035
  • Figure 5: Global Market Value (USD Million) by Region, 2025-2035
  • Figure 6: Global Market Value (USD Million) Analysis by Region, 2020-2035
  • Figure 7: Global Market Volume (Units) Analysis by Region, 2020-2035
  • Figure 8: Global Market Value Share (%) and BPS Analysis by Region, 2025-2035
  • Figure 9: Global Market Y-o-Y Growth (%) Projections by Region, 2025-2035
  • Figure 10: Global Market Value (USD Million) Analysis by End-Use Industry, 2020-2035
  • Figure 11: Global Market Volume (Units) Analysis by End-Use Industry, 2020-2035
  • Figure 12: Global Market Value Share (%) and BPS Analysis by End-Use Industry, 2025-2035
  • Figure 13: Global Market Y-o-Y Growth (%) Projections by End-Use Industry, 2025-2035
  • Figure 14: Global Market Value (USD Million) Analysis by Source, 2020-2035
  • Figure 15: Global Market Volume (Units) Analysis by Source, 2020-2035
  • Figure 16: Global Market Value Share (%) and BPS Analysis by Source, 2025-2035
  • Figure 17: Global Market Y-o-Y Growth (%) Projections by Source, 2025-2035
  • Figure 18: Global Market Value (USD Million) Analysis by Extract Form, 2020-2035
  • Figure 19: Global Market Volume (Units) Analysis by Extract Form, 2020-2035
  • Figure 20: Global Market Value Share (%) and BPS Analysis by Extract Form, 2025-2035
  • Figure 21: Global Market Y-o-Y Growth (%) Projections by Extract Form, 2025-2035
  • Figure 22: Global Market Value (USD Million) Analysis by Distribution Channel , 2020-2035
  • Figure 23: Global Market Volume (Units) Analysis by Distribution Channel , 2020-2035
  • Figure 24: Global Market Value Share (%) and BPS Analysis by Distribution Channel , 2025-2035
  • Figure 25: Global Market Y-o-Y Growth (%) Projections by Distribution Channel , 2025-2035
  • Figure 26: Global Market Attractiveness by End-Use Industry, 2025-2035
  • Figure 27: Global Market Attractiveness by Source, 2025-2035
  • Figure 28: Global Market Attractiveness by Extract Form, 2025-2035
  • Figure 29: Global Market Attractiveness by Distribution Channel , 2025-2035
  • Figure 30: Global Market Attractiveness by Region, 2025-2035
  • Figure 31: North America Market Value (USD Million) by End-Use Industry, 2025-2035
  • Figure 32: North America Market Value (USD Million) by Source, 2025-2035
  • Figure 33: North America Market Value (USD Million) by Extract Form, 2025-2035
  • Figure 34: North America Market Value (USD Million) by Distribution Channel , 2025-2035
  • Figure 35: North America Market Value (USD Million) by Country, 2025-2035
  • Figure 36: North America Market Value (USD Million) Analysis by Country, 2020-2035
  • Figure 37: North America Market Volume (Units) Analysis by Country, 2020-2035
  • Figure 38: North America Market Value Share (%) and BPS Analysis by Country, 2025-2035
  • Figure 39: North America Market Y-o-Y Growth (%) Projections by Country, 2025-2035
  • Figure 40: North America Market Value (USD Million) Analysis by End-Use Industry, 2020-2035
  • Figure 41: North America Market Volume (Units) Analysis by End-Use Industry, 2020-2035
  • Figure 42: North America Market Value Share (%) and BPS Analysis by End-Use Industry, 2025-2035
  • Figure 43: North America Market Y-o-Y Growth (%) Projections by End-Use Industry, 2025-2035
  • Figure 44: North America Market Value (USD Million) Analysis by Source, 2020-2035
  • Figure 45: North America Market Volume (Units) Analysis by Source, 2020-2035
  • Figure 46: North America Market Value Share (%) and BPS Analysis by Source, 2025-2035
  • Figure 47: North America Market Y-o-Y Growth (%) Projections by Source, 2025-2035
  • Figure 48: North America Market Value (USD Million) Analysis by Extract Form, 2020-2035
  • Figure 49: North America Market Volume (Units) Analysis by Extract Form, 2020-2035
  • Figure 50: North America Market Value Share (%) and BPS Analysis by Extract Form, 2025-2035
  • Figure 51: North America Market Y-o-Y Growth (%) Projections by Extract Form, 2025-2035
  • Figure 52: North America Market Value (USD Million) Analysis by Distribution Channel , 2020-2035
  • Figure 53: North America Market Volume (Units) Analysis by Distribution Channel , 2020-2035
  • Figure 54: North America Market Value Share (%) and BPS Analysis by Distribution Channel , 2025-2035
  • Figure 55: North America Market Y-o-Y Growth (%) Projections by Distribution Channel , 2025-2035
  • Figure 56: North America Market Attractiveness by End-Use Industry, 2025-2035
  • Figure 57: North America Market Attractiveness by Source, 2025-2035
  • Figure 58: North America Market Attractiveness by Extract Form, 2025-2035
  • Figure 59: North America Market Attractiveness by Distribution Channel , 2025-2035
  • Figure 60: North America Market Attractiveness by Country, 2025-2035
  • Figure 61: Latin America Market Value (USD Million) by End-Use Industry, 2025-2035
  • Figure 62: Latin America Market Value (USD Million) by Source, 2025-2035
  • Figure 63: Latin America Market Value (USD Million) by Extract Form, 2025-2035
  • Figure 64: Latin America Market Value (USD Million) by Distribution Channel , 2025-2035
  • Figure 65: Latin America Market Value (USD Million) by Country, 2025-2035
  • Figure 66: Latin America Market Value (USD Million) Analysis by Country, 2020-2035
  • Figure 67: Latin America Market Volume (Units) Analysis by Country, 2020-2035
  • Figure 68: Latin America Market Value Share (%) and BPS Analysis by Country, 2025-2035
  • Figure 69: Latin America Market Y-o-Y Growth (%) Projections by Country, 2025-2035
  • Figure 70: Latin America Market Value (USD Million) Analysis by End-Use Industry, 2020-2035
  • Figure 71: Latin America Market Volume (Units) Analysis by End-Use Industry, 2020-2035
  • Figure 72: Latin America Market Value Share (%) and BPS Analysis by End-Use Industry, 2025-2035
  • Figure 73: Latin America Market Y-o-Y Growth (%) Projections by End-Use Industry, 2025-2035
  • Figure 74: Latin America Market Value (USD Million) Analysis by Source, 2020-2035
  • Figure 75: Latin America Market Volume (Units) Analysis by Source, 2020-2035
  • Figure 76: Latin America Market Value Share (%) and BPS Analysis by Source, 2025-2035
  • Figure 77: Latin America Market Y-o-Y Growth (%) Projections by Source, 2025-2035
  • Figure 78: Latin America Market Value (USD Million) Analysis by Extract Form, 2020-2035
  • Figure 79: Latin America Market Volume (Units) Analysis by Extract Form, 2020-2035
  • Figure 80: Latin America Market Value Share (%) and BPS Analysis by Extract Form, 2025-2035
  • Figure 81: Latin America Market Y-o-Y Growth (%) Projections by Extract Form, 2025-2035
  • Figure 82: Latin America Market Value (USD Million) Analysis by Distribution Channel , 2020-2035
  • Figure 83: Latin America Market Volume (Units) Analysis by Distribution Channel , 2020-2035
  • Figure 84: Latin America Market Value Share (%) and BPS Analysis by Distribution Channel , 2025-2035
  • Figure 85: Latin America Market Y-o-Y Growth (%) Projections by Distribution Channel , 2025-2035
  • Figure 86: Latin America Market Attractiveness by End-Use Industry, 2025-2035
  • Figure 87: Latin America Market Attractiveness by Source, 2025-2035
  • Figure 88: Latin America Market Attractiveness by Extract Form, 2025-2035
  • Figure 89: Latin America Market Attractiveness by Distribution Channel , 2025-2035
  • Figure 90: Latin America Market Attractiveness by Country, 2025-2035
  • Figure 91: Europe Market Value (USD Million) by End-Use Industry, 2025-2035
  • Figure 92: Europe Market Value (USD Million) by Source, 2025-2035
  • Figure 93: Europe Market Value (USD Million) by Extract Form, 2025-2035
  • Figure 94: Europe Market Value (USD Million) by Distribution Channel , 2025-2035
  • Figure 95: Europe Market Value (USD Million) by Country, 2025-2035
  • Figure 96: Europe Market Value (USD Million) Analysis by Country, 2020-2035
  • Figure 97: Europe Market Volume (Units) Analysis by Country, 2020-2035
  • Figure 98: Europe Market Value Share (%) and BPS Analysis by Country, 2025-2035
  • Figure 99: Europe Market Y-o-Y Growth (%) Projections by Country, 2025-2035
  • Figure 100: Europe Market Value (USD Million) Analysis by End-Use Industry, 2020-2035
  • Figure 101: Europe Market Volume (Units) Analysis by End-Use Industry, 2020-2035
  • Figure 102: Europe Market Value Share (%) and BPS Analysis by End-Use Industry, 2025-2035
  • Figure 103: Europe Market Y-o-Y Growth (%) Projections by End-Use Industry, 2025-2035
  • Figure 104: Europe Market Value (USD Million) Analysis by Source, 2020-2035
  • Figure 105: Europe Market Volume (Units) Analysis by Source, 2020-2035
  • Figure 106: Europe Market Value Share (%) and BPS Analysis by Source, 2025-2035
  • Figure 107: Europe Market Y-o-Y Growth (%) Projections by Source, 2025-2035
  • Figure 108: Europe Market Value (USD Million) Analysis by Extract Form, 2020-2035
  • Figure 109: Europe Market Volume (Units) Analysis by Extract Form, 2020-2035
  • Figure 110: Europe Market Value Share (%) and BPS Analysis by Extract Form, 2025-2035
  • Figure 111: Europe Market Y-o-Y Growth (%) Projections by Extract Form, 2025-2035
  • Figure 112: Europe Market Value (USD Million) Analysis by Distribution Channel , 2020-2035
  • Figure 113: Europe Market Volume (Units) Analysis by Distribution Channel , 2020-2035
  • Figure 114: Europe Market Value Share (%) and BPS Analysis by Distribution Channel , 2025-2035
  • Figure 115: Europe Market Y-o-Y Growth (%) Projections by Distribution Channel , 2025-2035
  • Figure 116: Europe Market Attractiveness by End-Use Industry, 2025-2035
  • Figure 117: Europe Market Attractiveness by Source, 2025-2035
  • Figure 118: Europe Market Attractiveness by Extract Form, 2025-2035
  • Figure 119: Europe Market Attractiveness by Distribution Channel , 2025-2035
  • Figure 120: Europe Market Attractiveness by Country, 2025-2035
  • Figure 121: East Asia Market Value (USD Million) by End-Use Industry, 2025-2035
  • Figure 122: East Asia Market Value (USD Million) by Source, 2025-2035
  • Figure 123: East Asia Market Value (USD Million) by Extract Form, 2025-2035
  • Figure 124: East Asia Market Value (USD Million) by Distribution Channel , 2025-2035
  • Figure 125: East Asia Market Value (USD Million) by Country, 2025-2035
  • Figure 126: East Asia Market Value (USD Million) Analysis by Country, 2020-2035
  • Figure 127: East Asia Market Volume (Units) Analysis by Country, 2020-2035
  • Figure 128: East Asia Market Value Share (%) and BPS Analysis by Country, 2025-2035
  • Figure 129: East Asia Market Y-o-Y Growth (%) Projections by Country, 2025-2035
  • Figure 130: East Asia Market Value (USD Million) Analysis by End-Use Industry, 2020-2035
  • Figure 131: East Asia Market Volume (Units) Analysis by End-Use Industry, 2020-2035
  • Figure 132: East Asia Market Value Share (%) and BPS Analysis by End-Use Industry, 2025-2035
  • Figure 133: East Asia Market Y-o-Y Growth (%) Projections by End-Use Industry, 2025-2035
  • Figure 134: East Asia Market Value (USD Million) Analysis by Source, 2020-2035
  • Figure 135: East Asia Market Volume (Units) Analysis by Source, 2020-2035
  • Figure 136: East Asia Market Value Share (%) and BPS Analysis by Source, 2025-2035
  • Figure 137: East Asia Market Y-o-Y Growth (%) Projections by Source, 2025-2035
  • Figure 138: East Asia Market Value (USD Million) Analysis by Extract Form, 2020-2035
  • Figure 139: East Asia Market Volume (Units) Analysis by Extract Form, 2020-2035
  • Figure 140: East Asia Market Value Share (%) and BPS Analysis by Extract Form, 2025-2035
  • Figure 141: East Asia Market Y-o-Y Growth (%) Projections by Extract Form, 2025-2035
  • Figure 142: East Asia Market Value (USD Million) Analysis by Distribution Channel , 2020-2035
  • Figure 143: East Asia Market Volume (Units) Analysis by Distribution Channel , 2020-2035
  • Figure 144: East Asia Market Value Share (%) and BPS Analysis by Distribution Channel , 2025-2035
  • Figure 145: East Asia Market Y-o-Y Growth (%) Projections by Distribution Channel , 2025-2035
  • Figure 146: East Asia Market Attractiveness by End-Use Industry, 2025-2035
  • Figure 147: East Asia Market Attractiveness by Source, 2025-2035
  • Figure 148: East Asia Market Attractiveness by Extract Form, 2025-2035
  • Figure 149: East Asia Market Attractiveness by Distribution Channel , 2025-2035
  • Figure 150: East Asia Market Attractiveness by Country, 2025-2035
  • Figure 151: South Asia & Pacific Market Value (USD Million) by End-Use Industry, 2025-2035
  • Figure 152: South Asia & Pacific Market Value (USD Million) by Source, 2025-2035
  • Figure 153: South Asia & Pacific Market Value (USD Million) by Extract Form, 2025-2035
  • Figure 154: South Asia & Pacific Market Value (USD Million) by Distribution Channel , 2025-2035
  • Figure 155: South Asia & Pacific Market Value (USD Million) by Country, 2025-2035
  • Figure 156: South Asia & Pacific Market Value (USD Million) Analysis by Country, 2020-2035
  • Figure 157: South Asia & Pacific Market Volume (Units) Analysis by Country, 2020-2035
  • Figure 158: South Asia & Pacific Market Value Share (%) and BPS Analysis by Country, 2025-2035
  • Figure 159: South Asia & Pacific Market Y-o-Y Growth (%) Projections by Country, 2025-2035
  • Figure 160: South Asia & Pacific Market Value (USD Million) Analysis by End-Use Industry, 2020-2035
  • Figure 161: South Asia & Pacific Market Volume (Units) Analysis by End-Use Industry, 2020-2035
  • Figure 162: South Asia & Pacific Market Value Share (%) and BPS Analysis by End-Use Industry, 2025-2035
  • Figure 163: South Asia & Pacific Market Y-o-Y Growth (%) Projections by End-Use Industry, 2025-2035
  • Figure 164: South Asia & Pacific Market Value (USD Million) Analysis by Source, 2020-2035
  • Figure 165: South Asia & Pacific Market Volume (Units) Analysis by Source, 2020-2035
  • Figure 166: South Asia & Pacific Market Value Share (%) and BPS Analysis by Source, 2025-2035
  • Figure 167: South Asia & Pacific Market Y-o-Y Growth (%) Projections by Source, 2025-2035
  • Figure 168: South Asia & Pacific Market Value (USD Million) Analysis by Extract Form, 2020-2035
  • Figure 169: South Asia & Pacific Market Volume (Units) Analysis by Extract Form, 2020-2035
  • Figure 170: South Asia & Pacific Market Value Share (%) and BPS Analysis by Extract Form, 2025-2035
  • Figure 171: South Asia & Pacific Market Y-o-Y Growth (%) Projections by Extract Form, 2025-2035
  • Figure 172: South Asia & Pacific Market Value (USD Million) Analysis by Distribution Channel , 2020-2035
  • Figure 173: South Asia & Pacific Market Volume (Units) Analysis by Distribution Channel , 2020-2035
  • Figure 174: South Asia & Pacific Market Value Share (%) and BPS Analysis by Distribution Channel , 2025-2035
  • Figure 175: South Asia & Pacific Market Y-o-Y Growth (%) Projections by Distribution Channel , 2025-2035
  • Figure 176: South Asia & Pacific Market Attractiveness by End-Use Industry, 2025-2035
  • Figure 177: South Asia & Pacific Market Attractiveness by Source, 2025-2035
  • Figure 178: South Asia & Pacific Market Attractiveness by Extract Form, 2025-2035
  • Figure 179: South Asia & Pacific Market Attractiveness by Distribution Channel , 2025-2035
  • Figure 180: South Asia & Pacific Market Attractiveness by Country, 2025-2035
  • Figure 181: Middle East and Africa Market Value (USD Million) by End-Use Industry, 2025-2035
  • Figure 182: Middle East and Africa Market Value (USD Million) by Source, 2025-2035
  • Figure 183: Middle East and Africa Market Value (USD Million) by Extract Form, 2025-2035
  • Figure 184: Middle East and Africa Market Value (USD Million) by Distribution Channel , 2025-2035
  • Figure 185: Middle East and Africa Market Value (USD Million) by Country, 2025-2035
  • Figure 186: Middle East and Africa Market Value (USD Million) Analysis by Country, 2020-2035
  • Figure 187: Middle East and Africa Market Volume (Units) Analysis by Country, 2020-2035
  • Figure 188: Middle East and Africa Market Value Share (%) and BPS Analysis by Country, 2025-2035
  • Figure 189: Middle East and Africa Market Y-o-Y Growth (%) Projections by Country, 2025-2035
  • Figure 190: Middle East and Africa Market Value (USD Million) Analysis by End-Use Industry, 2020-2035
  • Figure 191: Middle East and Africa Market Volume (Units) Analysis by End-Use Industry, 2020-2035
  • Figure 192: Middle East and Africa Market Value Share (%) and BPS Analysis by End-Use Industry, 2025-2035
  • Figure 193: Middle East and Africa Market Y-o-Y Growth (%) Projections by End-Use Industry, 2025-2035
  • Figure 194: Middle East and Africa Market Value (USD Million) Analysis by Source, 2020-2035
  • Figure 195: Middle East and Africa Market Volume (Units) Analysis by Source, 2020-2035
  • Figure 196: Middle East and Africa Market Value Share (%) and BPS Analysis by Source, 2025-2035
  • Figure 197: Middle East and Africa Market Y-o-Y Growth (%) Projections by Source, 2025-2035
  • Figure 198: Middle East and Africa Market Value (USD Million) Analysis by Extract Form, 2020-2035
  • Figure 199: Middle East and Africa Market Volume (Units) Analysis by Extract Form, 2020-2035
  • Figure 200: Middle East and Africa Market Value Share (%) and BPS Analysis by Extract Form, 2025-2035
  • Figure 201: Middle East and Africa Market Y-o-Y Growth (%) Projections by Extract Form, 2025-2035
  • Figure 202: Middle East and Africa Market Value (USD Million) Analysis by Distribution Channel , 2020-2035
  • Figure 203: Middle East and Africa Market Volume (Units) Analysis by Distribution Channel , 2020-2035
  • Figure 204: Middle East and Africa Market Value Share (%) and BPS Analysis by Distribution Channel , 2025-2035
  • Figure 205: Middle East and Africa Market Y-o-Y Growth (%) Projections by Distribution Channel , 2025-2035
  • Figure 206: Middle East and Africa Market Attractiveness by End-Use Industry, 2025-2035
  • Figure 207: Middle East and Africa Market Attractiveness by Source, 2025-2035
  • Figure 208: Middle East and Africa Market Attractiveness by Extract Form, 2025-2035
  • Figure 209: Middle East and Africa Market Attractiveness by Distribution Channel , 2025-2035
  • Figure 210: Middle East and Africa Market Attractiveness by Country, 2025-2035

Frequently Asked Questions

How big is the Global Fermented Extracts Market in 2025?

The Global Fermented Extracts Market is estimated to be valued at USD 55,712.3 million in 2025.

What will be the size of the Global Fermented Extracts Market in 2035?

The market size for the Global Fermented Extracts Market is projected to reach USD 102,643.2 million by 2035.

How much will be the Global Fermented Extracts Market growth between 2025 and 2035?

The Global Fermented Extracts Market is expected to grow at a 6.3% CAGR between 2025 and 2035.

What are the key product types in the Global Fermented Extracts Market?

The key product types in the Global Fermented Extracts Market are liquid concentrates, powders, pastes/slurries, encapsulated/microencapsulated extracts, and oil-/water-dispersible grades.

Which end-use industry will contribute significant share in the Global Fermented Extracts Market in 2025?

In terms of end-use, the Food & Beverage segment is set to command the largest share at 38.5% in 2025.

Explore Similar Insights

Future Market Insights

Fermented Extracts Market