Fermented Coffee Market Size and Share Forecast Outlook 2025 to 2035

The global fermented coffee market is expected to be valued at USD 330.6 million in 2025 and reach USD 766.8 million by 2035, reflecting an absolute growth of USD 436.2 million over the forecast period. This expansion represents a compound annual growth rate (CAGR) of 8.8%, signaling a more than 2.3X increase in market size over the decade.
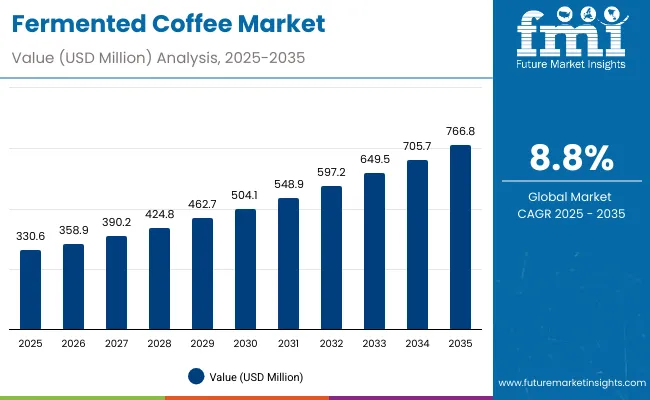
Fermented Coffee Market 1

Quick Stats for Fermented Coffee Market

  • Fermented Coffee Market Value (2025): USD 330.6 million
  • Fermented Coffee Market Forecast Value (2035): USD 766.8 million
  • Fermented Coffee Forecast CAGR: 8.8%
  • Leading Segment in Fermented Coffee in 2025, by Product Type: Ready-to-Drink (RTD) Coffee (28.4%)
  • Key Growth Regions in the Fermented Coffee: North America, Asia-Pacific, Europe
  • Top Key Players in Fermented Coffee: Nestlé S.A., Starbucks Corporation, JDE Peet’s N.V., Lavazza Group, Blue Bottle Coffee Inc., Bulletproof 360, Inc., Volacanica Coffee, Death Wish Coffee Co., Strauss Coffee B.V., and Toffee Coffee Roasters.

Fermented Coffee Market Key Takeaways
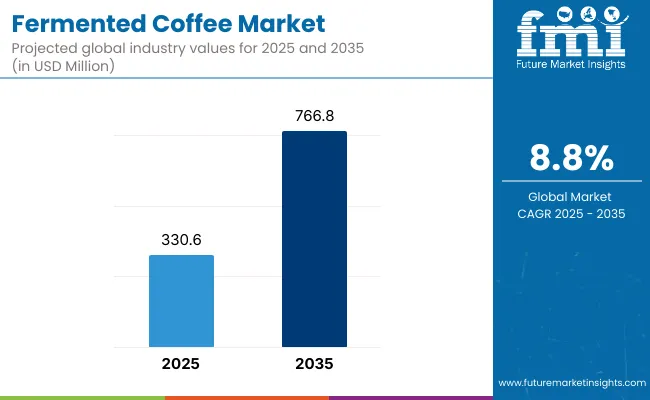
Fermented Coffee Market

Metric Value
Fermented Coffee Estimated Value in (2025E) USD 330.6 million
Fermented Coffee Forecast Value in (2035F) USD 766.8 million
Forecast CAGR (2025 to 2035) 8.8%

During the first half of the forecast window, from 2025 to 2030, the market is projected to grow from USD 330.6 million to USD 504.1 million, contributing approximately USD 173.5 million, which equates to 39.7% of the decade’s total value addition. This period is expected to be defined by early-stage adoption across health-focused beverage portfolios, with growing clinical validation around gut health and antioxidant benefits driving manufacturer interest. Yeast-based and bacterial fermentation techniques are anticipated to lead during this phase, supported by sensory differentiation and process consistency.

The second half, spanning 2030 to 2035, is projected to generate USD 262.7 million, accounting for the remaining 60.3% of the total decade gain. During this phase, fermented coffee is expected to transition from niche to mainstream within functional and specialty beverage categories, particularly as integration into sports nutrition and cognitive wellness products becomes more prevalent. Premiumization, clean-label positioning, and hybrid fermentation methods are forecasted to drive accelerated value creation, especially in East Asia, North America, and parts of Europe.

From 2020 to 2024, the fermented coffee market evolved from artisanal micro-lots to early-stage commercial scalability. Growth during this period was driven by specialty cafés, direct-to-consumer wellness brands, and functional beverage startups. Leading players such as Nestlé and Starbucks introduced early RTD fermented variants, while niche players like Blue Bottle and Bulletproof pioneered co-fermented and probiotic-enhanced formats.

By 2025, demand for fermented coffee is projected to reach USD 330.6 million, supported by growing consumer interest in gut health, low-acidity brews, and clean-label innovation. Between 2025 and 2035, the competitive landscape is expected to shift from flavor innovation alone to health claims, ingredient transparency, and multi-format convenience. Ecosystem differentiation will be driven by sourcing traceability, microbial processing technology, and wellness-driven brand positioning. Players integrating fermentation science with consumer lifestyle branding are expected to outperform those offering commodity coffee products.

Why the Fermented Coffee Market is growing?

The fermented coffee market has been propelled by a growing convergence of health-conscious consumption, ingredient innovation, and demand for differentiated beverage experiences. Consumer preferences have shifted toward functional drinks offering digestive benefits, enhanced antioxidant potential, and smoother taste profiles-all of which have been increasingly associated with fermented coffee.

Scientific advancements in microbial and enzymatic fermentation have enabled controlled flavor modulation, acid reduction, and nutritional enhancement-allowing manufacturers to meet rising demand for low-acidity, gut-friendly options. These innovations have been supported by investments in proprietary fermentation methods and biotechnological process optimization.

Rising interest in probiotic-infused beverages and clean-label formulations has further accelerated the inclusion of fermented coffee in wellness-focused portfolios. The category is being increasingly positioned within functional beverage sets, particularly among younger consumers seeking alternatives to conventional energy drinks and nootropics.

Sustainable sourcing of Arabica and Robusta beans, coupled with regenerative agricultural practices, has also contributed to the market's credibility and growth. In parallel, market expansion has been enabled by online retail channels, artisanal coffee shops, and direct-to-consumer models that allow small-batch, story-driven offerings to reach global audiences.

As fermentation becomes more integrated into premium coffee production, its role in enhancing sensorial and functional value is expected to deepen-establishing fermented coffee as a long-term growth category in the global beverage industry.

Segmental Analysis

The fermented coffee market has been segmented across Product Type, Application, and Source, each representing critical dimensions of market evolution. Product categories such as RTD coffee, ground coffee, and instant formats have been adopted in response to shifting consumer lifestyles and preferences for convenience. Application segmentation spans specialty beverages, functional health drinks, and nutraceuticals, indicating cross-category penetration. Sourcing strategies, meanwhile, are differentiated by bean variety arabica, robusta, liberica, and excelsa each contributing distinct flavor profiles and microbial compatibility in fermentation processes. These segments have been shaped by consumer demand for functional health benefits, premium sensory experiences, and sustainability-linked product positioning. As fermented coffee moves from artisanal experimentation to commercial scale, value capture across segments is expected to deepen. A focus on diversified product forms, health-enhancing applications, and bean traceability is likely to define competitive positioning across the forecast horizon.
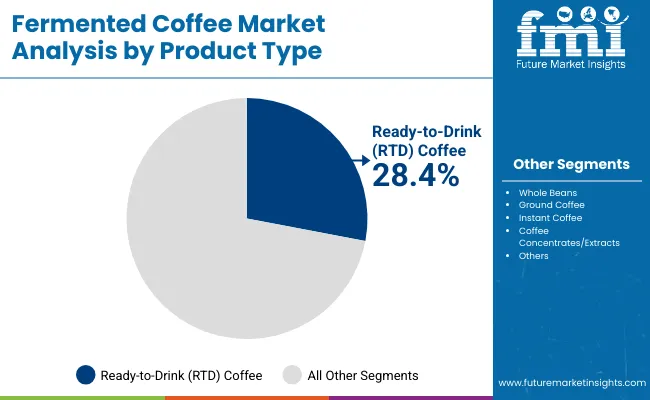
Insights into the Product Type Segment with Ready-to-Drink (RTD) Coffee leading in Market Share

Fermented Coffee Market By Product Type

Product Type Segment Market Value Share, 2025
Ready-to-Drink (RTD) Coffee 28.4%
Ground Coffee 22.6%

The Ready-to-Drink (RTD) coffee segment is projected to hold the largest market share of 28.4% in 2025. This leadership has been supported by consumer demand for convenience, on-the-go formats, and functional refreshment. RTD fermented coffee has been positioned as a bridge between health-conscious beverages and specialty brews, offering enhanced bioavailability and reduced acidity without preparation complexity.

Growth in this segment has been reinforced by rising placements in retail chillers, vending machines, and online wellness platforms. Innovations in probiotic-infused and adaptogen-enhanced RTD coffees have been adopted by functional beverage brands targeting the mental clarity, gut health, and energy niches. As cold-brew fermentation techniques become mainstream, flavor retention and stability have been optimized further boosting RTD appeal. Continued investment in shelf-stable formulations and recyclable packaging is expected to consolidate this segment's lead.
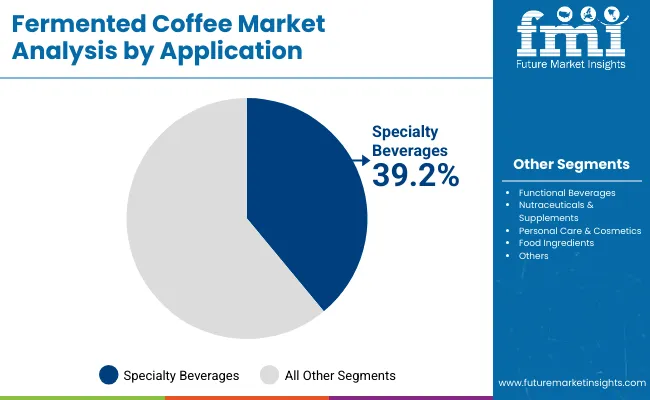
Insights into the Application Segment with Specialty Beverages Dominating the Demand

Fermented Coffee Market By Application

Application 2025 Share%
Specialty Beverages (cafés, artisanal brewing) 39.2%
Functional Beverages (probiotic/enhanced coffee drinks) 21.7%
Food Ingredients (flavoring agents, chocolate & confectionery infusions) 15.6%

The Specialty Beverages segment is expected to account for 39.2% of market share in 2025, maintaining its role as the foundational application for fermented coffee. This segment has been driven by the premiumization of coffee culture and the expansion of third-wave cafés that prioritize small-batch, single-origin, and process-differentiated offerings. Fermentation has been leveraged by artisanal roasters and boutique coffee houses to achieve unique flavor expressions and microbial terroir. Customer experiences have been elevated through educational tastings, fermentation storytelling, and transparent sourcing enhancing brand affinity. This segment has also served as an innovation sandbox for functional crossover applications. As global café chains expand their specialty menus and urban consumers seek craft-level beverage experiences, fermented coffee is expected to remain a pillar within this segment's evolution.
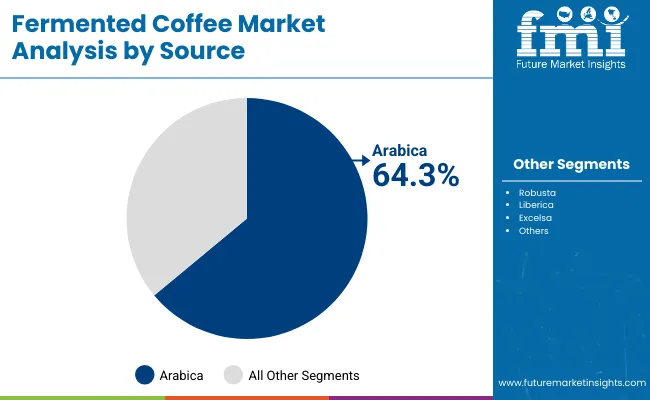
Insights into the Source Segment with Focus on Arabica

Fermented Coffee Market By Source

Source 2025 Share%
Arabica 64.3%
Robusta 20.9%
Liberica 9.7%

Arabica beans are forecasted to represent 64.3% of the fermented coffee market by 2025, establishing them as the dominant source material. This preference has been attributed to Arabica’s superior cupping profile, lower bitterness, and higher compatibility with fermentation cultures. Processing with Arabica has allowed producers to emphasize clarity, fruit-forward notes, and floral complexity characteristics highly valued in specialty and RTD segments. Organic and regenerative farming methods have increasingly been applied to Arabica cultivation, aligning with ethical and clean-label market demands. However, emerging experimentation with Liberica and Excelsa is expected to expand microbial diversity and flavor novelty. While Arabica will likely retain its lead in terms of volume and consumer preference, broader source diversification is anticipated as fermentation methods mature.

What are the Drivers, Restraints, and Key Trends of the Fermented Coffee Market?

While growing health awareness continues to drive fermented coffee consumption, challenges such as sensory acceptance and microbial process variability remain under scrutiny. The market is being reshaped by innovation in probiotic formulation, cross-category beverage integration, and consumer demand for functional wellness-all underpinned by traceable sourcing and sustainability commitments across global supply chains.

Demand for Gut-Health & Functional Beverages

The fermented coffee market has been propelled by its alignment with gut-health and functional beverage trends. As digestive wellness becomes a top health priority, demand for naturally probiotic-rich drinks has been amplified. Fermented coffee has been positioned as a low-acidity, antioxidant-enhanced alternative to conventional brews-making it highly attractive to wellness-conscious consumers. The inclusion of prebiotic fibers and bioactive compounds has enabled further value differentiation. This shift has been reinforced by clinical studies and clean-label marketing, allowing the category to gain momentum in both retail and foodservice channels.

Integration into Nootropic & Adaptogen Drink Categories

A trend toward multi-functional beverage positioning has been observed, with fermented coffee increasingly integrated into nootropic and adaptogen-infused formulations. Mental clarity, energy balance, and stress management have been identified as emerging consumer needs, and fermented coffee is being adapted to support these functions. Product formats combining fermented coffee with L-theanine, lion’s mane, or ashwagandha are being introduced, particularly through direct-to-consumer brands. This convergence with cognitive wellness is expected to reshape product innovation pipelines, especially in North America and East Asia.
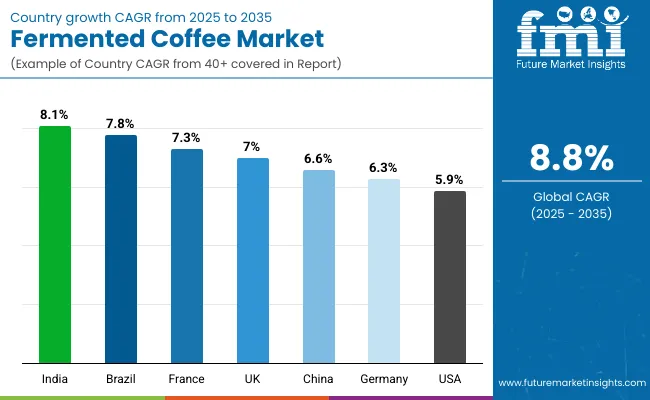
Analysis of Fermented Coffee Market by Key Countries

Country Wise Fermented Coffee Market

Countries CAGR (2025 to 2035)
China 6.6%
India 8.1%
Germany 6.3%
France 7.3%
UK 7.0%
USA 5.9%
Brazil 7.8%

The global fermented coffee market has demonstrated regionally uneven growth, shaped by health awareness, café culture maturity, and functional beverage adoption. Asia-Pacific has been positioned as the fastest-growing regional cluster, led by India at 8.1% CAGR and China at 6.6% CAGR. In India, market expansion has been fueled by rising urban health consciousness, growing penetration of probiotic-enhanced drinks, and rapid digitalization of specialty retail. In China, demand has been driven by innovations in functional RTD coffees and the integration of traditional wellness cues with contemporary beverage formats.

Europe has continued to maintain strong growth momentum, anchored by France (7.3%), the UK (7.0%), and Germany (6.3%). These markets have benefited from sophisticated specialty coffee consumption, increasing preference for low-acidity variants, and sustainability-linked product sourcing. Government-backed support for organic and circular food systems has further accelerated fermented coffee inclusion in both retail and foodservice menus.

In North America, the United States has exhibited a moderate CAGR of 5.9%, with growth being driven primarily through premiumization, direct-to-consumer channels, and cognitive health product crossovers. Meanwhile, Brazil, at a robust 7.8% CAGR, has emerged as a dual-market-serving both origin-based specialty exports and domestic adoption of wellness-oriented coffee innovations. Country-level innovation and localized taste adaptation are expected to remain key to regional leadership.
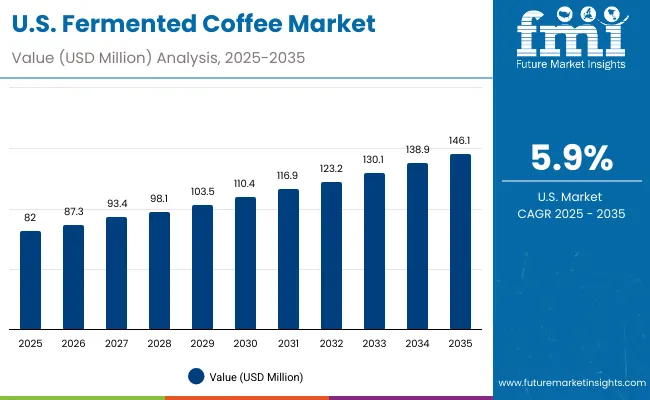
Sales Outlook for Fermented Coffee in the United States

Usa Fermented Coffee Market

Year USA Fermented Coffee Market (USD Million)
2025 82.0
2026 87.3
2027 93.4
2028 98.1
2029 103.5
2030 110.4
2031 116.9
2032 123.2
2033 130.1
2034 138.9
2035 146.1

The fermented coffee market in the United States is projected to expand from USD 82.0 million in 2025 to USD 146.1 million in 2035, reflecting a compound annual growth rate (CAGR) of 5.9% over the forecast period. Growth is expected to be led by premiumization trends, rising demand for gut-health beverages, and increasing RTD coffee penetration across urban and suburban markets.

Adoption has been supported by direct-to-consumer (DTC) wellness brands, café chains incorporating functional beverages, and the emergence of probiotic coffee blends targeting digestive and mental clarity benefits. Consumer preferences have increasingly shifted toward low-acidity, clean-label formats driving experimentation in fermentation processes and hybrid blends.

  • RTD and ground fermented coffees have been positioned as wellness alternatives to traditional energy drinks.
  • Digital-native wellness brands have actively introduced nootropic and adaptogenic coffee fusions in USA markets.

Further acceleration is expected to be driven by cold-chain infrastructure improvements, retail diversification, and partnerships with functional ingredient suppliers, especially within the health-focused food and beverage segments.

Growth and Expansion Outlook for Fermented Coffee Market in the United Kingdom

The fermented coffee market in the United Kingdom is expected to grow at a CAGR of 7.0% between 2025 and 2035, supported by a growing appetite for premium, health-enhancing beverages. As consumers move away from high-sugar energy drinks, fermented coffee has been positioned as a clean-label alternative offering gut-health and cognitive wellness benefits. The RTD segment has shown strong traction, with chilled probiotic coffee blends increasingly offered through premium retailers, health stores, and foodservice outlets.

Fermentation has been adopted by local roasters to enhance product storytelling, leveraging flavor complexity and sustainability claims. Innovation has been promoted through partnerships between specialty coffee producers and biotech startups exploring nootropic and adaptogenic infusions. Regulatory alignment around sugar reduction and wellness product labeling has further boosted fermented coffee's retail acceptance.

  • Functional RTD coffee has been adopted as a wellness-focused beverage in premium retail.
  • Specialty roasters have used fermentation to introduce flavor-driven product narratives.
  • Health claims supported by microbiome science have improved consumer trust.
  • Growth has been enabled by cross-category visibility in cafés, health stores, and online platforms.

Growth and Expansion Outlook for Fermented Coffee in China

In China, the fermented coffee market is projected to register a CAGR of 6.6%, driven by rising consumer sophistication in the functional beverage space and an accelerated transition to wellness-based coffee offerings. While the coffee market remains dominated by instant and milk-based drinks, the demand for low-acidity, gut-friendly formulations has been rising among younger, urban populations.

RTD fermented coffee infused with probiotics, collagen, and adaptogenic herbs has gained shelf presence in high-end supermarkets and online wellness platforms. The influence of traditional Chinese medicine (TCM) has encouraged acceptance of fermentation as a health-enhancing process. Café chains in Tier 1 cities such as Shanghai, Beijing, and Shenzhen have begun experimenting with small-batch fermented brews, often marketed as energy-balancing or digestion-friendly drinks.

  • Fermented RTD coffee formats have gained popularity via digital-native health brands.
  • Hybrid beverages with TCM-aligned ingredients have increased mainstream acceptability.
  • Innovation has been supported by localized ingredient partnerships and flavor tailoring.
  • Product acceptance has grown across both functional health and clean-label coffee segments.
  • As regulatory openness to functional food claims improves, fermented coffee is likely to establish a firmer foothold in China’s evolving beverage ecosystem.

Sales Outlook for Fermented Coffee in India

India’s fermented coffee market is forecasted to grow at an impressive CAGR of 8.1% during 2025-2035, placing it among the most dynamic emerging markets. Urbanization, rising middle-class health awareness, and a digitally engaged youth demographic have accelerated the shift toward functional and wellness-based beverages. Fermented coffee is being introduced as both a ready-to-drink (RTD) format and as part of premium café menus in metro cities like Bengaluru, Mumbai, and Delhi.

Consumer curiosity has been amplified by India’s long-standing cultural association with fermented foods and gut health via Ayurveda. This cultural alignment has been leveraged by DTC brands offering localized blends with Ayurvedic herbs and natural probiotics. E-commerce platforms have enabled smaller startups to enter the market efficiently, offering clean-label, fermented coffee formats with adaptogenic positioning.
  • Functional RTD coffee has been adopted as a healthier caffeinated alternative by urban millennials.
  • Ayurvedic fusion products have enhanced cultural resonance and differentiated offerings.
  • Café chains and boutique brands have piloted fermented brews for in-store experiences.
  • E-commerce and DTC channels have unlocked rapid access to niche consumer segments.

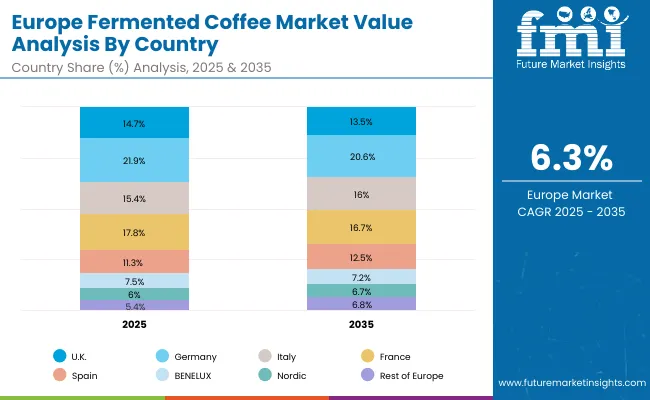
In-depth Analysis of Fermented Coffee in Germany

Europe Fermented Coffee Market

Countries 2025
UK 14.7%
Germany 21.9%
Italy 15.4%
France 17.8%
Spain 11.3%
BENELUX 7.5%
Nordic 6.0%
Rest of Europe 5.4%
Countries 2035
UK 13.5%
Germany 20.6%
Italy 16.0%
France 16.7%
Spain 12.5%
BENELUX 7.2%
Nordic 6.7%
Rest of Europe 6.8%

The fermented coffee market in Germany is anticipated to expand at a CAGR of 6.3%, driven by a sophisticated consumer base that values product integrity, functional health claims, and sustainability. Germany has long been a pioneer in organic food and beverage innovation, making it an ideal launchpad for fermented coffee products that align with microbiome health and clean-label preferences.

Specialty cafés in Berlin, Hamburg, and Munich have incorporated fermented brews into seasonal menus, often emphasizing flavor terroir and bean fermentation techniques. Retail chains and bio-supermarkets have embraced RTD fermented coffees that are shelf-stable, plant-based, and enhanced with prebiotics or adaptogens. Ingredient transparency, recyclable packaging, and certifications such as Fairtrade and EU Organic have further driven consumer trust and loyalty.
  • Organic fermented coffee has been supported by Germany’s mature natural food retail network.
  • Product differentiation through microbial terroir has enhanced appeal in specialty cafés.
  • Regulatory clarity on wellness claims has enabled functional beverages to thrive.
  • Sustainability alignment has strengthened acceptance of fermented formats over RTD energy drinks.

Growth Outlook for Fermented Coffee in Japan

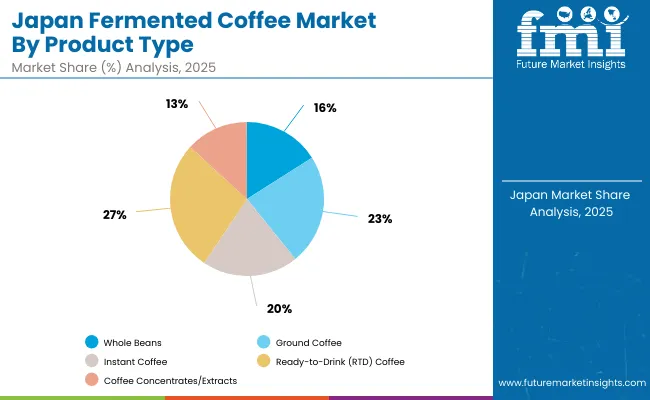
Japan Fermented Coffee Market

Product Type Market Value Share, 2025
Whole Beans 16.0%
Ground Coffee 23.2%
Instant Coffee 20.2%
Ready-to-Drink (RTD) Coffee 27.4%
Coffee Concentrates/Extracts 13.2%

The fermented coffee market in Japan is projected to hold a significant position in the global landscape by 2025, led by an advanced food innovation ecosystem and strong consumer openness to health-focused beverages. The RTD segment, accounting for 27.4%, is expected to lead due to Japan’s mature convenience culture and high demand for on-the-go, functional refreshment. Ground coffee and instant coffee collectively capture over 43% of the market, reflecting continued preference for at-home and workplace consumption.

Market expansion is being supported by the integration of probiotic and prebiotic claims, a growing focus on digestive health, and a consumer base already familiar with fermented foods such as natto, miso, and kombucha. Fermented coffee aligns naturally with this landscape, offering both functional and flavor benefits.
  • Japan is expected to contribute a substantial share of global RTD fermented coffee sales.
  • Consumer familiarity with fermentation supports early-stage adoption of probiotic coffee drinks.
  • RTD and instant formats have been preferred due to fast-paced urban lifestyles.
  • Innovation is driven by collaborations between beverage giants and health-focused startups.

Opportunity Analysis of South Korea Fermented Coffee Market

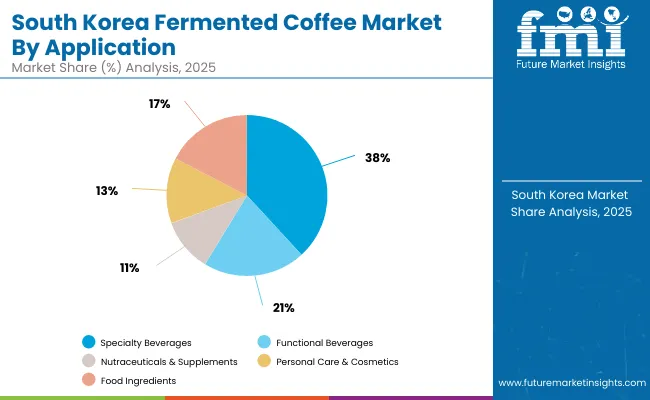
South Korea Fermented Coffee Market

End-Use Application Market Value Share, 2025
Specialty Beverages (cafés, artisanal brewing) 38.2%
Functional Beverages (probiotic/enhanced coffee drinks) 20.6%
Nutraceuticals & Supplements 10.7%
Personal Care & Cosmetics (antioxidant-rich formulations) 13.2%
Food Ingredients (flavoring agents, chocolate & confectionery infusions) 17.4%

The fermented coffee market in South Korea is projected to expand robustly through 2035, driven by consumer affinity for functional, aesthetic, and health-enhancing products. In 2025, the specialty beverages segment is expected to contribute 38.2% of the market value, led by a flourishing café culture where innovation in fermentation is being embraced for flavor complexity, health benefits, and visual appeal.

Rising consumer interest in K-beauty and wellness has positioned fermented coffee extracts as attractive bioactive ingredients in cosmetics and nutraceuticals, with 13.2% and 10.7% share respectively. The use of fermented coffee in food ingredients, contributing 17.4%, is also gaining momentum across confectionery and bakery applications, supported by its antioxidant properties and natural bitterness reduction.
  • South Korea's café culture has been instrumental in popularizing fermentation for flavor and function.
  • Fermented coffee extracts have been utilized in skincare and cosmetic formulations for anti-aging claims.
  • Functional beverage lines incorporating fermented coffee have been launched by local health drink brands.
  • Culinary innovation has enabled crossover into bakery, chocolate, and dairy-based products.

Competitive Landscape of Fermented Coffee Market

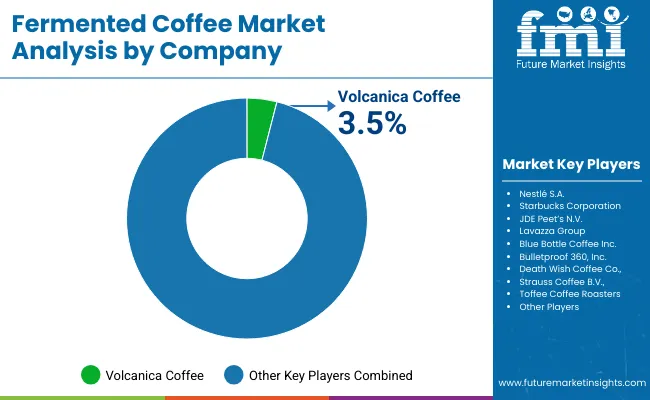
Fermented Coffee Market By Company

Company Global Value Share 2025
Volcanica Coffee 3. 5%
Others 96 .5%

The fermented coffee market has been characterized as moderately fragmented, with participation from multinational beverage giants, mid-sized specialty brands, and niche innovators competing across product formats and functional positioning. Global leaders such as Nestlé S.A., JDE Peet’s N.V., and Starbucks Corporation have maintained dominant positions, supported by vast distribution networks, diversified product portfolios, and early-stage investments in RTD and functional coffee innovations. Emphasis has been placed on incorporating probiotics, plant-based ingredients, and fermentation storytelling into mainstream offerings.

Mid-sized players such as Lavazza Group, Volcanica Coffee, and Blue Bottle Coffee Inc. have focused on artisanal fermentation techniques, café-led consumer education, and limited-edition specialty launches. These brands have gained traction through flavor differentiation, transparency in sourcing, and cross-collaborations with health and wellness startups.

Niche brands like Bulletproof 360, Death Wish Coffee Co., and Strauss Coffee B.V. have cultivated loyal followings by integrating fermented coffee into cognitive health, energy, and sports nutrition segments. Meanwhile, green coffee exporters such as Toffee Coffee Roasters are exploring fermentation at the origin level to enhance bean quality and value.

As consumer demand evolves, competitive advantage is expected to shift from single-product innovation to ecosystem-driven models that integrate health claims, sustainability narratives, and multi-format versatility.

Key Developments in Fermented Coffee Market

  • Volcanica Coffee has strategically positioned itself within the fermented coffee niche by offering fruit- and honey-assisted anaerobic fermented beans, including exotic microlots from Costa Rica and Ethiopia. Through this focus on co-fermentation, the brand is targeting high-end specialty coffee consumers seeking bold flavor differentiation. Its offerings demonstrate premium sensory profiles, traceability, and small-batch exclusivity fitting the demand for artisanal, process-driven fermented coffee.
  • Toffee Coffee Roasters has carved a competitive niche by offering fruit‑fermented Arabica beans (orange pulp co‑fermentation for 4‑5 days) in a convenient sachet / “easy brew” format. This product bridges artisanal fermentation techniques with mass‑consumer ease via pour‑over sachets, targeting customers seeking flavor novelty but low barrier to entry. Evidence of altitude (3,000 ft), washed + orange fermentation, medium roast, and citrus/orange tasting notes demonstrates traceability, terroir, and process transparency - key differentiators in the current fermented coffee market.

Scope of the Report

Item Value
Quantitative Units USD 330.6 million
Product Type Whole Beans, Ground Coffee, Instant Coffee, Ready-to-Drink (RTD) Coffee, Coffee Concentrates/Extracts
Source Arabica, Robusta, Liberica, Excelsa
Fermentation Method Yeast-Based Fermentation, Bacterial Fermentation, Fungal Fermentation, Combined/Hybrid Fermentation
Application Specialty Beverages (cafés, artisanal brewing), Functional Beverages, Nutraceuticals & Supplements, Personal Care & Cosmetics, Food Ingredients
Distribution Channel Online Retail, Specialty Coffee Shops, Supermarkets/Hypermarkets, Convenience Stores, Foodservice (cafés, restaurants, QSRs)
Regions Covered North America, Europe, Asia-Pacific, Latin America, Middle East & Africa
Country Covered United States, Canada, Germany, France, United Kingdom, China, Japan, India, Brazil, South Africa
Key Companies Profiled Nestlé S.A., Starbucks Corporation, JDE Peet’s N.V., Lavazza Group, Blue Bottle Coffee Inc., Bulletproof 360, Inc., Volacanica Coffee, Death Wish Coffee Co., Strauss Coffee B.V., and Toffee Coffee Roasters
Additional Attributes Market share by fermentation method and product format, adoption of co-fermentation and fruit-inoculated processing, growth in gut-health and functional beverages, rise of convenience formats (RTD, sachets), integration with beauty and personal care markets, sustainability-linked origin sourcing, regional trends in café culture and D2C health brands, and innovation in microbial processing and cold brew fermentation techniques.

Key Segments

By Source:

  • Arabica
  • Robusta
  • Liberica
  • Excelsa

By Fermentation Method:

  • Yeast-Based Fermentation
  • Bacterial Fermentation
  • Fungal Fermentation
  • Combined/Hybrid Fermentation

By Product Type:

  • Whole Beans
  • Ground Coffee
  • Instant Coffee
  • Ready-to-Drink (RTD) Coffee
  • Coffee Concentrates/Extracts

By Application:

  • Functional Beverages
  • Specialty Beverages
    • Cafés
    • Artisanal brewing
  • Nutraceuticals & Supplements
  • Personal Care & Cosmetics
  • Food Ingredients

By Distribution Channel:

  • Online Retail
  • Specialty Coffee Shops
  • Supermarkets/Hypermarkets
  • Convenience Stores
  • Foodservice

By Region:

  • North America
  • Latin America
  • Europe
  • East Asia
  • South Asia & Pacific
  • Middle East and Africa

Table of Content

  1. Executive Summary
    • Global Market Outlook
    • Demand-side Trends
    • Supply-side Trends
    • Technology Roadmap Analysis
    • Analysis and Recommendations
  2. Market Overview
    • Market Coverage / Taxonomy
    • Market Definition / Scope / Limitations
  3. Market Background
    • Market Dynamics
      • Drivers
      • Restraints
      • Opportunity
      • Trends
    • Scenario Forecast
      • Demand in Optimistic Scenario
      • Demand in Likely Scenario
      • Demand in Conservative Scenario
    • Opportunity Map Analysis
    • Product Life Cycle Analysis
    • Supply Chain Analysis
    • Investment Feasibility Matrix
    • Value Chain Analysis
    • PESTLE and Porter’s Analysis
    • Regulatory Landscape
    • Regional Parent Market Outlook
    • Production and Consumption Statistics
    • Import and Export Statistics
  4. Global Analysis 2020 to 2024 and Forecast, 2025 to 2035
    • Historical Market Size Value (USD Million) & Volume (MT) Analysis, 2020 to 2024
    • Current and Future Market Size Value (USD Million) & Volume (MT) Projections, 2025 to 2035
      • Y-o-Y Growth Trend Analysis
      • Absolute $ Opportunity Analysis
  5. Global Pricing Analysis 2020 to 2024 and Forecast 2025 to 2035
  6. Global Analysis 2020 to 2024 and Forecast 2025 to 2035, By Source
    • Introduction / Key Findings
    • Historical Market Size Value (USD Million) & Volume (MT) Analysis By Source, 2020 to 2024
    • Current and Future Market Size Value (USD Million) & Volume (MT) Analysis and Forecast By Source, 2025 to 2035
      • Arabica
      • Robusta
      • Liberica
      • Excelsa
    • Y-o-Y Growth Trend Analysis By Source, 2020 to 2024
    • Absolute $ Opportunity Analysis By Source, 2025 to 2035
  7. Global Analysis 2020 to 2024 and Forecast 2025 to 2035, By Fermentation Method
    • Introduction / Key Findings
    • Historical Market Size Value (USD Million) & Volume (MT) Analysis By Fermentation Method, 2020 to 2024
    • Current and Future Market Size Value (USD Million) & Volume (MT) Analysis and Forecast By Fermentation Method, 2025 to 2035
      • Yeast-Based Fermentation
      • Bacterial Fermentation
      • Fungal Fermentation
      • Combined/Hybrid Fermentation
    • Y-o-Y Growth Trend Analysis By Fermentation Method, 2020 to 2024
    • Absolute $ Opportunity Analysis By Fermentation Method, 2025 to 2035
  8. Global Analysis 2020 to 2024 and Forecast 2025 to 2035, By Product Type
    • Introduction / Key Findings
    • Historical Market Size Value (USD Million) & Volume (MT) Analysis By Product Type, 2020 to 2024
    • Current and Future Market Size Value (USD Million) & Volume (MT) Analysis and Forecast By Product Type, 2025 to 2035
      • Whole Beans
      • Ground Coffee
      • Instant Coffee
      • Ready-to-Drink (RTD) Coffee
      • Coffee Concentrates/Extracts
    • Y-o-Y Growth Trend Analysis By Product Type, 2020 to 2024
    • Absolute $ Opportunity Analysis By Product Type, 2025 to 2035
  9. Global Analysis 2020 to 2024 and Forecast 2025 to 2035, By Application
    • Introduction / Key Findings
    • Historical Market Size Value (USD Million) & Volume (MT) Analysis By Application, 2020 to 2024
    • Current and Future Market Size Value (USD Million) & Volume (MT) Analysis and Forecast By Application, 2025 to 2035
      • Functional Beverages
      • Specialty Beverages
        • Cafés
        • Artisanal brewing
      • Nutraceuticals & Supplements
      • Personal Care & Cosmetics
      • Food Ingredients
    • Y-o-Y Growth Trend Analysis By Application, 2020 to 2024
    • Absolute $ Opportunity Analysis By Application, 2025 to 2035
  10. Global Analysis 2020 to 2024 and Forecast 2025 to 2035, By Distribution Channel
    • Introduction / Key Findings
    • Historical Market Size Value (USD Million) & Volume (MT) Analysis By Distribution Channel, 2020 to 2024
    • Current and Future Market Size Value (USD Million) & Volume (MT) Analysis and Forecast By Distribution Channel, 2025 to 2035
      • Online Retail
      • Specialty Coffee Shops
      • Supermarkets/Hypermarkets
      • Convenience Stores
      • Foodservice
    • Y-o-Y Growth Trend Analysis By Distribution Channel, 2020 to 2024
    • Absolute $ Opportunity Analysis By Distribution Channel, 2025 to 2035
  11. Global Analysis 2020 to 2024 and Forecast 2025 to 2035, By Region
    • Introduction
    • Historical Market Size Value (USD Million) & Volume (MT) Analysis By Region, 2020 to 2024
    • Current Market Size Value (USD Million) & Volume (MT) Analysis and Forecast By Region, 2025 to 2035
      • North America
      • Latin America
      • Europe
      • East Asia
      • South Asia & Pacific
      • Middle East and Africa
    • Market Attractiveness Analysis By Region
  12. North America Analysis 2020 to 2024 and Forecast 2025 to 2035, By Country
    • Historical Market Size Value (USD Million) & Volume (MT) Trend Analysis By Market Taxonomy, 2020 to 2024
    • Market Size Value (USD Million) & Volume (MT) Forecast By Market Taxonomy, 2025 to 2035
      • By Country
        • U.S.
        • Canada
      • By Source
      • By Fermentation Method
      • By Product Type
      • By Application
      • By Distribution Channel
    • Market Attractiveness Analysis
      • By Country
      • By Source
      • By Fermentation Method
      • By Product Type
      • By Application
      • By Distribution Channel
    • Key Takeaways
  13. Latin America Analysis 2020 to 2024 and Forecast 2025 to 2035, By Country
    • Historical Market Size Value (USD Million) & Volume (MT) Trend Analysis By Market Taxonomy, 2020 to 2024
    • Market Size Value (USD Million) & Volume (MT) Forecast By Market Taxonomy, 2025 to 2035
      • By Country
        • Brazil
        • Mexico
        • Colombia
        • Rest of Latin America
      • By Source
      • By Fermentation Method
      • By Product Type
      • By Application
      • By Distribution Channel
    • Market Attractiveness Analysis
      • By Country
      • By Source
      • By Fermentation Method
      • By Product Type
      • By Application
      • By Distribution Channel
    • Key Takeaways
  14. Europe Analysis 2020 to 2024 and Forecast 2025 to 2035, By Country
    • Historical Market Size Value (USD Million) & Volume (MT) Trend Analysis By Market Taxonomy, 2020 to 2024
    • Market Size Value (USD Million) & Volume (MT) Forecast By Market Taxonomy, 2025 to 2035
      • By Country
        • Germany
        • U.K.
        • France
        • Italy
        • Spain
        • Belgium
        • Netherlands
        • Nordic
        • Switzerland
        • Russia
        • Poland
        • Rest of Europe
      • By Source
      • By Fermentation Method
      • By Product Type
      • By Application
      • By Distribution Channel
    • Market Attractiveness Analysis
      • By Country
      • By Source
      • By Fermentation Method
      • By Product Type
      • By Application
      • By Distribution Channel
    • Key Takeaways
  15. East Asia Analysis 2020 to 2024 and Forecast 2025 to 2035, By Country
    • Historical Market Size Value (USD Million) & Volume (MT) Trend Analysis By Market Taxonomy, 2020 to 2024
    • Market Size Value (USD Million) & Volume (MT) Forecast By Market Taxonomy, 2025 to 2035
      • By Country
        • China
        • Japan
        • South Korea
      • By Source
      • By Fermentation Method
      • By Product Type
      • By Application
      • By Distribution Channel
    • Market Attractiveness Analysis
      • By Country
      • By Source
      • By Fermentation Method
      • By Product Type
      • By Application
      • By Distribution Channel
    • Key Takeaways
  16. South Asia & Pacific Analysis 2020 to 2024 and Forecast 2025 to 2035, By Country
    • Historical Market Size Value (USD Million) & Volume (MT) Trend Analysis By Market Taxonomy, 2020 to 2024
    • Market Size Value (USD Million) & Volume (MT) Forecast By Market Taxonomy, 2025 to 2035
      • By Country
        • India
        • Thailand
        • Malaysia
        • Indonesia
        • Singapore
        • Vietnam
        • Australia
        • New Zealand
        • Rest of South Asia
      • By Source
      • By Fermentation Method
      • By Product Type
      • By Application
      • By Distribution Channel
    • Market Attractiveness Analysis
      • By Country
      • By Source
      • By Fermentation Method
      • By Product Type
      • By Application
      • By Distribution Channel
    • Key Takeaways
  17. Middle East and Africa Analysis 2020 to 2024 and Forecast 2025 to 2035, By Country
    • Historical Market Size Value (USD Million) & Volume (MT) Trend Analysis By Market Taxonomy, 2020 to 2024
    • Market Size Value (USD Million) & Volume (MT) Forecast By Market Taxonomy, 2025 to 2035
      • By Country
        • Turkey
        • UAE
        • Saudi Arabia
        • Israel
        • Other GCC Countries
        • North Africa
        • South Africa
      • By Source
      • By Fermentation Method
      • By Product Type
      • By Application
      • By Distribution Channel
    • Market Attractiveness Analysis
      • By Country
      • By Source
      • By Fermentation Method
      • By Product Type
      • By Application
      • By Distribution Channel
    • Key Takeaways
  18. Key Countries Analysis
    • U.S.
      • Pricing Analysis
      • Market Share Analysis, 2024
        • By Source
        • By Fermentation Method
        • By Product Type
        • By Application
        • By Distribution Channel
    • Canada
      • Pricing Analysis
      • Market Share Analysis, 2024
        • By Source
        • By Fermentation Method
        • By Product Type
        • By Application
        • By Distribution Channel
    • Mexico
      • Pricing Analysis
      • Market Share Analysis, 2024
        • By Source
        • By Fermentation Method
        • By Product Type
        • By Application
        • By Distribution Channel
    • Brazil
      • Pricing Analysis
      • Market Share Analysis, 2024
        • By Source
        • By Fermentation Method
        • By Product Type
        • By Application
        • By Distribution Channel
    • Chile
      • Pricing Analysis
      • Market Share Analysis, 2024
        • By Source
        • By Fermentation Method
        • By Product Type
        • By Application
        • By Distribution Channel
    • Germany
      • Pricing Analysis
      • Market Share Analysis, 2024
        • By Source
        • By Fermentation Method
        • By Product Type
        • By Application
        • By Distribution Channel
    • U.K.
      • Pricing Analysis
      • Market Share Analysis, 2024
        • By Source
        • By Fermentation Method
        • By Product Type
        • By Application
        • By Distribution Channel
    • Italy
      • Pricing Analysis
      • Market Share Analysis, 2024
        • By Source
        • By Fermentation Method
        • By Product Type
        • By Application
        • By Distribution Channel
    • Spain
      • Pricing Analysis
      • Market Share Analysis, 2024
        • By Source
        • By Fermentation Method
        • By Product Type
        • By Application
        • By Distribution Channel
    • France
      • Pricing Analysis
      • Market Share Analysis, 2024
        • By Source
        • By Fermentation Method
        • By Product Type
        • By Application
        • By Distribution Channel
    • India
      • Pricing Analysis
      • Market Share Analysis, 2024
        • By Source
        • By Fermentation Method
        • By Product Type
        • By Application
        • By Distribution Channel
    • ASEAN
      • Pricing Analysis
      • Market Share Analysis, 2024
        • By Source
        • By Fermentation Method
        • By Product Type
        • By Application
        • By Distribution Channel
    • Australia & New Zealand
      • Pricing Analysis
      • Market Share Analysis, 2024
        • By Source
        • By Fermentation Method
        • By Product Type
        • By Application
        • By Distribution Channel
    • China
      • Pricing Analysis
      • Market Share Analysis, 2024
        • By Source
        • By Fermentation Method
        • By Product Type
        • By Application
        • By Distribution Channel
    • Japan
      • Pricing Analysis
      • Market Share Analysis, 2024
        • By Source
        • By Fermentation Method
        • By Product Type
        • By Application
        • By Distribution Channel
    • South Korea
      • Pricing Analysis
      • Market Share Analysis, 2024
        • By Source
        • By Fermentation Method
        • By Product Type
        • By Application
        • By Distribution Channel
    • Russia
      • Pricing Analysis
      • Market Share Analysis, 2024
        • By Source
        • By Fermentation Method
        • By Product Type
        • By Application
        • By Distribution Channel
    • Poland
      • Pricing Analysis
      • Market Share Analysis, 2024
        • By Source
        • By Fermentation Method
        • By Product Type
        • By Application
        • By Distribution Channel
    • Hungary
      • Pricing Analysis
      • Market Share Analysis, 2024
        • By Source
        • By Fermentation Method
        • By Product Type
        • By Application
        • By Distribution Channel
    • Kingdom of Saudi Arabia
      • Pricing Analysis
      • Market Share Analysis, 2024
        • By Source
        • By Fermentation Method
        • By Product Type
        • By Application
        • By Distribution Channel
    • Turkiye
      • Pricing Analysis
      • Market Share Analysis, 2024
        • By Source
        • By Fermentation Method
        • By Product Type
        • By Application
        • By Distribution Channel
    • South Africa
      • Pricing Analysis
      • Market Share Analysis, 2024
        • By Source
        • By Fermentation Method
        • By Product Type
        • By Application
        • By Distribution Channel
  19. Market Structure Analysis
    • Competition Dashboard
    • Competition Benchmarking
    • Market Share Analysis of Top Players
      • By Regional
      • By Source
      • By Fermentation Method
      • By Product Type
      • By Application
      • By Distribution Channel
  20. Competition Analysis
    • Competition Deep Dive
      • Nestlé S.A.
        • Overview
        • Product Portfolio
        • Profitability by Market Segments (Product/Age /Sales Channel/Region)
        • Sales Footprint
        • Strategy Overview
      • JDE Peet’s N.V.
      • Starbucks Corporation
      • Lavazza Group
      • Volacanica Coffee
      • Blue Bottle Coffee Inc.
      • Bulletproof 360, Inc.
      • Death Wish Coffee Co.
      • Strauss Coffee B.V.
      • Toffee Coffee Roasters
    • Assumptions & Acronyms Used
    • Research Methodology

List of Tables

  • Table 1: Global Value (USD Million) Forecast by Region, 2020-2035
  • Table 2: Global Volume (MT) Forecast by Region, 2020-2035
  • Table 3: Global Value (USD Million) Forecast by Source, 2020-2035
  • Table 4: Global Volume (MT) Forecast by Source, 2020-2035
  • Table 5: Global Value (USD Million) Forecast by Fermentation Method, 2020-2035
  • Table 6: Global Volume (MT) Forecast by Fermentation Method, 2020-2035
  • Table 7: Global Value (USD Million) Forecast by Product Type, 2020-2035
  • Table 8: Global Volume (MT) Forecast by Product Type, 2020-2035
  • Table 9: Global Value (USD Million) Forecast by Application, 2020-2035
  • Table 10: Global Volume (MT) Forecast by Application, 2020-2035
  • Table 11: Global Value (USD Million) Forecast by Distribution Channel, 2020-2035
  • Table 12: Global Volume (MT) Forecast by Distribution Channel, 2020-2035
  • Table 13: North America Value (USD Million) Forecast by Country, 2020-2035
  • Table 14: North America Volume (MT) Forecast by Country, 2020-2035
  • Table 15: North America Value (USD Million) Forecast by Source, 2020-2035
  • Table 16: North America Volume (MT) Forecast by Source, 2020-2035
  • Table 17: North America Value (USD Million) Forecast by Fermentation Method, 2020-2035
  • Table 18: North America Volume (MT) Forecast by Fermentation Method, 2020-2035
  • Table 19: North America Value (USD Million) Forecast by Product Type, 2020-2035
  • Table 20: North America Volume (MT) Forecast by Product Type, 2020-2035
  • Table 21: North America Value (USD Million) Forecast by Application, 2020-2035
  • Table 22: North America Volume (MT) Forecast by Application, 2020-2035
  • Table 23: North America Value (USD Million) Forecast by Distribution Channel, 2020-2035
  • Table 24: North America Volume (MT) Forecast by Distribution Channel, 2020-2035
  • Table 25: Latin America Value (USD Million) Forecast by Country, 2020-2035
  • Table 26: Latin America Volume (MT) Forecast by Country, 2020-2035
  • Table 27: Latin America Value (USD Million) Forecast by Source, 2020-2035
  • Table 28: Latin America Volume (MT) Forecast by Source, 2020-2035
  • Table 29: Latin America Value (USD Million) Forecast by Fermentation Method, 2020-2035
  • Table 30: Latin America Volume (MT) Forecast by Fermentation Method, 2020-2035
  • Table 31: Latin America Value (USD Million) Forecast by Product Type, 2020-2035
  • Table 32: Latin America Volume (MT) Forecast by Product Type, 2020-2035
  • Table 33: Latin America Value (USD Million) Forecast by Application, 2020-2035
  • Table 34: Latin America Volume (MT) Forecast by Application, 2020-2035
  • Table 35: Latin America Value (USD Million) Forecast by Distribution Channel, 2020-2035
  • Table 36: Latin America Volume (MT) Forecast by Distribution Channel, 2020-2035
  • Table 37: Europe Value (USD Million) Forecast by Country, 2020-2035
  • Table 38: Europe Volume (MT) Forecast by Country, 2020-2035
  • Table 39: Europe Value (USD Million) Forecast by Source, 2020-2035
  • Table 40: Europe Volume (MT) Forecast by Source, 2020-2035
  • Table 41: Europe Value (USD Million) Forecast by Fermentation Method, 2020-2035
  • Table 42: Europe Volume (MT) Forecast by Fermentation Method, 2020-2035
  • Table 43: Europe Value (USD Million) Forecast by Product Type, 2020-2035
  • Table 44: Europe Volume (MT) Forecast by Product Type, 2020-2035
  • Table 45: Europe Value (USD Million) Forecast by Application, 2020-2035
  • Table 46: Europe Volume (MT) Forecast by Application, 2020-2035
  • Table 47: Europe Value (USD Million) Forecast by Distribution Channel, 2020-2035
  • Table 48: Europe Volume (MT) Forecast by Distribution Channel, 2020-2035
  • Table 49: East Asia Value (USD Million) Forecast by Country, 2020-2035
  • Table 50: East Asia Volume (MT) Forecast by Country, 2020-2035
  • Table 51: East Asia Value (USD Million) Forecast by Source, 2020-2035
  • Table 52: East Asia Volume (MT) Forecast by Source, 2020-2035
  • Table 53: East Asia Value (USD Million) Forecast by Fermentation Method, 2020-2035
  • Table 54: East Asia Volume (MT) Forecast by Fermentation Method, 2020-2035
  • Table 55: East Asia Value (USD Million) Forecast by Product Type, 2020-2035
  • Table 56: East Asia Volume (MT) Forecast by Product Type, 2020-2035
  • Table 57: East Asia Value (USD Million) Forecast by Application, 2020-2035
  • Table 58: East Asia Volume (MT) Forecast by Application, 2020-2035
  • Table 59: East Asia Value (USD Million) Forecast by Distribution Channel, 2020-2035
  • Table 60: East Asia Volume (MT) Forecast by Distribution Channel, 2020-2035
  • Table 61: South Asia & Pacific Value (USD Million) Forecast by Country, 2020-2035
  • Table 62: South Asia & Pacific Volume (MT) Forecast by Country, 2020-2035
  • Table 63: South Asia & Pacific Value (USD Million) Forecast by Source, 2020-2035
  • Table 64: South Asia & Pacific Volume (MT) Forecast by Source, 2020-2035
  • Table 65: South Asia & Pacific Value (USD Million) Forecast by Fermentation Method, 2020-2035
  • Table 66: South Asia & Pacific Volume (MT) Forecast by Fermentation Method, 2020-2035
  • Table 67: South Asia & Pacific Value (USD Million) Forecast by Product Type, 2020-2035
  • Table 68: South Asia & Pacific Volume (MT) Forecast by Product Type, 2020-2035
  • Table 69: South Asia & Pacific Value (USD Million) Forecast by Application, 2020-2035
  • Table 70: South Asia & Pacific Volume (MT) Forecast by Application, 2020-2035
  • Table 71: South Asia & Pacific Value (USD Million) Forecast by Distribution Channel, 2020-2035
  • Table 72: South Asia & Pacific Volume (MT) Forecast by Distribution Channel, 2020-2035
  • Table 73: Middle East and Africa Value (USD Million) Forecast by Country, 2020-2035
  • Table 74: Middle East and Africa Volume (MT) Forecast by Country, 2020-2035
  • Table 75: Middle East and Africa Value (USD Million) Forecast by Source, 2020-2035
  • Table 76: Middle East and Africa Volume (MT) Forecast by Source, 2020-2035
  • Table 77: Middle East and Africa Value (USD Million) Forecast by Fermentation Method, 2020-2035
  • Table 78: Middle East and Africa Volume (MT) Forecast by Fermentation Method, 2020-2035
  • Table 79: Middle East and Africa Value (USD Million) Forecast by Product Type, 2020-2035
  • Table 80: Middle East and Africa Volume (MT) Forecast by Product Type, 2020-2035
  • Table 81: Middle East and Africa Value (USD Million) Forecast by Application, 2020-2035
  • Table 82: Middle East and Africa Volume (MT) Forecast by Application, 2020-2035
  • Table 83: Middle East and Africa Value (USD Million) Forecast by Distribution Channel, 2020-2035
  • Table 84: Middle East and Africa Volume (MT) Forecast by Distribution Channel, 2020-2035

List of Figures

  • Figure 1: Global Volume (MT) Forecast 2020-2035
  • Figure 2: Global Pricing Analysis
  • Figure 3: Global Value (USD Million) Forecast 2020-2035
  • Figure 4: Global Value Share and BPS Analysis by Source, 2025 and 2035
  • Figure 5: Global Y-o-Y Growth Comparison by Source, 2025-2035
  • Figure 6: Global Attractiveness Analysis by Source
  • Figure 7: Global Value Share and BPS Analysis by Fermentation Method, 2025 and 2035
  • Figure 8: Global Y-o-Y Growth Comparison by Fermentation Method, 2025-2035
  • Figure 9: Global Attractiveness Analysis by Fermentation Method
  • Figure 10: Global Value Share and BPS Analysis by Product Type, 2025 and 2035
  • Figure 11: Global Y-o-Y Growth Comparison by Product Type, 2025-2035
  • Figure 12: Global Attractiveness Analysis by Product Type
  • Figure 13: Global Value Share and BPS Analysis by Application, 2025 and 2035
  • Figure 14: Global Y-o-Y Growth Comparison by Application, 2025-2035
  • Figure 15: Global Attractiveness Analysis by Application
  • Figure 16: Global Value Share and BPS Analysis by Distribution Channel, 2025 and 2035
  • Figure 17: Global Y-o-Y Growth Comparison by Distribution Channel, 2025-2035
  • Figure 18: Global Attractiveness Analysis by Distribution Channel
  • Figure 19: Global Value (USD Million) Share and BPS Analysis by Region, 2025 and 2035
  • Figure 20: Global Y-o-Y Growth Comparison by Region, 2025-2035
  • Figure 21: Global Attractiveness Analysis by Region
  • Figure 22: North America Incremental $ Opportunity, 2025-2035
  • Figure 23: Latin America Incremental $ Opportunity, 2025-2035
  • Figure 24: Europe Incremental $ Opportunity, 2025-2035
  • Figure 25: East Asia Incremental $ Opportunity, 2025-2035
  • Figure 26: South Asia & Pacific Incremental $ Opportunity, 2025-2035
  • Figure 27: Middle East and Africa Incremental $ Opportunity, 2025-2035
  • Figure 28: North America Value Share and BPS Analysis by Country, 2025 and 2035
  • Figure 29: North America Value Share and BPS Analysis by Source, 2025 and 2035
  • Figure 30: North America Y-o-Y Growth Comparison by Source, 2025-2035
  • Figure 31: North America Attractiveness Analysis by Source
  • Figure 32: North America Value Share and BPS Analysis by Fermentation Method, 2025 and 2035
  • Figure 33: North America Y-o-Y Growth Comparison by Fermentation Method, 2025-2035
  • Figure 34: North America Attractiveness Analysis by Fermentation Method
  • Figure 35: North America Value Share and BPS Analysis by Product Type, 2025 and 2035
  • Figure 36: North America Y-o-Y Growth Comparison by Product Type, 2025-2035
  • Figure 37: North America Attractiveness Analysis by Product Type
  • Figure 38: North America Value Share and BPS Analysis by Application, 2025 and 2035
  • Figure 39: North America Y-o-Y Growth Comparison by Application, 2025-2035
  • Figure 40: North America Attractiveness Analysis by Application
  • Figure 41: North America Value Share and BPS Analysis by Distribution Channel, 2025 and 2035
  • Figure 42: North America Y-o-Y Growth Comparison by Distribution Channel, 2025-2035
  • Figure 43: North America Attractiveness Analysis by Distribution Channel
  • Figure 44: Latin America Value Share and BPS Analysis by Country, 2025 and 2035
  • Figure 45: Latin America Value Share and BPS Analysis by Source, 2025 and 2035
  • Figure 46: Latin America Y-o-Y Growth Comparison by Source, 2025-2035
  • Figure 47: Latin America Attractiveness Analysis by Source
  • Figure 48: Latin America Value Share and BPS Analysis by Fermentation Method, 2025 and 2035
  • Figure 49: Latin America Y-o-Y Growth Comparison by Fermentation Method, 2025-2035
  • Figure 50: Latin America Attractiveness Analysis by Fermentation Method
  • Figure 51: Latin America Value Share and BPS Analysis by Product Type, 2025 and 2035
  • Figure 52: Latin America Y-o-Y Growth Comparison by Product Type, 2025-2035
  • Figure 53: Latin America Attractiveness Analysis by Product Type
  • Figure 54: Latin America Value Share and BPS Analysis by Application, 2025 and 2035
  • Figure 55: Latin America Y-o-Y Growth Comparison by Application, 2025-2035
  • Figure 56: Latin America Attractiveness Analysis by Application
  • Figure 57: Latin America Value Share and BPS Analysis by Distribution Channel, 2025 and 2035
  • Figure 58: Latin America Y-o-Y Growth Comparison by Distribution Channel, 2025-2035
  • Figure 59: Latin America Attractiveness Analysis by Distribution Channel
  • Figure 60: Europe Value Share and BPS Analysis by Country, 2025 and 2035
  • Figure 61: Europe Value Share and BPS Analysis by Source, 2025 and 2035
  • Figure 62: Europe Y-o-Y Growth Comparison by Source, 2025-2035
  • Figure 63: Europe Attractiveness Analysis by Source
  • Figure 64: Europe Value Share and BPS Analysis by Fermentation Method, 2025 and 2035
  • Figure 65: Europe Y-o-Y Growth Comparison by Fermentation Method, 2025-2035
  • Figure 66: Europe Attractiveness Analysis by Fermentation Method
  • Figure 67: Europe Value Share and BPS Analysis by Product Type, 2025 and 2035
  • Figure 68: Europe Y-o-Y Growth Comparison by Product Type, 2025-2035
  • Figure 69: Europe Attractiveness Analysis by Product Type
  • Figure 70: Europe Value Share and BPS Analysis by Application, 2025 and 2035
  • Figure 71: Europe Y-o-Y Growth Comparison by Application, 2025-2035
  • Figure 72: Europe Attractiveness Analysis by Application
  • Figure 73: Europe Value Share and BPS Analysis by Distribution Channel, 2025 and 2035
  • Figure 74: Europe Y-o-Y Growth Comparison by Distribution Channel, 2025-2035
  • Figure 75: Europe Attractiveness Analysis by Distribution Channel
  • Figure 76: East Asia Value Share and BPS Analysis by Country, 2025 and 2035
  • Figure 77: East Asia Value Share and BPS Analysis by Source, 2025 and 2035
  • Figure 78: East Asia Y-o-Y Growth Comparison by Source, 2025-2035
  • Figure 79: East Asia Attractiveness Analysis by Source
  • Figure 80: East Asia Value Share and BPS Analysis by Fermentation Method, 2025 and 2035
  • Figure 81: East Asia Y-o-Y Growth Comparison by Fermentation Method, 2025-2035
  • Figure 82: East Asia Attractiveness Analysis by Fermentation Method
  • Figure 83: East Asia Value Share and BPS Analysis by Product Type, 2025 and 2035
  • Figure 84: East Asia Y-o-Y Growth Comparison by Product Type, 2025-2035
  • Figure 85: East Asia Attractiveness Analysis by Product Type
  • Figure 86: East Asia Value Share and BPS Analysis by Application, 2025 and 2035
  • Figure 87: East Asia Y-o-Y Growth Comparison by Application, 2025-2035
  • Figure 88: East Asia Attractiveness Analysis by Application
  • Figure 89: East Asia Value Share and BPS Analysis by Distribution Channel, 2025 and 2035
  • Figure 90: East Asia Y-o-Y Growth Comparison by Distribution Channel, 2025-2035
  • Figure 91: East Asia Attractiveness Analysis by Distribution Channel
  • Figure 92: South Asia & Pacific Value Share and BPS Analysis by Country, 2025 and 2035
  • Figure 93: South Asia & Pacific Value Share and BPS Analysis by Source, 2025 and 2035
  • Figure 94: South Asia & Pacific Y-o-Y Growth Comparison by Source, 2025-2035
  • Figure 95: South Asia & Pacific Attractiveness Analysis by Source
  • Figure 96: South Asia & Pacific Value Share and BPS Analysis by Fermentation Method, 2025 and 2035
  • Figure 97: South Asia & Pacific Y-o-Y Growth Comparison by Fermentation Method, 2025-2035
  • Figure 98: South Asia & Pacific Attractiveness Analysis by Fermentation Method
  • Figure 99: South Asia & Pacific Value Share and BPS Analysis by Product Type, 2025 and 2035
  • Figure 100: South Asia & Pacific Y-o-Y Growth Comparison by Product Type, 2025-2035
  • Figure 101: South Asia & Pacific Attractiveness Analysis by Product Type
  • Figure 102: South Asia & Pacific Value Share and BPS Analysis by Application, 2025 and 2035
  • Figure 103: South Asia & Pacific Y-o-Y Growth Comparison by Application, 2025-2035
  • Figure 104: South Asia & Pacific Attractiveness Analysis by Application
  • Figure 105: South Asia & Pacific Value Share and BPS Analysis by Distribution Channel, 2025 and 2035
  • Figure 106: South Asia & Pacific Y-o-Y Growth Comparison by Distribution Channel, 2025-2035
  • Figure 107: South Asia & Pacific Attractiveness Analysis by Distribution Channel
  • Figure 108: Middle East and Africa Value Share and BPS Analysis by Country, 2025 and 2035
  • Figure 109: Middle East and Africa Value Share and BPS Analysis by Source, 2025 and 2035
  • Figure 110: Middle East and Africa Y-o-Y Growth Comparison by Source, 2025-2035
  • Figure 111: Middle East and Africa Attractiveness Analysis by Source
  • Figure 112: Middle East and Africa Value Share and BPS Analysis by Fermentation Method, 2025 and 2035
  • Figure 113: Middle East and Africa Y-o-Y Growth Comparison by Fermentation Method, 2025-2035
  • Figure 114: Middle East and Africa Attractiveness Analysis by Fermentation Method
  • Figure 115: Middle East and Africa Value Share and BPS Analysis by Product Type, 2025 and 2035
  • Figure 116: Middle East and Africa Y-o-Y Growth Comparison by Product Type, 2025-2035
  • Figure 117: Middle East and Africa Attractiveness Analysis by Product Type
  • Figure 118: Middle East and Africa Value Share and BPS Analysis by Application, 2025 and 2035
  • Figure 119: Middle East and Africa Y-o-Y Growth Comparison by Application, 2025-2035
  • Figure 120: Middle East and Africa Attractiveness Analysis by Application
  • Figure 121: Middle East and Africa Value Share and BPS Analysis by Distribution Channel, 2025 and 2035
  • Figure 122: Middle East and Africa Y-o-Y Growth Comparison by Distribution Channel, 2025-2035
  • Figure 123: Middle East and Africa Attractiveness Analysis by Distribution Channel
  • Figure 124: Global - Tier Structure Analysis
  • Figure 125: Global - Company Share Analysis

Frequently Asked Questions

How big is the Fermented Coffee Market in 2025?

The global Fermented Coffee is estimated to be valued at USD 330.6 million in 2025.

What will be the size of Fermented Coffee Market in 2035?

The market size for the Fermented Coffee is projected to reach USD 766.8 million by 2035.

How much will be the Fermented Coffee Market growth between 2025 and 2035?

The Fermented Coffee is expected to grow at an 8.8% CAGR between 2025 and 2035.

What are the key product types in the Fermented Coffee Market?

The key product types in the Fermented Coffee Market are Ready-to-Drink (RTD) Coffee, ground coffee, instant coffee, whole beans, and coffee concentrates/extracts.

Which product type segment to contribute significant share in the Fermented Coffee Market in 2025?

In terms of product type, the Ready-to-Drink (RTD) Coffee segment is expected to command the highest share at 28.4% of the Fermented Coffee Market in 2025.

Explore Similar Insights

Future Market Insights

Fermented Coffee Market

Chat With

MaRIA

Hi There, I am MaRIA, Your Market Research Intelligence Assistant. How may I help you?