Fermented Amino Acid Complex Market Size and Share Forecast Outlook 2025 to 2035

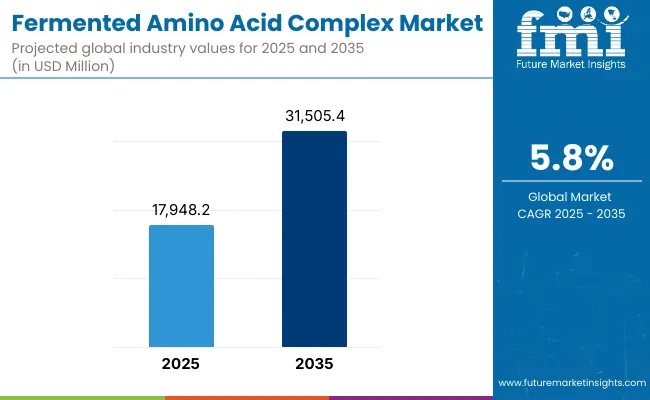
The Fermented Amino Acid Complex Market is expected to record a valuation of USD 17,948.2 million in 2025, rising to USD 31,505.4 million by 2035, reflecting a CAGR of 5.8% across the decade. Expansion during the first half of the forecast period (2025 to 2030) is expected to add approximately USD 5,502.7 million in market value, supported by the rising use of fermented amino acids in fortified foods, animal nutrition, and dietary supplements.
Quick Stats for Fermented Amino Acid Complex Market

  • Market Value (2025): USD 17,948.2 Million
  • Market Forecast Value (2035): USD 31,505.4 Million
  • Market Forecast CAGR (2025 to 2035): 5.8%
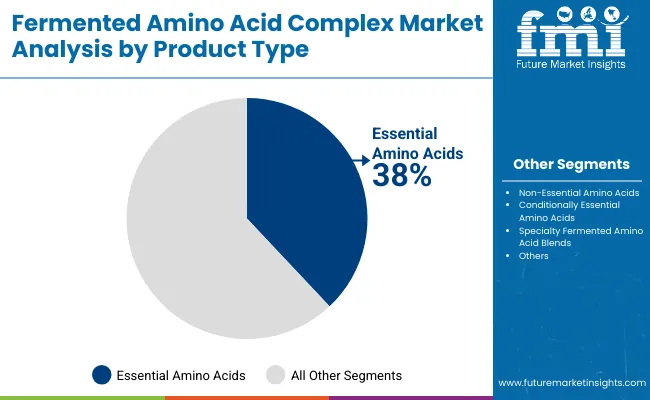
  • Leading Product Type in 2025: Essential Amino Acids (38% share)
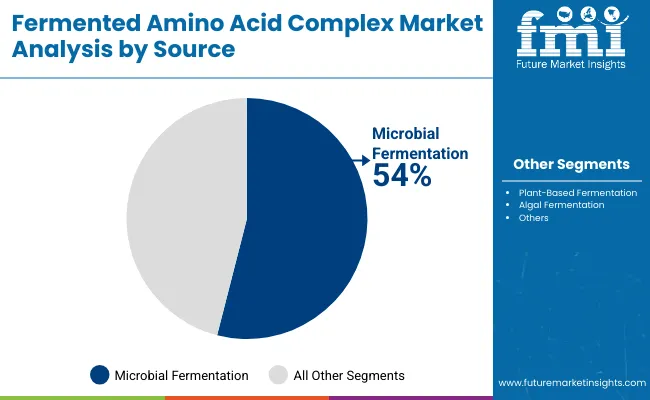
  • Leading Source in 2025: Microbial Fermentation (54% share)
  • Fastest-Growing Source: Algal Fermentation (8.5% CAGR)
  • Key Growth Applications: Dietary Supplements & Sports Nutrition (8.4% CAGR), Cosmetics & Personal Care (7.1% CAGR)
  • Top Key Players: Ajinomoto, Evonik Industries, CJ CheilJedang, ADM, Kyowa Hakko Bio, Novus International, Fufeng Group

Fermented Amino Acid Complex Market

Fermented Amino Acid Complex Market Key Takeaways

Metric Value
Fermented Amino Acid Complex Market Estimated Value In (2025 E ) USD 17,948.2 Million
Fermented Amino Acid Complex Market Forecast Value In (2035f) USD 31,505.4 Million
Forecast CAGR (2025 to 2035) 5.8%

This phase of growth will be driven by consistent demand from poultry, aquaculture, and swine feed industries, as well as expanding applications in sports nutrition and pharmaceuticals.Between 2030 and 2035, incremental gains of nearly USD 8,054.5 million are forecast, reflecting accelerating adoption of specialty fermented blends and conditionally essential amino acids in high-value nutraceutical and cosmetic applications.

This growth will also be influenced by technological improvements in microbial and algal fermentation, which enhance yield efficiency and reduce production costs, making amino acids more accessible for wider industrial applications.

In terms of product type, essential amino acids dominate with 38% share in 2025, supported by their indispensable role in food and feed formulations. Microbial fermentation remains the leading source with 54% share, while algal fermentation, though smaller in base, expands fastest at 8.5% CAGR.

Regional growth hotspots include India (9.2% CAGR) and China (8.4% CAGR), driven by robust nutraceutical demand and feed industry expansion. By 2035, the market is expected to be characterized by greater diversification, with functional blends gaining traction in dietary supplements and personal care formulations.

From 2020 to 2024, the Fermented Amino Acid Complex Market expanded steadily, supported by increasing use in animal nutrition and functional foods. In 2025, the market is projected at USD 17,948.2 Million, with essential amino acids anchoring demand.

By 2035, the market will reach USD 31,505.4 Million, driven by specialty fermented blends, the surge of sports nutrition, and personal care applications. Competitive advantage is shifting from bulk amino acid supply toward integrated fermentation capabilities, innovation in conditionally essential amino acids, and partnerships in nutraceutical and cosmetic formulations.

Why is the Fermented Amino Acid Complex Market growing?

Growth of the Fermented Amino Acid Complex Market is being driven by rising demand for nutritional fortification, sustainable sourcing, and functional health solutions. Advances in microbial and algal fermentation are enabling higher yields, reduced production costs, and diversification of amino acid profiles for food, pharmaceutical, and cosmetic applications.

Essential and conditionally essential amino acids are being increasingly utilized in fortified foods, intravenous therapeutics, and sports nutrition, supported by clinical evidence highlighting their benefits in muscle recovery, immunity, and metabolic health. The surge in animal feed requirements, particularly for poultry, aquaculture, and swine, has further reinforced adoption, as fermented amino acids ensure digestibility and feed efficiency.

In parallel, cosmetics and personal care industries are integrating amino acid complexes into anti-aging and skin health formulations. This combination of technological scalability, cross-sector utility, and consumer preference for clean-label and natural solutions ensures consistent expansion of the market across the forecast horizon.

Segmental Analysis

The Fermented Amino Acid Complex Market is segmented across product type, source, and application, each reflecting distinct adoption pathways and growth potential. Product type analysis highlights the dominant role of essential amino acids, which remain the cornerstone for food, feed, and healthcare formulations, while specialty fermented blends expand fastest.

Source segmentation emphasizes microbial fermentation as the largest category, supported by technological maturity, while algal fermentation is gaining traction for its sustainability and innovation-led applications. Application segmentation underscores the prominence of animal nutrition and dietary supplements, both of which are forecast to drive substantial incremental growth. Together, these segments reveal how advancements in fermentation technology, rising consumer awareness, and industrial scalability are shaping a market that is both broad-based and innovation-intensive.
Insights into the Product Type Segment with Essential Amino Acids Leading Market Share

Fermented Amino Acid Complex Market By Product Type

Essential amino acids dominate with 38% share in 2025, expanding at 6.1% CAGR, reflecting their indispensable role in food, feed, and supplement formulations. Their importance in poultry, swine, and aquaculture feed ensures consistent demand, while lysine, methionine, and threonine lead consumption within this category.

Non-essential amino acids contribute 22% share but grow more modestly, while conditionally essential amino acids gain relevance in medical nutrition and sports applications. Specialty fermented blends, although smaller at 16% share, expand fastest at 8.2% CAGR, highlighting their potential in premium nutraceuticals and cosmetics. Overall, essential amino acids anchor volume while specialty blends drive innovation.

Product Type Market Value Share, 2025
Essential Amino Acids 38%
Others 62%

Insights into the Source Segment with Microbial Fermentation Leading Market Share

Fermented Amino Acid Complex Market By Source

Microbial fermentation dominates with 54% share in 2025, reflecting its technological maturity and scalability in industrial amino acid production. This method supports cost-efficient output of lysine, glutamic acid, and threonine, ensuring widespread adoption across food, feed, and pharma industries. Growth is steady at 5.6% CAGR, underpinned by established infrastructure in Asia-Pacific and Europe.

Plant-based fermentation, with 28% share, is gaining traction as sustainable sourcing becomes more critical. Algal fermentation, though holding only 12% share in 2025, is forecast to grow fastest at 8.5% CAGR, supported by rising adoption in cosmetics, dietary supplements, and specialty food products. This shift highlights how sustainability and innovation are reshaping sourcing preferences beyond microbial dominance.

Source Market Value Share, 2025
Microbial Fermentation 54%
Others 46%

Insights into the Application Segment with Animal Nutrition Leading Market Share
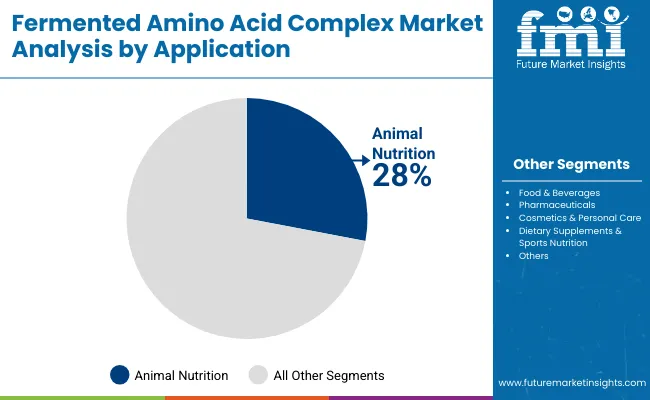
Fermented Amino Acid Complex Market By Application

Animal nutrition dominates with 28% share in 2025, growing at 5.1% CAGR, reflecting its central role in poultry, aquaculture, and swine feed formulations. Fermented amino acids are valued for their digestibility, efficiency, and ability to reduce reliance on antibiotics, making them critical in modern feed solutions.

Dietary supplements and sports nutrition, with 26% share, represent the fastest-growing segment at 8.4% CAGR, supported by consumer focus on muscle recovery, metabolic health, and performance. Pharmaceuticals contribute 14% share and expand steadily at 6.3% CAGR, supported by demand for IV nutrition and therapeutic formulations. Cosmetics and personal care applications, while smaller at 8% share, are growing at 7.1% CAGR, reflecting integration into skin health and anti-aging products.

Application Market Value Share, 2025
Animal Nutrition 28%
Others 72%

What are the Drivers, Restraints, and Key Trends of the Fermented Amino Acid Complex Market?

The Fermented Amino Acid Complex Market is influenced by growth drivers, regulatory and cost restraints, and evolving innovation trends. Together, these dynamics shape adoption pathways, competitive positioning, and the market’s transition from commodity supply to high-value, application-driven, and sustainability-aligned solutions.

Driver: Rising Demand from Dietary Supplements and Sports Nutrition

One of the strongest drivers for the Fermented Amino Acid Complex Market is the surging demand from the dietary supplements and sports nutrition sector, which is forecast to expand at a8.4% CAGR from 2025 to 2035. Consumers are increasingly prioritizing functional health, with amino acids recognized for their role in muscle recovery, energy metabolism, and immunity.

Conditioned by fitness trends, aging populations, and post-pandemic wellness awareness, demand for branched-chain amino acids (BCAAs) such as leucine, isoleucine, and valine has intensified. Fermentation technologies provide sustainable and consistent production of these amino acids, ensuring supply reliability compared to extraction from animal sources.

Specialty fermented blends are also gaining visibility, offering synergistic benefits in sports recovery, weight management, and cognitive health. The integration of fermented amino acids into ready-to-drink beverages, capsules, and functional foods is broadening accessibility across global retail channels.

As consumer preference for clean-label and plant-based supplements grows, fermentation-derived amino acids are positioned as superior alternatives, balancing efficacy with sustainability. This driver is expected to solidify the role of fermented amino acids as cornerstone ingredients within the broader nutraceutical ecosystem, enabling strong, long-term growth in high-value supplement categories.

Restraint: High Production Costs and Scalability Challenges

Despite strong growth potential, high production costs and scalability limitations remain significant restraints in the Fermented Amino Acid Complex Market. Fermentation processes, while sustainable and flexible, require intensive infrastructure investments, including bioreactors, microbial cultures, and downstream purification systems.

Operational expenses linked to sterilization, energy usage, and nutrient feedstock inputs further elevate costs. Although microbial fermentation is well established, production efficiency for certain amino acids, such as tryptophan and specialty blends, remains comparatively low, limiting large-scale adoption.

Algal fermentation, though promising as the fastest-growing source at 8.5% CAGR, also faces scalability challenges due to limited biorefinery infrastructure and higher cultivation costs. These cost constraints make price competitiveness difficult against chemically synthesized amino acids, particularly in feed and food applications where margins are thin.

Smaller producers and startups struggle with financial sustainability, while larger players manage to offset expenses through economies of scale. Without continuous innovation in strain engineering, process optimization, and renewable feedstock utilization, the cost gap may persist as a barrier to broader adoption.

While premium applications such as nutraceuticals and cosmetics absorb higher costs, mainstream food and feed industries may continue to face adoption hurdles, tempering the overall market expansion pace despite favorable demand dynamics.
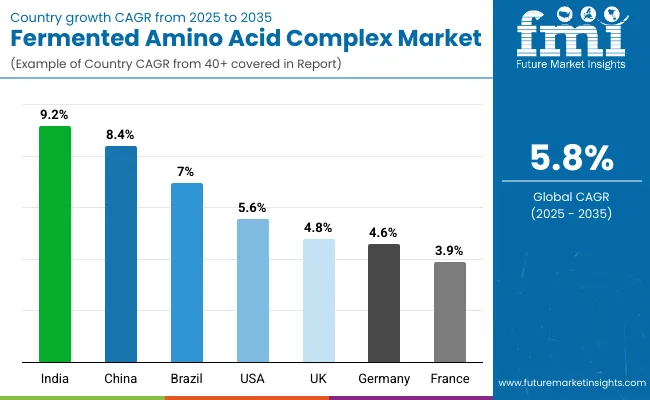
Analysis of Fermented Amino Acid Complex Market By Key Countries

Fermented Amino Acid Complex Market Country Wise Analysis

Country CAGR (2025 to 2035)
China 8.4%
India 9.2%
Germany 4.6%
France 3.9%
UK 4.8%
USA 5.6%
Brazil 7.0%

Adoption of fermented amino acid complexes is advancing at varying speeds globally, shaped by nutritional priorities, industrial modernization, and regulatory frameworks. In Asia-Pacific, rapid expansion is forecast, with India (9.2% CAGR) and China (8.4% CAGR) emerging as the most dynamic markets.

This growth reflects strong demand for animal feed, dietary supplements, and functional foods, supported by government policies encouraging sustainable protein sourcing and investment in fermentation infrastructure. By 2035, China’s share is projected to rise from 15% in 2025 to 19%, overtaking Europe in certain applications.

In North America, the United States leads with 22% share in 2025, though this is forecast to decline slightly to 20% by 2035 as Asia-Pacific accelerates adoption. Growth in the USA, at 5.6% CAGR, remains supported by high demand from sports nutrition and dietary supplement brands, alongside pharmaceutical integration of conditionally essential amino acids in therapeutics.

Europe reflects more modest growth, with Germany (4.6% CAGR) and France (3.9% CAGR) emphasizing regulatory compliance, sustainability mandates, and innovation in specialty fermented blends for cosmetics and personal care. The UK, at 4.8% CAGR, highlights balanced demand across food, pharmaceuticals, and supplements.

Emerging opportunities are visible in Latin America and the Middle East, with Brazil (7.0% CAGR) showing strong potential in animal feed applications, supported by its expanding livestock industry.

Sales Outlook for Fermented Amino Acid Complex in the United States

Year USA Fermented Amino Acid Complex Market (USD Million)
2025 3,948.6
2026 4,177.6
2027 4,409.1
2028 4,636.7
2029 4,868.0
2030 5,116.7
2031 5,395.6
2032 5,713.2
2033 6,061.9
2034 6,427.7
2035 6,809.0

A CAGR of 5.6% has been projected for the United States, reflecting consistent growth in a mature but innovation-driven market. Market share is expected to decline slightly from 22% in 2025 to 20% by 2035, as Asia-Pacific accelerates expansion. Adoption is being driven by dietary supplement brands and sports nutrition companies, where essential and conditionally essential amino acids are integrated into protein powders, capsules, and functional beverages.

Pharmaceutical applications in intravenous therapies and medical nutrition are also expanding steadily, supported by clinical validations of glutamine, arginine, and cysteine. High investments in microbial fermentation capacity ensure steady supply, while clean-label positioning and plant-based nutrition trends reinforce consumer preference for sustainable sourcing. Despite moderating global share, the USA will remain vital for premium innovation and commercialization of fermented amino acid complexes.

  • Dietary supplements and sports nutrition drive demand.
  • Essential and conditionally essential amino acids dominate usage.
  • Pharmaceutical applications expand through IV therapies.
  • USA retains leadership in innovation and commercialization.

Growth and Expansion Outlook for the Fermented Amino Acid Complex Market in the United Kingdom

A CAGR of 4.8% has been projected for the United Kingdom, indicating moderate but steady growth. Market share is forecast to decline from 5% in 2025 to 4% by 2035, as faster-growing Asian markets increase their global weight. Adoption is being shaped by food and beverage manufacturers, nutraceutical companies, and pharmaceutical firms integrating fermented amino acids into functional formulations.

Demand from cosmetics and personal care is also strengthening, particularly in anti-aging and skin health applications. While microbial fermentation remains the leading source, algal fermentation is gaining interest due to its alignment with sustainability and clean-label standards. Cloud-based digital platforms for tracking fermentation efficiency are emerging, supporting production optimization. The UK market will remain important for premium segments, innovation-led adoption, and strong consumer preference for natural and evidence-backed nutritional products.

  • Food, nutraceuticals, and pharmaceuticals anchor demand.
  • Cosmetics adoption grows in anti-aging and skin health.
  • Algal fermentation gains traction for sustainability.
  • Market importance tied to premium positioning and innovation.

Growth and Expansion Outlook for the Fermented Amino Acid Complex Market in Germany

A CAGR of 4.6% has been projected for Germany, reflecting modest expansion in a mature, compliance-driven European market. Market share is forecast to decline slightly from 7% in 2025 to 6% by 2035, as Asia-Pacific adoption strengthens. Demand is being shaped by pharmaceutical and healthcare applications, particularly intravenous nutrition and therapeutic formulations where glutamine and arginine are widely used.

Cosmetics and personal care represent another growing avenue, with fermented amino acid complexes gaining traction in anti-aging and skin repair solutions. Regulatory emphasis under the EU Green Deal ensures preference for microbial and algal fermentation, reinforcing sustainability in production. Germany is also a hub for specialty fermented blends that cater to high-value niches, although large-scale expansion is constrained by production costs and regulatory compliance measures.

  • Pharmaceuticals anchor demand with IV and therapeutic uses.
  • Cosmetics adoption rises in anti-aging and skin repair.
  • EU sustainability mandates drive microbial and algal sourcing.
  • Market share moderates as Asia-Pacific expands faster.

Growth and Expansion Outlook for the Fermented Amino Acid Complex Market in China

A CAGR of 8.4% has been projected for China, positioning it among the fastest-growing global markets. Market share is forecast to rise from 15% in 2025 to 19% by 2035, reflecting strong momentum across food, feed, and nutraceutical industries. Animal nutrition remains a key driver, supported by large-scale poultry and swine feed industries incorporating lysine, threonine, and methionine.

Rising consumer focus on wellness is expanding demand for dietary supplements, with BCAAs, glutamine, and specialty fermented blends becoming mainstream in sports and functional nutrition. Investment in microbial and plant-based fermentation facilities is scaling production, while algal fermentation is attracting interest for cosmetics and high-value nutraceuticals. Strong government support for sustainable protein alternatives is reinforcing adoption. By 2035, China is expected to be one of the largest producers and consumers of fermented amino acid complexes worldwide.

  • Market share grows from 15% to 19% by 2035.
  • Animal feed industries anchor large-scale adoption.
  • Dietary supplements drive consumer-focused expansion.
  • Government incentives strengthen sustainable production.

Growth and Expansion Outlook for the Fermented Amino Acid Complex Market in India

A CAGR of 9.2% has been projected for India, making it the fastest-growing market globally. Market share is expected to expand from 9% in 2025 to 12% by 2035, supported by surging demand across animal nutrition, dietary supplements, and functional foods. Poultry, aquaculture, and swine feed industries are anchoring large-scale adoption of lysine, methionine, and threonine.

Rising disposable incomes and health awareness are accelerating uptake in nutraceuticals and sports nutrition, where fermentation-derived amino acids are integrated into powders, capsules, and functional beverages. Pharmaceutical applications, particularly glutamine and arginine in therapeutics, are also expanding. Strong policy support for sustainable protein alternatives and rapid scaling of fermentation facilities are reinforcing growth. India is expected to emerge as a hub for both production and consumption, with competitive advantages in scalability and cost efficiency.
  • Fastest growth globally at 9.2% CAGR.
  • Animal feed remains the backbone of adoption.
  • Nutraceutical and sports nutrition drive high-value growth.
  • Strong government support boosts sustainable sourcing.

Growth and Expansion Outlook for the Fermented Amino Acid Complex Market in Japan

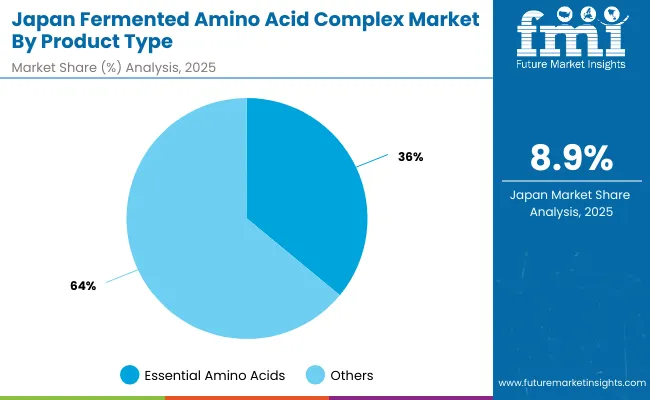
Japan Fermented Amino Acid Complex Market By Product Type

A CAGR of 8.9% has been projected for Japan, reflecting innovation-driven adoption in food, supplements, and cosmetics. Essential amino acids dominate with 36% share in 2025, while specialty fermented blends, at 23% share, are expanding fastest at 8.9% CAGR, supported by demand for premium nutraceutical and personal care products.

Pharmaceuticals and intravenous nutrition strengthen adoption of conditionally essential amino acids, while cosmetics integrate amino acid complexes into anti-aging and skin health formulations. Regulatory focus on sustainability ensures steady investment in microbial and algal fermentation. Japan is expected to retain its status as a premium market, shaped by innovation, consumer trust, and diversification into specialty applications.

  • Essential amino acids anchor market leadership.
  • Specialty blends expand fastest at 8.9% CAGR.
  • Pharmaceuticals and cosmetics diversify demand.
  • Japan retains premium innovation-led positioning.
Product Type Market Value Share, 2025
Essential Amino Acids 36%
Others 64%

Growth and Expansion Outlook for the Fermented Amino Acid Complex Market in South Korea

South Korea Fermented Amino Acid Complex Market By Source

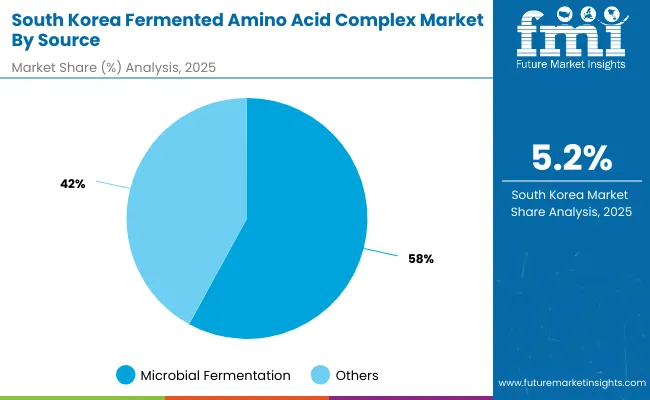
A CAGR of 5.2% has been projected for South Korea, reflecting balanced yet sustainability-focused growth. Microbial fermentation dominates with 58% share in 2025, supported by strong industrial capacity for lysine, glutamic acid, and threonine production.

However, plant-based fermentation, holding 25% share, is forecast to grow faster at 8.0% CAGR, driven by consumer preference for sustainable protein ingredients in food, nutraceuticals, and cosmetics. Algal fermentation, though smaller at 11% share, represents the fastest-growing category at 8.6% CAGR, highlighting its role in high-value dietary supplements and personal care formulations.

Adoption is also being reinforced by South Korea’s advanced cosmetic industry, where amino acid complexes are increasingly integrated into skin health and anti-aging formulations. Government policies supporting biomanufacturing and clean-label food standards further strengthen long-term adoption.

  • Microbial fermentation anchors industrial capacity.
  • Plant-based fermentation expands at 8.0% CAGR.
  • Algal fermentation grows fastest at 8.6% CAGR.
  • Cosmetics industry accelerates amino acid adoption.
Source Market Value Share, 2025
Microbial Fermentation 58%
Others 42%

Competitive Landscape of Fermented Amino Acid Complex Market

The Fermented Amino Acid Complex Market is characterized by a mix of global leaders, regional producers, and specialized innovators. Established companies such as Ajinomoto Co., Inc., Evonik Industries AG, CJ CheilJedang, Archer Daniels Midland (ADM), and Kyowa Hakko Bio Co., Ltd. dominate the industry through their extensive fermentation capacities, diversified amino acid portfolios, and global distribution networks. Collectively, these players account for a substantial portion of worldwide supply, ensuring consistency in essential amino acid production for food, feed, and pharmaceutical applications.

Regional producers, particularly in Asia-Pacific, such as Fufeng Group and Meihua Holdings, play an important role in supporting the feed industry with bulk fermentation-derived lysine and threonine. Meanwhile, European firms are strengthening competitiveness through innovation in specialty fermented blends targeted at nutraceutical and cosmetic formulations. Niche players and startups are increasingly focusing on algal fermentation, tapping into high-value opportunities in dietary supplements, sports nutrition, and personal care.

The competitive edge is shifting from bulk commodity supply toward high-value specialty solutions, sustainability, and innovation in conditionally essential amino acids. Companies that integrate advanced fermentation technologies, align with clean-label consumer preferences, and develop synergistic partnerships across nutraceutical and cosmetic sectors are expected to gain long-term strategic advantage.

Key Developments in Fermented Amino Acid Complex Market

  • March 2025 - Ajinomoto announced the expansion of its microbial fermentation facility in Japan to increase production of essential amino acids for food and feed industries. The investment supports sustainable sourcing, strengthens supply reliability, and positions the company as a global leader in advanced fermentation capacity.
  • July 2025 - Evonik Industries introduced a new specialty fermented amino acid blend designed for dietary supplements and sports nutrition. The launch leverages algal fermentation technology, delivering high-purity formulations aimed at improving muscle recovery, metabolic health, and premium clean-label positioning across nutraceutical and personal care markets.

Scope of the Report

Item Value
Market Size, 2025 USD 17,948.2 Million
Market Size, 2035 USD 31,505.4 Million
Absolute Growth (2025 to 2035) USD 13,557.2 Million
CAGR (2025 to 2035) 5.80%
Value Added 2025 to 2030 USD 5,502.7 Million
Value Added 2030 to 2035 USD 8,054.5 Million
Product Type (2025) Essential Amino Acids: 38% (USD 6,820.3 Million); Others: 62%
Source (2025) Microbial Fermentation: 54% (USD 9,696.0 Million); Others: 46%
Application (2025) Animal Nutrition: 28% (USD 5,025.5 Million); Others: 72%
Form (2025) Powder dominates with 52% share
Key Growth Applications (CAGR) Dietary Supplements & Sports Nutrition 8.4%; Cosmetics & Personal Care 7.1%
Growth Hotspots (CAGR) India 9.2%; China 8.4%; South Asia & Pacific 8.2%; East Asia 7.0%
Regions Covered North America, Latin America, Europe, East Asia, South Asia & Pacific, Middle East & Africa
Countries Covered United States, United Kingdom, Germany, France, China, India, Japan, South Korea, Brazil
Key Companies Profiled Ajinomoto, Evonik Industries, CJ CheilJedang , ADM, Kyowa Hakko Bio, Novus International, Fufeng Group, Meihua Holdings
Additional Attributes Sustainability in fermentation, algal fermentation scale-up, specialty blends for nutraceuticals, and cosmetic applications are shaping market expansion.

Key Segments

By Product Type:

  • Essential Amino Acids
  • Non-Essential Amino Acids
  • Conditionally Essential Amino Acids
  • Specialty Fermented Amino Acid Blends
  • Others

By Source:

  • Plant-Based Fermentation
  • Microbial Fermentation
  • Algal Fermentation
  • Others

By Form:

  • Powder
  • Liquid
  • Granules
  • Capsules/Tablets

By Application:

  • Food & Beverages
  • Animal Nutrition
  • Pharmaceuticals
  • Cosmetics & Personal Care
  • Dietary Supplements & Sports Nutrition
  • Others

By End User:

  • Food & Beverage Manufacturers
  • Pharmaceutical & Healthcare Companies
  • Animal Feed Manufacturers
  • Cosmetic & Personal Care Companies
  • Dietary Supplement Brands
  • Research & Academic Institutes

By Region:

  • North America
  • Latin America
  • Europe
  • East Asia
  • South Asia & Pacific
  • Middle East & Africa

Table of Content

  1. Executive Summary
    • Global Market Outlook
    • Demand-side Trends
    • Supply-side Trends
    • Technology Roadmap Analysis
    • Analysis and Recommendations
  2. Market Overview
    • Market Coverage / Taxonomy
    • Market Definition / Scope / Limitations
  3. Market Background
    • Market Dynamics
      • Drivers
      • Restraints
      • Opportunity
      • Trends
    • Scenario Forecast
      • Demand in Optimistic Scenario
      • Demand in Likely Scenario
      • Demand in Conservative Scenario
    • Opportunity Map Analysis
    • Product Life Cycle Analysis
    • Supply Chain Analysis
    • Investment Feasibility Matrix
    • Value Chain Analysis
    • PESTLE and Porter’s Analysis
    • Regulatory Landscape
    • Regional Parent Market Outlook
    • Production and Consumption Statistics
    • Import and Export Statistics
  4. Global Market Analysis 2020 to 2024 and Forecast, 2025 to 2035
    • Historical Market Size Value (USD Million) & Volume (MT) Analysis, 2020 to 2024
    • Current and Future Market Size Value (USD Million) & Volume (MT) Projections, 2025 to 2035
      • Y-o-Y Growth Trend Analysis
      • Absolute $ Opportunity Analysis
  5. Global Market Pricing Analysis 2020 to 2024 and Forecast 2025 to 2035
  6. Global Market Analysis 2020 to 2024 and Forecast 2025 to 2035, By Product Type
    • Introduction / Key Findings
    • Historical Market Size Value (USD Million) & Volume (MT) Analysis By Product Type, 2020 to 2024
    • Current and Future Market Size Value (USD Million) & Volume (MT) Analysis and Forecast By Product Type, 2025 to 2035
      • Essential Amino Acids
      • Non-Essential Amino Acids
      • Conditionally Essential Amino Acids
      • Specialty Fermented Amino Acid Blends
      • Others
    • Y-o-Y Growth Trend Analysis By Product Type, 2020 to 2024
    • Absolute $ Opportunity Analysis By Product Type, 2025 to 2035
  7. Global Market Analysis 2020 to 2024 and Forecast 2025 to 2035, By Source
    • Introduction / Key Findings
    • Historical Market Size Value (USD Million) & Volume (MT) Analysis By Source, 2020 to 2024
    • Current and Future Market Size Value (USD Million) & Volume (MT) Analysis and Forecast By Source, 2025 to 2035
      • Plant-Based Fermentation
      • Microbial Fermentation
      • Algal Fermentation
      • Others
    • Y-o-Y Growth Trend Analysis By Source, 2020 to 2024
    • Absolute $ Opportunity Analysis By Source, 2025 to 2035
  8. Global Market Analysis 2020 to 2024 and Forecast 2025 to 2035, By Form
    • Introduction / Key Findings
    • Historical Market Size Value (USD Million) & Volume (MT) Analysis By Form, 2020 to 2024
    • Current and Future Market Size Value (USD Million) & Volume (MT) Analysis and Forecast By Form, 2025 to 2035
      • Powder
      • Liquid
      • Granules
      • Capsules/Tablets
    • Y-o-Y Growth Trend Analysis By Form, 2020 to 2024
    • Absolute $ Opportunity Analysis By Form, 2025 to 2035
  9. Global Market Analysis 2020 to 2024 and Forecast 2025 to 2035, By Application
    • Introduction / Key Findings
    • Historical Market Size Value (USD Million) & Volume (MT) Analysis By Application, 2020 to 2024
    • Current and Future Market Size Value (USD Million) & Volume (MT) Analysis and Forecast By Application, 2025 to 2035
      • Food & Beverages
      • Animal Nutrition
      • Pharmaceuticals
      • Cosmetics & Personal Care
      • Dietary Supplements & Sports Nutrition
      • Others
    • Y-o-Y Growth Trend Analysis By Application, 2020 to 2024
    • Absolute $ Opportunity Analysis By Application, 2025 to 2035
  10. Global Market Analysis 2020 to 2024 and Forecast 2025 to 2035, By End User
    • Introduction / Key Findings
    • Historical Market Size Value (USD Million) & Volume (MT) Analysis By End User, 2020 to 2024
    • Current and Future Market Size Value (USD Million) & Volume (MT) Analysis and Forecast By End User, 2025 to 2035
      • Food & Beverage Manufacturers
      • Pharmaceutical & Healthcare Companies
      • Animal Feed Manufacturers
      • Cosmetic & Personal Care Companies
      • Dietary Supplement Brands
      • Research & Academic Institutes
    • Y-o-Y Growth Trend Analysis By End User, 2020 to 2024
    • Absolute $ Opportunity Analysis By End User, 2025 to 2035
  11. Global Market Analysis 2020 to 2024 and Forecast 2025 to 2035, By Region
    • Introduction
    • Historical Market Size Value (USD Million) & Volume (MT) Analysis By Region, 2020 to 2024
    • Current Market Size Value (USD Million) & Volume (MT) Analysis and Forecast By Region, 2025 to 2035
      • North America
      • Latin America
      • Europe
      • East Asia
      • South Asia & Pacific
      • Middle East & Africa
    • Market Attractiveness Analysis By Region
  12. North America Market Analysis 2020 to 2024 and Forecast 2025 to 2035, By Country
    • Historical Market Size Value (USD Million) & Volume (MT) Trend Analysis By Market Taxonomy, 2020 to 2024
    • Market Size Value (USD Million) & Volume (MT) Forecast By Market Taxonomy, 2025 to 2035
      • By Country
        • USA
        • Canada
      • By Product Type
      • By Source
      • By Form
      • By Application
      • By End User
    • Market Attractiveness Analysis
      • By Country
      • By Product Type
      • By Source
      • By Form
      • By Application
      • By End User
    • Key Takeaways
  13. Latin America Market Analysis 2020 to 2024 and Forecast 2025 to 2035, By Country
    • Historical Market Size Value (USD Million) & Volume (MT) Trend Analysis By Market Taxonomy, 2020 to 2024
    • Market Size Value (USD Million) & Volume (MT) Forecast By Market Taxonomy, 2025 to 2035
      • By Country
        • Brazil
        • Mexico
        • Colombia
        • Rest of Latin America
      • By Product Type
      • By Source
      • By Form
      • By Application
      • By End User
    • Market Attractiveness Analysis
      • By Country
      • By Product Type
      • By Source
      • By Form
      • By Application
      • By End User
    • Key Takeaways
  14. Europe Market Analysis 2020 to 2024 and Forecast 2025 to 2035, By Country
    • Historical Market Size Value (USD Million) & Volume (MT) Trend Analysis By Market Taxonomy, 2020 to 2024
    • Market Size Value (USD Million) & Volume (MT) Forecast By Market Taxonomy, 2025 to 2035
      • By Country
        • Germany
        • UK
        • France
        • Italy
        • Spain
        • Belgium
        • Netherlands
        • Nordic
        • Russia
        • Poland
        • Switzerland
        • Rest of Europe
      • By Product Type
      • By Source
      • By Form
      • By Application
      • By End User
    • Market Attractiveness Analysis
      • By Country
      • By Product Type
      • By Source
      • By Form
      • By Application
      • By End User
    • Key Takeaways
  15. East Asia Market Analysis 2020 to 2024 and Forecast 2025 to 2035, By Country
    • Historical Market Size Value (USD Million) & Volume (MT) Trend Analysis By Market Taxonomy, 2020 to 2024
    • Market Size Value (USD Million) & Volume (MT) Forecast By Market Taxonomy, 2025 to 2035
      • By Country
        • China
        • Japan
        • South Korea
      • By Product Type
      • By Source
      • By Form
      • By Application
      • By End User
    • Market Attractiveness Analysis
      • By Country
      • By Product Type
      • By Source
      • By Form
      • By Application
      • By End User
    • Key Takeaways
  16. South Asia & Pacific Market Analysis 2020 to 2024 and Forecast 2025 to 2035, By Country
    • Historical Market Size Value (USD Million) & Volume (MT) Trend Analysis By Market Taxonomy, 2020 to 2024
    • Market Size Value (USD Million) & Volume (MT) Forecast By Market Taxonomy, 2025 to 2035
      • By Country
        • India
        • Thailand
        • Malaysia
        • Indonesia
        • Singapore
        • Vietnam
        • Australia
        • New Zealand
        • Rest of South Asia & Pacific
      • By Product Type
      • By Source
      • By Form
      • By Application
      • By End User
    • Market Attractiveness Analysis
      • By Country
      • By Product Type
      • By Source
      • By Form
      • By Application
      • By End User
    • Key Takeaways
  17. Middle East & Africa Market Analysis 2020 to 2024 and Forecast 2025 to 2035, By Country
    • Historical Market Size Value (USD Million) & Volume (MT) Trend Analysis By Market Taxonomy, 2020 to 2024
    • Market Size Value (USD Million) & Volume (MT) Forecast By Market Taxonomy, 2025 to 2035
      • By Country
        • Turkey
        • UAE
        • Saudi Arabia
        • Israel
        • Other GCC Countries
        • North Africa
        • South Africa
        • Central Africa
      • By Product Type
      • By Source
      • By Form
      • By Application
      • By End User
    • Market Attractiveness Analysis
      • By Country
      • By Product Type
      • By Source
      • By Form
      • By Application
      • By End User
    • Key Takeaways
  18. Key Countries Market Analysis
    • USA
      • Pricing Analysis
      • Market Share Analysis, 2024
        • By Product Type
        • By Source
        • By Form
        • By Application
        • By End User
    • Canada
      • Pricing Analysis
      • Market Share Analysis, 2024
        • By Product Type
        • By Source
        • By Form
        • By Application
        • By End User
    • Brazil
      • Pricing Analysis
      • Market Share Analysis, 2024
        • By Product Type
        • By Source
        • By Form
        • By Application
        • By End User
    • Mexico
      • Pricing Analysis
      • Market Share Analysis, 2024
        • By Product Type
        • By Source
        • By Form
        • By Application
        • By End User
    • Columbia
      • Pricing Analysis
      • Market Share Analysis, 2024
        • By Product Type
        • By Source
        • By Form
        • By Application
        • By End User
    • Germany
      • Pricing Analysis
      • Market Share Analysis, 2024
        • By Product Type
        • By Source
        • By Form
        • By Application
        • By End User
    • UK
      • Pricing Analysis
      • Market Share Analysis, 2024
        • By Product Type
        • By Source
        • By Form
        • By Application
        • By End User
    • France
      • Pricing Analysis
      • Market Share Analysis, 2024
        • By Product Type
        • By Source
        • By Form
        • By Application
        • By End User
    • Italy
      • Pricing Analysis
      • Market Share Analysis, 2024
        • By Product Type
        • By Source
        • By Form
        • By Application
        • By End User
    • Spain
      • Pricing Analysis
      • Market Share Analysis, 2024
        • By Product Type
        • By Source
        • By Form
        • By Application
        • By End User
    • Belgium
      • Pricing Analysis
      • Market Share Analysis, 2024
        • By Product Type
        • By Source
        • By Form
        • By Application
        • By End User
    • Netherlands
      • Pricing Analysis
      • Market Share Analysis, 2024
        • By Product Type
        • By Source
        • By Form
        • By Application
        • By End User
    • Nordic
      • Pricing Analysis
      • Market Share Analysis, 2024
        • By Product Type
        • By Source
        • By Form
        • By Application
        • By End User
    • Russia
      • Pricing Analysis
      • Market Share Analysis, 2024
        • By Product Type
        • By Source
        • By Form
        • By Application
        • By End User
    • Poland
      • Pricing Analysis
      • Market Share Analysis, 2024
        • By Product Type
        • By Source
        • By Form
        • By Application
        • By End User
    • Switzerland
      • Pricing Analysis
      • Market Share Analysis, 2024
        • By Product Type
        • By Source
        • By Form
        • By Application
        • By End User
    • China
      • Pricing Analysis
      • Market Share Analysis, 2024
        • By Product Type
        • By Source
        • By Form
        • By Application
        • By End User
    • Japan
      • Pricing Analysis
      • Market Share Analysis, 2024
        • By Product Type
        • By Source
        • By Form
        • By Application
        • By End User
    • South Korea
      • Pricing Analysis
      • Market Share Analysis, 2024
        • By Product Type
        • By Source
        • By Form
        • By Application
        • By End User
    • India
      • Pricing Analysis
      • Market Share Analysis, 2024
        • By Product Type
        • By Source
        • By Form
        • By Application
        • By End User
    • Thailand
      • Pricing Analysis
      • Market Share Analysis, 2024
        • By Product Type
        • By Source
        • By Form
        • By Application
        • By End User
    • Malaysia
      • Pricing Analysis
      • Market Share Analysis, 2024
        • By Product Type
        • By Source
        • By Form
        • By Application
        • By End User
    • Indonesia
      • Pricing Analysis
      • Market Share Analysis, 2024
        • By Product Type
        • By Source
        • By Form
        • By Application
        • By End User
    • Singapore
      • Pricing Analysis
      • Market Share Analysis, 2024
        • By Product Type
        • By Source
        • By Form
        • By Application
        • By End User
    • Vietnam
      • Pricing Analysis
      • Market Share Analysis, 2024
        • By Product Type
        • By Source
        • By Form
        • By Application
        • By End User
    • Australia
      • Pricing Analysis
      • Market Share Analysis, 2024
        • By Product Type
        • By Source
        • By Form
        • By Application
        • By End User
    • New Zealand
      • Pricing Analysis
      • Market Share Analysis, 2024
        • By Product Type
        • By Source
        • By Form
        • By Application
        • By End User
    • Turkey
      • Pricing Analysis
      • Market Share Analysis, 2024
        • By Product Type
        • By Source
        • By Form
        • By Application
        • By End User
    • UAE
      • Pricing Analysis
      • Market Share Analysis, 2024
        • By Product Type
        • By Source
        • By Form
        • By Application
        • By End User
    • Saudi Arabia
      • Pricing Analysis
      • Market Share Analysis, 2024
        • By Product Type
        • By Source
        • By Form
        • By Application
        • By End User
  19. Market Structure Analysis
    • Competition Dashboard
    • Competition Benchmarking
    • Market Share Analysis of Top Players
      • By Regional
      • By Product Type
      • By Source
      • By Form
      • By Application
      • By End User
  20. Competition Analysis
    • Competition Deep Dive
      • Ajinomoto
        • Overview
        • Product Portfolio
        • Profitability by Market Segments (Product/Age /Sales Channel/Region)
        • Sales Footprint
        • Strategy Overview
        • Evonik Industries
        • CJ CheilJedang
        • ADM
        • Kyowa Hakko Bio
        • Novus International
        • Fufeng Group
        • Meihua Holdings
    • Assumptions & Acronyms Used
    • Research Methodology

List of Tables

  • Table 1: Global Market Value (USD Million) Forecast by Region, 2020-2035
  • Table 2: Global Market Volume (MT) Forecast by Region, 2020-2035
  • Table 3: Global Market Value (USD Million) Forecast by Product Type, 2020-2035
  • Table 4: Global Market Volume (MT) Forecast by Product Type, 2020-2035
  • Table 5: Global Market Value (USD Million) Forecast by Source, 2020-2035
  • Table 6: Global Market Volume (MT) Forecast by Source, 2020-2035
  • Table 7: Global Market Value (USD Million) Forecast by Form, 2020-2035
  • Table 8: Global Market Volume (MT) Forecast by Form, 2020-2035
  • Table 9: Global Market Value (USD Million) Forecast by Application, 2020-2035
  • Table 10: Global Market Volume (MT) Forecast by Application, 2020-2035
  • Table 11: Global Market Value (USD Million) Forecast by End User, 2020-2035
  • Table 12: Global Market Volume (MT) Forecast by End User, 2020-2035
  • Table 13: North America Market Value (USD Million) Forecast by Country, 2020-2035
  • Table 14: North America Market Volume (MT) Forecast by Country, 2020-2035
  • Table 15: North America Market Value (USD Million) Forecast by Product Type, 2020-2035
  • Table 16: North America Market Volume (MT) Forecast by Product Type, 2020-2035
  • Table 17: North America Market Value (USD Million) Forecast by Source, 2020-2035
  • Table 18: North America Market Volume (MT) Forecast by Source, 2020-2035
  • Table 19: North America Market Value (USD Million) Forecast by Form, 2020-2035
  • Table 20: North America Market Volume (MT) Forecast by Form, 2020-2035
  • Table 21: North America Market Value (USD Million) Forecast by Application, 2020-2035
  • Table 22: North America Market Volume (MT) Forecast by Application, 2020-2035
  • Table 23: North America Market Value (USD Million) Forecast by End User, 2020-2035
  • Table 24: North America Market Volume (MT) Forecast by End User, 2020-2035
  • Table 25: Latin America Market Value (USD Million) Forecast by Country, 2020-2035
  • Table 26: Latin America Market Volume (MT) Forecast by Country, 2020-2035
  • Table 27: Latin America Market Value (USD Million) Forecast by Product Type, 2020-2035
  • Table 28: Latin America Market Volume (MT) Forecast by Product Type, 2020-2035
  • Table 29: Latin America Market Value (USD Million) Forecast by Source, 2020-2035
  • Table 30: Latin America Market Volume (MT) Forecast by Source, 2020-2035
  • Table 31: Latin America Market Value (USD Million) Forecast by Form, 2020-2035
  • Table 32: Latin America Market Volume (MT) Forecast by Form, 2020-2035
  • Table 33: Latin America Market Value (USD Million) Forecast by Application, 2020-2035
  • Table 34: Latin America Market Volume (MT) Forecast by Application, 2020-2035
  • Table 35: Latin America Market Value (USD Million) Forecast by End User, 2020-2035
  • Table 36: Latin America Market Volume (MT) Forecast by End User, 2020-2035
  • Table 37: Europe Market Value (USD Million) Forecast by Country, 2020-2035
  • Table 38: Europe Market Volume (MT) Forecast by Country, 2020-2035
  • Table 39: Europe Market Value (USD Million) Forecast by Product Type, 2020-2035
  • Table 40: Europe Market Volume (MT) Forecast by Product Type, 2020-2035
  • Table 41: Europe Market Value (USD Million) Forecast by Source, 2020-2035
  • Table 42: Europe Market Volume (MT) Forecast by Source, 2020-2035
  • Table 43: Europe Market Value (USD Million) Forecast by Form, 2020-2035
  • Table 44: Europe Market Volume (MT) Forecast by Form, 2020-2035
  • Table 45: Europe Market Value (USD Million) Forecast by Application, 2020-2035
  • Table 46: Europe Market Volume (MT) Forecast by Application, 2020-2035
  • Table 47: Europe Market Value (USD Million) Forecast by End User, 2020-2035
  • Table 48: Europe Market Volume (MT) Forecast by End User, 2020-2035
  • Table 49: East Asia Market Value (USD Million) Forecast by Country, 2020-2035
  • Table 50: East Asia Market Volume (MT) Forecast by Country, 2020-2035
  • Table 51: East Asia Market Value (USD Million) Forecast by Product Type, 2020-2035
  • Table 52: East Asia Market Volume (MT) Forecast by Product Type, 2020-2035
  • Table 53: East Asia Market Value (USD Million) Forecast by Source, 2020-2035
  • Table 54: East Asia Market Volume (MT) Forecast by Source, 2020-2035
  • Table 55: East Asia Market Value (USD Million) Forecast by Form, 2020-2035
  • Table 56: East Asia Market Volume (MT) Forecast by Form, 2020-2035
  • Table 57: East Asia Market Value (USD Million) Forecast by Application, 2020-2035
  • Table 58: East Asia Market Volume (MT) Forecast by Application, 2020-2035
  • Table 59: East Asia Market Value (USD Million) Forecast by End User, 2020-2035
  • Table 60: East Asia Market Volume (MT) Forecast by End User, 2020-2035
  • Table 61: South Asia & Pacific Market Value (USD Million) Forecast by Country, 2020-2035
  • Table 62: South Asia & Pacific Market Volume (MT) Forecast by Country, 2020-2035
  • Table 63: South Asia & Pacific Market Value (USD Million) Forecast by Product Type, 2020-2035
  • Table 64: South Asia & Pacific Market Volume (MT) Forecast by Product Type, 2020-2035
  • Table 65: South Asia & Pacific Market Value (USD Million) Forecast by Source, 2020-2035
  • Table 66: South Asia & Pacific Market Volume (MT) Forecast by Source, 2020-2035
  • Table 67: South Asia & Pacific Market Value (USD Million) Forecast by Form, 2020-2035
  • Table 68: South Asia & Pacific Market Volume (MT) Forecast by Form, 2020-2035
  • Table 69: South Asia & Pacific Market Value (USD Million) Forecast by Application, 2020-2035
  • Table 70: South Asia & Pacific Market Volume (MT) Forecast by Application, 2020-2035
  • Table 71: South Asia & Pacific Market Value (USD Million) Forecast by End User, 2020-2035
  • Table 72: South Asia & Pacific Market Volume (MT) Forecast by End User, 2020-2035
  • Table 73: Middle East & Africa Market Value (USD Million) Forecast by Country, 2020-2035
  • Table 74: Middle East & Africa Market Volume (MT) Forecast by Country, 2020-2035
  • Table 75: Middle East & Africa Market Value (USD Million) Forecast by Product Type, 2020-2035
  • Table 76: Middle East & Africa Market Volume (MT) Forecast by Product Type, 2020-2035
  • Table 77: Middle East & Africa Market Value (USD Million) Forecast by Source, 2020-2035
  • Table 78: Middle East & Africa Market Volume (MT) Forecast by Source, 2020-2035
  • Table 79: Middle East & Africa Market Value (USD Million) Forecast by Form, 2020-2035
  • Table 80: Middle East & Africa Market Volume (MT) Forecast by Form, 2020-2035
  • Table 81: Middle East & Africa Market Value (USD Million) Forecast by Application, 2020-2035
  • Table 82: Middle East & Africa Market Volume (MT) Forecast by Application, 2020-2035
  • Table 83: Middle East & Africa Market Value (USD Million) Forecast by End User, 2020-2035
  • Table 84: Middle East & Africa Market Volume (MT) Forecast by End User, 2020-2035

List of Figures

  • Figure 1: Global Market Volume (MT) Forecast 2020-2035
  • Figure 2: Global Market Pricing Analysis
  • Figure 3: Global Market Value (USD Million) Forecast 2020-2035
  • Figure 4: Global Market Value Share and BPS Analysis by Product Type, 2025 and 2035
  • Figure 5: Global Market Y-o-Y Growth Comparison by Product Type, 2025-2035
  • Figure 6: Global Market Attractiveness Analysis by Product Type
  • Figure 7: Global Market Value Share and BPS Analysis by Source, 2025 and 2035
  • Figure 8: Global Market Y-o-Y Growth Comparison by Source, 2025-2035
  • Figure 9: Global Market Attractiveness Analysis by Source
  • Figure 10: Global Market Value Share and BPS Analysis by Form, 2025 and 2035
  • Figure 11: Global Market Y-o-Y Growth Comparison by Form, 2025-2035
  • Figure 12: Global Market Attractiveness Analysis by Form
  • Figure 13: Global Market Value Share and BPS Analysis by Application, 2025 and 2035
  • Figure 14: Global Market Y-o-Y Growth Comparison by Application, 2025-2035
  • Figure 15: Global Market Attractiveness Analysis by Application
  • Figure 16: Global Market Value Share and BPS Analysis by End User, 2025 and 2035
  • Figure 17: Global Market Y-o-Y Growth Comparison by End User, 2025-2035
  • Figure 18: Global Market Attractiveness Analysis by End User
  • Figure 19: Global Market Value (USD Million) Share and BPS Analysis by Region, 2025 and 2035
  • Figure 20: Global Market Y-o-Y Growth Comparison by Region, 2025-2035
  • Figure 21: Global Market Attractiveness Analysis by Region
  • Figure 22: North America Market Incremental $ Opportunity, 2025-2035
  • Figure 23: Latin America Market Incremental $ Opportunity, 2025-2035
  • Figure 24: Europe Market Incremental $ Opportunity, 2025-2035
  • Figure 25: East Asia Market Incremental $ Opportunity, 2025-2035
  • Figure 26: South Asia & Pacific Market Incremental $ Opportunity, 2025-2035
  • Figure 27: Middle East & Africa Market Incremental $ Opportunity, 2025-2035
  • Figure 28: North America Market Value Share and BPS Analysis by Country, 2025 and 2035
  • Figure 29: North America Market Value Share and BPS Analysis by Product Type, 2025 and 2035
  • Figure 30: North America Market Y-o-Y Growth Comparison by Product Type, 2025-2035
  • Figure 31: North America Market Attractiveness Analysis by Product Type
  • Figure 32: North America Market Value Share and BPS Analysis by Source, 2025 and 2035
  • Figure 33: North America Market Y-o-Y Growth Comparison by Source, 2025-2035
  • Figure 34: North America Market Attractiveness Analysis by Source
  • Figure 35: North America Market Value Share and BPS Analysis by Form, 2025 and 2035
  • Figure 36: North America Market Y-o-Y Growth Comparison by Form, 2025-2035
  • Figure 37: North America Market Attractiveness Analysis by Form
  • Figure 38: North America Market Value Share and BPS Analysis by Application, 2025 and 2035
  • Figure 39: North America Market Y-o-Y Growth Comparison by Application, 2025-2035
  • Figure 40: North America Market Attractiveness Analysis by Application
  • Figure 41: North America Market Value Share and BPS Analysis by End User, 2025 and 2035
  • Figure 42: North America Market Y-o-Y Growth Comparison by End User, 2025-2035
  • Figure 43: North America Market Attractiveness Analysis by End User
  • Figure 44: Latin America Market Value Share and BPS Analysis by Country, 2025 and 2035
  • Figure 45: Latin America Market Value Share and BPS Analysis by Product Type, 2025 and 2035
  • Figure 46: Latin America Market Y-o-Y Growth Comparison by Product Type, 2025-2035
  • Figure 47: Latin America Market Attractiveness Analysis by Product Type
  • Figure 48: Latin America Market Value Share and BPS Analysis by Source, 2025 and 2035
  • Figure 49: Latin America Market Y-o-Y Growth Comparison by Source, 2025-2035
  • Figure 50: Latin America Market Attractiveness Analysis by Source
  • Figure 51: Latin America Market Value Share and BPS Analysis by Form, 2025 and 2035
  • Figure 52: Latin America Market Y-o-Y Growth Comparison by Form, 2025-2035
  • Figure 53: Latin America Market Attractiveness Analysis by Form
  • Figure 54: Latin America Market Value Share and BPS Analysis by Application, 2025 and 2035
  • Figure 55: Latin America Market Y-o-Y Growth Comparison by Application, 2025-2035
  • Figure 56: Latin America Market Attractiveness Analysis by Application
  • Figure 57: Latin America Market Value Share and BPS Analysis by End User, 2025 and 2035
  • Figure 58: Latin America Market Y-o-Y Growth Comparison by End User, 2025-2035
  • Figure 59: Latin America Market Attractiveness Analysis by End User
  • Figure 60: Europe Market Value Share and BPS Analysis by Country, 2025 and 2035
  • Figure 61: Europe Market Value Share and BPS Analysis by Product Type, 2025 and 2035
  • Figure 62: Europe Market Y-o-Y Growth Comparison by Product Type, 2025-2035
  • Figure 63: Europe Market Attractiveness Analysis by Product Type
  • Figure 64: Europe Market Value Share and BPS Analysis by Source, 2025 and 2035
  • Figure 65: Europe Market Y-o-Y Growth Comparison by Source, 2025-2035
  • Figure 66: Europe Market Attractiveness Analysis by Source
  • Figure 67: Europe Market Value Share and BPS Analysis by Form, 2025 and 2035
  • Figure 68: Europe Market Y-o-Y Growth Comparison by Form, 2025-2035
  • Figure 69: Europe Market Attractiveness Analysis by Form
  • Figure 70: Europe Market Value Share and BPS Analysis by Application, 2025 and 2035
  • Figure 71: Europe Market Y-o-Y Growth Comparison by Application, 2025-2035
  • Figure 72: Europe Market Attractiveness Analysis by Application
  • Figure 73: Europe Market Value Share and BPS Analysis by End User, 2025 and 2035
  • Figure 74: Europe Market Y-o-Y Growth Comparison by End User, 2025-2035
  • Figure 75: Europe Market Attractiveness Analysis by End User
  • Figure 76: East Asia Market Value Share and BPS Analysis by Country, 2025 and 2035
  • Figure 77: East Asia Market Value Share and BPS Analysis by Product Type, 2025 and 2035
  • Figure 78: East Asia Market Y-o-Y Growth Comparison by Product Type, 2025-2035
  • Figure 79: East Asia Market Attractiveness Analysis by Product Type
  • Figure 80: East Asia Market Value Share and BPS Analysis by Source, 2025 and 2035
  • Figure 81: East Asia Market Y-o-Y Growth Comparison by Source, 2025-2035
  • Figure 82: East Asia Market Attractiveness Analysis by Source
  • Figure 83: East Asia Market Value Share and BPS Analysis by Form, 2025 and 2035
  • Figure 84: East Asia Market Y-o-Y Growth Comparison by Form, 2025-2035
  • Figure 85: East Asia Market Attractiveness Analysis by Form
  • Figure 86: East Asia Market Value Share and BPS Analysis by Application, 2025 and 2035
  • Figure 87: East Asia Market Y-o-Y Growth Comparison by Application, 2025-2035
  • Figure 88: East Asia Market Attractiveness Analysis by Application
  • Figure 89: East Asia Market Value Share and BPS Analysis by End User, 2025 and 2035
  • Figure 90: East Asia Market Y-o-Y Growth Comparison by End User, 2025-2035
  • Figure 91: East Asia Market Attractiveness Analysis by End User
  • Figure 92: South Asia & Pacific Market Value Share and BPS Analysis by Country, 2025 and 2035
  • Figure 93: South Asia & Pacific Market Value Share and BPS Analysis by Product Type, 2025 and 2035
  • Figure 94: South Asia & Pacific Market Y-o-Y Growth Comparison by Product Type, 2025-2035
  • Figure 95: South Asia & Pacific Market Attractiveness Analysis by Product Type
  • Figure 96: South Asia & Pacific Market Value Share and BPS Analysis by Source, 2025 and 2035
  • Figure 97: South Asia & Pacific Market Y-o-Y Growth Comparison by Source, 2025-2035
  • Figure 98: South Asia & Pacific Market Attractiveness Analysis by Source
  • Figure 99: South Asia & Pacific Market Value Share and BPS Analysis by Form, 2025 and 2035
  • Figure 100: South Asia & Pacific Market Y-o-Y Growth Comparison by Form, 2025-2035
  • Figure 101: South Asia & Pacific Market Attractiveness Analysis by Form
  • Figure 102: South Asia & Pacific Market Value Share and BPS Analysis by Application, 2025 and 2035
  • Figure 103: South Asia & Pacific Market Y-o-Y Growth Comparison by Application, 2025-2035
  • Figure 104: South Asia & Pacific Market Attractiveness Analysis by Application
  • Figure 105: South Asia & Pacific Market Value Share and BPS Analysis by End User, 2025 and 2035
  • Figure 106: South Asia & Pacific Market Y-o-Y Growth Comparison by End User, 2025-2035
  • Figure 107: South Asia & Pacific Market Attractiveness Analysis by End User
  • Figure 108: Middle East & Africa Market Value Share and BPS Analysis by Country, 2025 and 2035
  • Figure 109: Middle East & Africa Market Value Share and BPS Analysis by Product Type, 2025 and 2035
  • Figure 110: Middle East & Africa Market Y-o-Y Growth Comparison by Product Type, 2025-2035
  • Figure 111: Middle East & Africa Market Attractiveness Analysis by Product Type
  • Figure 112: Middle East & Africa Market Value Share and BPS Analysis by Source, 2025 and 2035
  • Figure 113: Middle East & Africa Market Y-o-Y Growth Comparison by Source, 2025-2035
  • Figure 114: Middle East & Africa Market Attractiveness Analysis by Source
  • Figure 115: Middle East & Africa Market Value Share and BPS Analysis by Form, 2025 and 2035
  • Figure 116: Middle East & Africa Market Y-o-Y Growth Comparison by Form, 2025-2035
  • Figure 117: Middle East & Africa Market Attractiveness Analysis by Form
  • Figure 118: Middle East & Africa Market Value Share and BPS Analysis by Application, 2025 and 2035
  • Figure 119: Middle East & Africa Market Y-o-Y Growth Comparison by Application, 2025-2035
  • Figure 120: Middle East & Africa Market Attractiveness Analysis by Application
  • Figure 121: Middle East & Africa Market Value Share and BPS Analysis by End User, 2025 and 2035
  • Figure 122: Middle East & Africa Market Y-o-Y Growth Comparison by End User, 2025-2035
  • Figure 123: Middle East & Africa Market Attractiveness Analysis by End User
  • Figure 124: Global Market - Tier Structure Analysis
  • Figure 125: Global Market - Company Share Analysis

Frequently Asked Questions

What is the market size of the Fermented Amino Acid Complex Market in 2025?

The market is valued at USD 17,948.2 Million in 2025, with essential amino acids driving the largest share of demand.

What is the projected market size by 2035?

The market is forecast to reach USD 31,505.4 Million by 2035, reflecting an absolute growth of USD 13,557.2 Million.

What is the CAGR for the forecast period 2025 to 2035?

The market is expected to expand at a 5.8% CAGR between 2025 and 2035.

Which product type dominates the market in 2025?

Essential amino acids dominate with 38% share, supported by their wide use in food, feed, and dietary supplements.

Which application segment is expanding fastest?

Dietary supplements and sports nutrition are forecast to grow at the fastest pace, recording an 8.4% CAGR during 2025 to 2035.

Explore Similar Insights

Future Market Insights

Fermented Amino Acid Complex Market

Chat With

MaRIA

Hi There, I am MaRIA, Your Market Research Intelligence Assistant. How may I help you?