Fermented Dairy Ingredient Market Size, Share, and Forecast Outlook 2025 to 2035

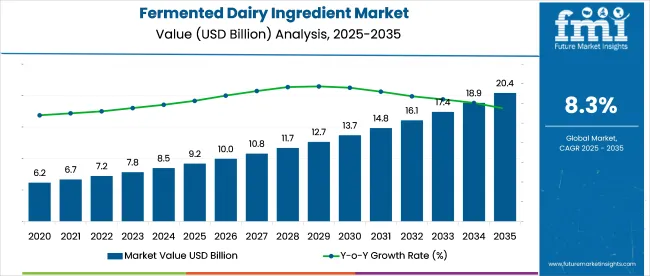
The global fermented dairy ingredient market is projected to rise significantly from USD 9.2 billion in 2025 to USD 20.4 billion by 2035, expanding at a robust CAGR of 8.3%. This upward momentum reflects a growing global preference for natural, health-promoting food components that offer both nutritional and functional benefits.
Quick Stats of Fermented Dairy Ingredient Market

  • Market Value (2025): USD 9.2 billion
  • Forecast Value (2035): USD 20.4 billion
  • Forecast CAGR (2025 to 2035): 8.3%
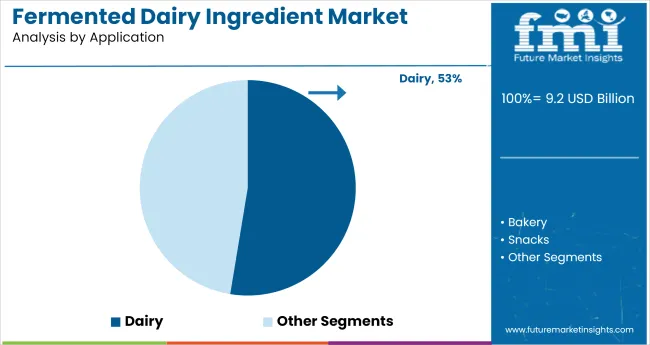
  • Leading Segment in 2025: Dairy (52.6% share)
  • Key Growth Region: Asia Pacific (China)
  • Key Players: Mars, Incorporated, Mondelez International, Nestlé S.A., The Kraft Heinz Company, General Mills, Inc., PepsiCo, Inc., Kellogg Company, Danone S.A., Hain Celestial Group, Inc., and Unilever PLC

Fermented Dairy Ingredients Market

Attribute Values
Estimated Industry Size (2025E) USD 9.2 billion
Projected Industry Value (2035F) USD 20.4 billion
CAGR (2025 to 2035) 8.3%

Fermented dairy ingredients are increasingly integrated into diverse food and beverage applications, from conventional dairy products to modern fortified formulations such as probiotic drinks, snackable dairy formats, and nutritional powders. The expanding role of these ingredients in health-centric diets-particularly those focused on gut health, immune support, and clean-label claims-is creating strong commercial traction across developed and emerging economies alike.

The industry registers an estimated 11-14% share of the global dairy and dairy products industry, driven by its application in yogurts, kefir, and cheese. Within the functional food ingredients industry, fermented dairy ingredients account for roughly 8-10%, supported by rising consumer demand for gut-health-promoting and probiotic-rich components.

In the food and beverage additives industry, their share is modest at 4-6%, as they represent a niche compared to synthetic preservatives and flavoring agents. However, their role is expanding in the probiotics industry, where they contribute 18-22%, owing to their naturally cultured bacterial strains.

In the nutraceutical ingredients industry, it contributes about 6-8%, largely through its integration into clinical and digestive health formulations. In 2020 and 2024, the surge in consumption of fermented dairy ingredients was primarily influenced by the global COVID-19 pandemic, which heightened public consciousness around immunity and digestive health.

Analysis of Fermented Dairy Ingredient Market by Top Investment Segments 

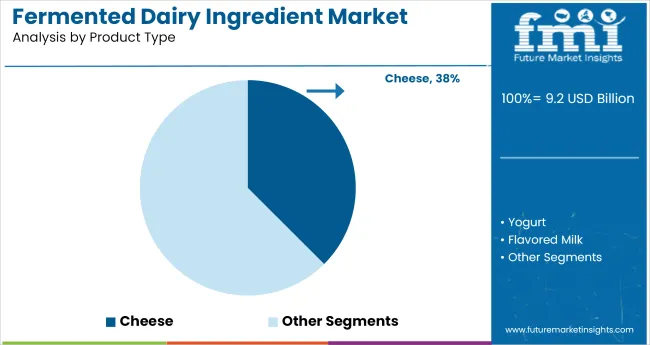
Cheese leads the market by product type with a 38% share in 2025, driven by its global culinary use in probiotic variants and extended shelf life. The dairy segment dominates applications with a 52.6% share, owing to widespread use in yogurt, kefir, and cheese, supported by consumer demand for natural, functional, and clean-label products.
Cheese Fermentation Powerhouse with Culinary Versatility

Fermented Dairy Ingredients Market By Product Type

Cheese is projected to capture a leading 38% share of the fermented dairy ingredients market in 2025 due to its unmatched versatility and culinary value. The growing use of microbial starters in both industrial and artisanal cheese-making elevates demand for high-performing fermentation agents. Trends in plant-based and functional cheese alternatives also promote specialized ingredient use.

Additionally, global fusion cuisine, which frequently includes cheese components, has widened industry exposure. Longer shelf life, enhanced umami profiles, and probiotic enrichment further add to its commercial potential, positioning cheese fermentation as a long-term, scalable growth driver across both developed and emerging food markets.
  • Fermentation enhances cheese flavor depth and regional profile appeal.
  • Specialized cultures cater to vegan, aged, or ethnic cheese varieties.
  • Shelf-stable formats extend cheese distribution in warm-climate markets

Dairy Application Driving Volume and Value

Fermented Dairy Ingredients Market By Application

Dairy applications dominate the fermented dairy ingredients market with 52.6% share in 2025, underpinned by high consumption of cultured dairy staples like yogurt, kefir, and buttermilk. Fermentation is crucial to improving not only taste and shelf stability but also functional attributes such as probiotic density and digestibility.

The rising prevalence of lactose sensitivity has sparked demand for fermented dairy that offers enzymatic breakdown of lactose. Innovations in cold fermentation and high-pressure processing are helping retain microbial efficacy. These applications allow dairy manufacturers to meet evolving consumer health priorities, particularly in immunity, gut health, and naturally preserved product development.

  • Fermented dairy eases lactose digestion for sensitive populations.
  • Cold fermentation preserves live cultures in chilled products.
  • Growing interest in high-pressure processing for clean-label claims.

Top Fermented Dairy Ingredients Market Dynamics

The market is driven by growing demand for gut-health, clean-label, and functional nutrition products, especially in urban and health-conscious segments. Innovation in cultures and supportive regulations are further expanding market reach and product quality.

Health Focus and Functional Demand

The fermented dairy ingredient market is experiencing strong growth due to increasing consumer focus on digestive health, immunity, and functional nutrition. The surge in demand for probiotic-rich, clean-label, and naturally fermented products has positioned these ingredients as essential in both traditional and modern food formulations.

Consumers are seeking minimally processed options that support gut health, and this shift is reshaping the food industry’s formulation strategies.

  • Rising demand for probiotics and gut-health ingredients
  • Shift toward clean-label and minimally processed foods
  • Functional food trends driving innovation in dairy

R&D and Regulatory Frameworks Driving Quality and Market Access

Evolving product regulations are also key drivers are also key drivers shaping the market. Companies are investing in R&D to develop novel cultures, extend shelf life, and improve the sensory profile of fermented dairy products. At the same time, supportive regulations that promote functional and probiotic-enriched food consumption, especially in Europe, North America, and parts of Asia, are expanding market accessibility.

Labeling transparency and safety standards are pushing manufacturers to adopt high-quality, naturally derived fermentation inputs.
  • Increased R&D in starter cultures and strain development
  • Favorable regulations for probiotic and functional claims
  • Quality and transparency are gaining regulatory importance

Analysis of Top Countries Manufacturing and Supplying Fermented Dairy Ingredients Globally

Country Wise Analysis Of Fermented Dairy Ingredients Market

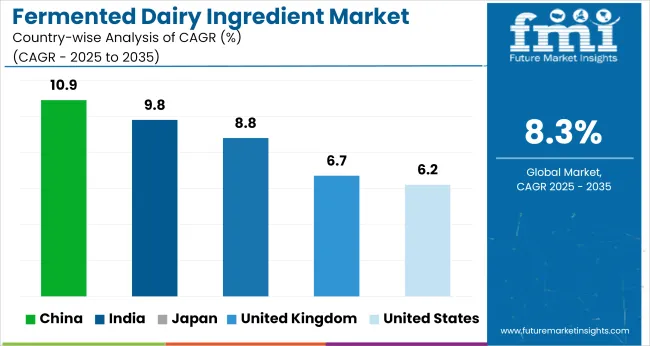
China and India are the fastest-growing markets for fermented dairy ingredients, with CAGRs of 10.9% and 9.8% from 2025 to 2035. Both BRICS nations benefit from urbanization, rising disposable incomes, and increasing interest in functional nutrition. In China, fortified and probiotic dairy products thrive via e-commerce and cold-chain upgrades.

In India, curd and lassi are being modernized to meet urban health trends. The United States, United Kingdom, and Japan-OECD members-register stable growth between 6.2% and 8.8%, driven by clean-label demand and gut-health focus. The report covers detailed analysis of 40+ countries and the top five countries have been shared as a reference.

Country CAGR (2025 to 2035)
United States 6.2%
United Kingdom 6.7%
Japan 8.8%
China 10.9%
India 9.8%

Growth Potential of Fermented Dairy Ingredients Market in the United States

The United State fermented dairy ingredients market is projected to register a CAGR of 6.2% from 2025 to 2035. This growth reflects a maturing yet increasingly health-aware population, where fermented dairy products are favored for their gut-friendly attributes and clean-label status. The industry benefits from a rise in consumer interest in foods that support immune health, a trend amplified during and after the COVID-19 pandemic.

Leading food manufacturers are reformulating products with bioactive ingredients like probiotic yogurt concentrates and fermented milk powders to meet evolving wellness trends. Dairy processing and fermentation techniques are also enabling the expansion of ingredient versatility across food applications, including protein bars, smoothies, and meal replacements.

  • Consumer preference for digestive health and functional food formats.
  • High product in yogurt-based beverages, snacks, and dairy blends.
  • Growing demand for natural, clean-label, and protein-enriched formulations.

Demand Forecast for Fermented Dairy Ingredients Market in China

The fermented dairy ingredients market in China is set to grow at a robust CAGR of 10.9% through 2035. This steep growth is primarily driven by rising disposable incomes, increasing health awareness, and the cultural acceptance of dairy in modern diets, particularly in urban centers.

The Chinese population is increasingly leaning toward probiotic-rich foods to counteract gut-related health issues stemming from sedentary lifestyles and high-stress environments. Domestic and multinational players are rapidly expanding their portfolios with locally tailored flavors and ingredients, making fermented dairy more appealing to a broad consumer base.

  • Rising middle-class income is fueling demand for health-oriented dairy.
  • Strong government support for nutritional enhancement programs.
  • Urbanization boosts consumption of value-added, ready-to-consume dairy foods.

Growth Analysis of Fermented Dairy Ingredients Market in Japan

Fermented dairy ingredients market in Japan is forecasted to grow at a CAGR of 8.8% between 2020 and 2035. The market is influenced by a deep-rooted culture of consuming fermented products, complemented by modern scientific validation of probiotic benefits.

The aging population is a crucial driver, with older adults seeking functional foods to support digestion, bone strength, and immunity. Japanese consumers are also highly brand-conscious and quality-sensitive, prompting companies to emphasize ingredient transparency, fermentation authenticity, and clean labeling. Functional dairy beverages and probiotic supplements featuring traditional fermented dairy extracts are increasingly integrated into daily diets.

  • Aging population driving demand for gut and bone health support.
  • High consumer trust in scientifically validated functional ingredients.
  • A blend of traditional preferences and modern hybrid fermented products is shaping consumer behavior

Future Outlook for Fermented Dairy Ingredients Market in the United Kingdom

The fermented dairy ingredients market in the United Kingdom is anticipated to expand at a CAGR of 6.7% over the 2020 to 2035 period. The UK industry is evolving amid growing consumer preference for sustainable, low-sugar, and plant-blended dairy alternatives, where fermented ingredients are being explored for both functional and flavor-enhancing roles.

Post-Brexit nutritional labeling and local sourcing emphasis are compelling brands to differentiate through traceable, health-forward offerings. Consumers, particularly Gen Z and millennials, are driving the surge in probiotic yogurt, kefir drinks, and fortified cheese spreads. The rise of flexitarian and health-centric lifestyles has positioned fermented dairy as a premium functional ingredient across both dairy and non-dairy matrices.

  • Flexitarian and wellness trends influencing fermented ingredient uptake.
  • Demand for transparent sourcing and functional labeling post-Brexit.
  • Rise of premium, fortified dairy and hybrid plant-dairy formulations.

Market Expansion Outlook for Fermented Dairy Ingredients in India

Fermented dairy ingredients market in India is projected to grow at an estimated CAGR of 9.8% from 2025 to 2035. Rapidly growing industry in India is powered by a strong dairy culture, an expanding middle class, and increasing awareness of functional nutrition. Traditional fermented dairy products like curd, buttermilk, and lassi are being modernized into convenient formats enriched with probiotics and functional strains.

At the same time, government initiatives promoting nutritional awareness and school meal programs are integrating fermented dairy as a key component of daily diets. Domestic producers and startups are also investing in regional ingredients to combine tradition with science, fostering wider industry penetration.
  • Deep-rooted tradition of fermented dairy use in daily diets.
  • Rising health-conscious consumer base in urban areas.
  • Modernized product formats combining convenience with functional health.

Leading Fermented Dairy Ingredients Suppliers

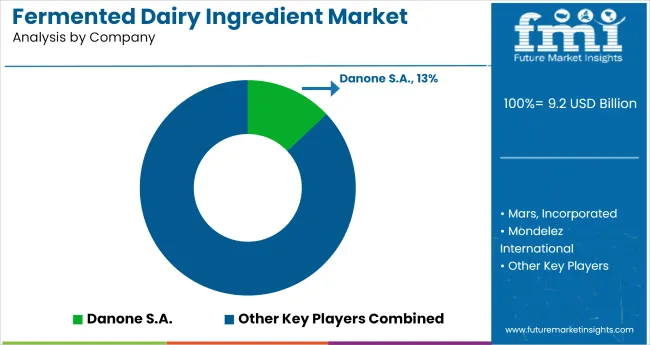
Fermented Dairy Ingredients Market By Company

Leading Company - Danone S.A.

Market Share - 12%

The fermented dairy ingredients market is dominated by global giants such as Danone S.A., Nestlé S.A., and The Kraft Heinz Company, leveraging strong dairy portfolios, proprietary cultures, and extensive global distribution in yogurt, cheese, and probiotic beverages. Key players including General Mills, Inc., Unilever PLC, and Mondelez International focus on innovation in flavor, texture, and functional health benefits, catering to evolving consumer preferences.

Emerging players like Hain Celestial Group, Inc., Mars, Incorporated, PepsiCo, Inc., and Kellogg Company are entering the space via strategic acquisitions and fermented product extensions. Industry growth is driven by rising demand for gut-health solutions, protein-rich snacking, and clean-label dairy formulations.

Recent Fermented Dairy Ingredients Industry News

  • In May 2024, Mars announced a major partnership with FrieslandCampina, launching the Mars-FrieslandCampina Sustainable Dairy Development Program. This initiative will dedicate a group of farms to Mars’ dairy supply, focusing on scaling sustainable and innovative dairy practices, including fermentation technologies, to reduce the carbon footprint of its dairy sourcing.
  • In March 2025, Vivici launched Vivitein™ BLG, a precision-fermented dairy protein, in the USA, offering 86% less water use and 68% lower emissions than whey. It is GRAS-certified and targets active nutrition applications

Leading Players

  • Mars, Incorporated
  • Mondelez International
  • Nestlé S.A.
  • The Kraft Heinz Company
  • General Mills, Inc.
  • PepsiCo, Inc.
  • Kellogg Company
  • Danone S.A.
  • Hain Celestial Group, Inc.
  • Unilever PLC

Report Coverage and Scope Summary

Report Attributes Details
Industry Size (2025) USD 9.2 billion
Projected Industry Size (2035) USD 20.4 billion
CAGR (2025 to 2035) 8.3%
Base Year for Estimation 2024
Historical Period 2020 to 2024
Projections Period 2025 to 2035
Quantitative Units USD billion for value and volume in metric tons
Product Type Analyzed (Segment 1) Cheese (Natural Cheese and Processed Cheese), Yogurt (Spoonable Yogurt, Drinkable Yogurt, Cultures, And Enzymes), Flavored Milk (Cultures And Enzymes), and Starch (Native and Modified).
Application Analyzed (Segment 2) Bakery, Dairy, Snacks, and Others.
Regions Covered North America, Europe, Asia Pacific, Middle East & Africa, Latin America
Countries Covered United States, Canada, Germany, United Kingdom, France, Italy, Spain, China, Japan, South Korea, India, Australia, Brazil, Mexico, Argentina, Saudi Arabia, UAE, South Africa
Key Players Mars, Incorporated, Mondelez International, Nestlé S.A., The Kraft Heinz Company, General Mills, Inc., PepsiCo, Inc., Kellogg Company, Danone S.A., Hain Celestial Group, Inc., and Unilever PLC
Additional Attributes Dollar sales, share, fastest-growing applications, regional demand hotspots, product trends, clean-label shifts, and competitor strategies for growth.

Key Segments

By Product Type:

The industry is segmented into cheese (natural cheese and processed cheese), yogurt (spoonable yogurt, drinkable yogurt, cultures, and enzymes), flavored milk (cultures and enzymes), and Starch (native and modified).

By Application:

The industry finds applications in bakery, dairy, snacks, and other products.

By Region:

The industry covers regions including North America, Europe, Asia Pacific, Latin America, and the Middle East & Africa.

Table of Content

  1. Executive Summary
    • Global Market Outlook
    • Demand-side Trends
    • Supply-side Trends
    • Technology Roadmap Analysis
    • Analysis and Recommendations
  2. Market Overview
    • Market Coverage / Taxonomy
    • Market Definition / Scope / Limitations
  3. Market Background
    • Market Dynamics
      • Drivers
      • Restraints
      • Opportunity
      • Trends
    • Scenario Forecast
      • Demand in Optimistic Scenario
      • Demand in Likely Scenario
      • Demand in Conservative Scenario
    • Opportunity Map Analysis
    • Product Life Cycle Analysis
    • Supply Chain Analysis
      • Supply Side Participants and their Roles
        • Producers
        • Mid-Level Participants (Traders/ Agents/ Brokers)
        • Wholesalers and Distributors
      • Value Added and Value Created at Node in the Supply Chain
      • List of Raw Material Suppliers
      • List of Existing and Potential Buyer’s
    • Investment Feasibility Matrix
    • Value Chain Analysis
      • Profit Margin Analysis
      • Wholesalers and Distributors
      • Retailers
    • PESTLE and Porter’s Analysis
    • Regulatory Landscape
      • By Key Regions
      • By Key Countries
    • Regional Parent Market Outlook
    • Production and Consumption Statistics
    • Import and Export Statistics
  4. Global Market Analysis 2020 to 2024 and Forecast, 2025 to 2035
    • Historical Market Size Value (USD Billion) & Volume (Metric tons) Analysis, 2020 to 2024
    • Current and Future Market Size Value (USD Billion) & Volume (Metric tons) Projections, 2025 to 2035
      • Y-o-Y Growth Trend Analysis
      • Absolute $ Opportunity Analysis
  5. Global Market Pricing Analysis 2020 to 2024 and Forecast 2025 to 2035
  6. Global Market Analysis 2020 to 2024 and Forecast 2025 to 2035, By Product Type
    • Introduction / Key Findings
    • Historical Market Size Value (USD Billion) & Volume (Metric tons) Analysis by Product Type, 2020 to 2024
    • Current and Future Market Size Value (USD Billion) & Volume (Metric tons) Analysis and Forecast By Product Type, 2025 to 2035
      • Cheese
        • Natural Cheese
        • Processed Cheese
      • Yogurt
        • Spoonable Yogurt
        • Drinkable Yogurt
        • Cultures
        • Enzymes
      • Flavored Milk
        • Cultures
        • Enzymes
      • Starch
        • Native
        • Modified
    • Y-o-Y Growth Trend Analysis By Product Type, 2020 to 2024
    • Absolute $ Opportunity Analysis By Product Type, 2025 to 2035
  7. Global Market Analysis 2020 to 2024 and Forecast 2025 to 2035, By Application
    • Introduction / Key Findings
    • Historical Market Size Value (USD Billion) & Volume (Metric tons) Analysis By Application, 2020 to 2024
    • Current and Future Market Size Value (USD Billion) & Volume (Metric tons) Analysis and Forecast By Application, 2025 to 2035
      • Bakery
      • Dairy
      • Snacks
      • Others
    • Y-o-Y Growth Trend Analysis By Application, 2020 to 2024
    • Absolute $ Opportunity Analysis By Application, 2025 to 2035
  8. Global Market Analysis 2020 to 2024 and Forecast 2025 to 2035, By Region
    • Introduction
    • Historical Market Size Value (USD Billion) & Volume (Metric tons) Analysis By Region, 2020 to 2024
    • Current Market Size Value (USD Billion) & Volume (Metric tons) Analysis and Forecast By Region, 2025 to 2035
      • North America
      • Latin America
      • Western Europe
      • Eastern Europe
      • East Asia
      • South Asia & Pacific
      • Middle East and Africa
    • Market Attractiveness Analysis By Region
  9. North America Market Analysis 2020 to 2024 and Forecast 2025 to 2035, By Country
    • Historical Market Size Value (USD Billion) & Volume (Metric tons) Trend Analysis By Market Taxonomy, 2020 to 2024
    • Market Size Value (USD Billion) & Volume (Metric tons) Forecast By Market Taxonomy, 2025 to 2035
      • By Country
        • USA
        • Canada
        • Mexico
      • By Product Type
      • By Application
    • Market Attractiveness Analysis
      • By Country
      • By Product Type
      • By Application
    • Key Takeaways
  10. Latin America Market Analysis 2020 to 2024 and Forecast 2025 to 2035, By Country
    • Historical Market Size Value (USD Billion) & Volume (Metric tons) Trend Analysis By Market Taxonomy, 2020 to 2024
    • Market Size Value (USD Billion) & Volume (Metric tons) Forecast By Market Taxonomy, 2025 to 2035
      • By Country
        • Brazil
        • Argentina
        • Rest of LATAM
      • By Product Type
      • By Application
    • Market Attractiveness Analysis
      • By Country
      • By Product Type
      • By Application
    • Key Takeaways
  11. Western Europe Market Analysis 2020 to 2024 and Forecast 2025 to 2035, By Country
    • Historical Market Size Value (USD Billion) & Volume (Metric tons) Trend Analysis By Market Taxonomy, 2020 to 2024
    • Market Size Value (USD Billion) & Volume (Metric tons) Forecast By Market Taxonomy, 2025 to 2035
      • By Country
        • Germany
        • Italy
        • France
        • UK
        • Spain
        • BENELUX
        • Nordic
        • Rest of W.Europe
      • By Product Type
      • By Application
    • Market Attractiveness Analysis
      • By Country
      • By Product Type
      • By Application
    • Key Takeaways
  12. Eastern Europe Market Analysis 2020 to 2024 and Forecast 2025 to 2035, By Country
    • Historical Market Size Value (USD Billion) & Volume (Metric tons) Trend Analysis By Market Taxonomy, 2020 to 2024
    • Market Size Value (USD Billion) & Volume (Metric tons) Forecast By Market Taxonomy, 2025 to 2035
      • By Country
        • Russia
        • Hungary
        • Poland
        • Balkan & Baltics
        • Rest of E. Europe
      • By Product Type
      • By Application
    • Market Attractiveness Analysis
      • By Country
      • By Product Type
      • By Application
    • Key Takeaways
  13. East Asia Market Analysis 2020 to 2024 and Forecast 2025 to 2035, By Country
    • Historical Market Size Value (USD Billion) & Volume (Metric tons) Trend Analysis By Market Taxonomy, 2020 to 2024
    • Market Size Value (USD Billion) & Volume (Metric tons) Forecast By Market Taxonomy, 2025 to 2035
      • By Country
        • China
        • Japan
        • South Korea
      • By Product Type
      • By Application
    • Market Attractiveness Analysis
      • By Country
      • By Product Type
      • By Application
    • Key Takeaways
  14. South Asia & Pacific Market Analysis 2020 to 2024 and Forecast 2025 to 2035, By Country
    • Historical Market Size Value (USD Billion) & Volume (Metric tons) Trend Analysis By Market Taxonomy, 2020 to 2024
    • Market Size Value (USD Billion) & Volume (Metric tons) Forecast By Market Taxonomy, 2025 to 2035
      • By Country
        • India
        • Australia & New Zealand
        • ASEAN
        • Rest of SAP
      • By Product Type
      • By Application
    • Market Attractiveness Analysis
      • By Country
      • By Product Type
      • By Application
    • Key Takeaways
  15. Middle East and Africa Market Analysis 2020 to 2024 and Forecast 2025 to 2035, By Country
    • Historical Market Size Value (USD Billion) & Volume (Metric tons) Trend Analysis By Market Taxonomy, 2020 to 2024
    • Market Size Value (USD Billion) & Volume (Metric tons) Forecast By Market Taxonomy, 2025 to 2035
      • By Country
        • GCC Countries
        • Northern Africa
        • South Africa
        • Turkiye
        • Rest of MEA
      • By Product Type
      • By Application
    • Market Attractiveness Analysis
      • By Country
      • By Product Type
      • By Application
    • Key Takeaways
  16. Key Countries Market Analysis
    • USA
      • Pricing Analysis
      • Market Share Analysis, 2024
        • By Product Type
        • By Application
    • Canada
      • Pricing Analysis
      • Market Share Analysis, 2024
        • By Product Type
        • By Application
    • Brazil
      • Pricing Analysis
      • Market Share Analysis, 2024
        • By Product Type
        • By Application
    • Mexico
      • Pricing Analysis
      • Market Share Analysis, 2024
        • By Product Type
        • By Application
    • Argentina
      • Pricing Analysis
      • Market Share Analysis, 2024
        • By Product Type
        • By Application
  17. Market Structure Analysis
    • Competition Dashboard
    • Competition Benchmarking
    • Market Share Analysis of Top Players
      • By Regional
      • By Product Type
      • By Application
  18. Competition Analysis
    • Competition Deep Dive
      • Mars, Incorporated
        • Overview
        • Product Portfolio
        • Profitability by Market Segments (Product/Age /Sales Channel/Region)
        • Sales Footprint
        • Strategy Overview
          • Marketing Strategy
          • Product Strategy
          • Channel Strategy
      • Mondelez International
        • Overview
        • Product Portfolio
        • Profitability by Market Segments (Product/Age /Sales Channel/Region)
        • Sales Footprint
        • Strategy Overview
          • Marketing Strategy
          • Product Strategy
          • Channel Strategy
      • Nestlé S.A.
        • Overview
        • Product Portfolio
        • Profitability by Market Segments (Product/Age /Sales Channel/Region)
        • Sales Footprint
        • Strategy Overview
          • Marketing Strategy
          • Product Strategy
          • Channel Strategy
      • The Kraft Heinz Company
        • Overview
        • Product Portfolio
        • Profitability by Market Segments (Product/Age /Sales Channel/Region)
        • Sales Footprint
        • Strategy Overview
          • Marketing Strategy
          • Product Strategy
          • Channel Strategy
      • General Mills, Inc.
        • Overview
        • Product Portfolio
        • Profitability by Market Segments (Product/Age /Sales Channel/Region)
        • Sales Footprint
        • Strategy Overview
          • Marketing Strategy
          • Product Strategy
          • Channel Strategy
      • PepsiCo, Inc.
        • Overview
        • Product Portfolio
        • Profitability by Market Segments (Product/Age /Sales Channel/Region)
        • Sales Footprint
        • Strategy Overview
          • Marketing Strategy
          • Product Strategy
          • Channel Strategy
      • Kellogg Company
        • Overview
        • Product Portfolio
        • Profitability by Market Segments (Product/Age /Sales Channel/Region)
        • Sales Footprint
        • Strategy Overview
          • Marketing Strategy
          • Product Strategy
          • Channel Strategy
      • Danone S.A.
        • Overview
        • Product Portfolio
        • Profitability by Market Segments (Product/Age /Sales Channel/Region)
        • Sales Footprint
        • Strategy Overview
          • Marketing Strategy
          • Product Strategy
          • Channel Strategy
      • Hain Celestial Group, Inc.
        • Overview
        • Product Portfolio
        • Profitability by Market Segments (Product/Age /Sales Channel/Region)
        • Sales Footprint
        • Strategy Overview
          • Marketing Strategy
          • Product Strategy
          • Channel Strategy
      • Unilever PLC
        • Overview
        • Product Portfolio
        • Profitability by Market Segments (Product/Age /Sales Channel/Region)
        • Sales Footprint
        • Strategy Overview
          • Marketing Strategy
          • Product Strategy
          • Channel Strategy
  19. Assumptions & Acronyms Used
  20. Research Methodology

List of Tables

  • Table 1: Global Market Value (USD Billion) Forecast by Region, 2020-2035
  • Table 2: Global Market Volume (Metric tons) Forecast by Region, 2020-2035
  • Table 3: Global Market Value (USD Billion) Forecast by Product Type, 2020-2035
  • Table 4: Global Market Volume (Metric tons) Forecast by Product Type, 2020-2035
  • Table 5: Global Market Value (USD Billion) Forecast by Application, 2020-2035
  • Table 6: Global Market Volume (Metric tons) Forecast by Application, 2020-2035
  • Table 7: North America Market Value (USD Billion) Forecast by Country, 2020-2035
  • Table 8: North America Market Volume (Metric tons) Forecast by Country, 2020-2035
  • Table 9: North America Market Value (USD Billion) Forecast by Product Type, 2020-2035
  • Table 10: North America Market Volume (Metric tons) Forecast by Product Type, 2020-2035
  • Table 11: North America Market Value (USD Billion) Forecast by Application, 2020-2035
  • Table 12: North America Market Volume (Metric tons) Forecast by Application, 2020-2035
  • Table 13: Latin America Market Value (USD Billion) Forecast by Country, 2020-2035
  • Table 14: Latin America Market Volume (Metric tons) Forecast by Country, 2020-2035
  • Table 15: Latin America Market Value (USD Billion) Forecast by Product Type, 2020-2035
  • Table 16: Latin America Market Volume (Metric tons) Forecast by Product Type, 2020-2035
  • Table 17: Latin America Market Value (USD Billion) Forecast by Application, 2020-2035
  • Table 18: Latin America Market Volume (Metric tons) Forecast by Application, 2020-2035
  • Table 19: Western Europe Market Value (USD Billion) Forecast by Country, 2020-2035
  • Table 20: Western Europe Market Volume (Metric tons) Forecast by Country, 2020-2035
  • Table 21: Western Europe Market Value (USD Billion) Forecast by Product Type, 2020-2035
  • Table 22: Western Europe Market Volume (Metric tons) Forecast by Product Type, 2020-2035
  • Table 23: Western Europe Market Value (USD Billion) Forecast by Application, 2020-2035
  • Table 24: Western Europe Market Volume (Metric tons) Forecast by Application, 2020-2035
  • Table 25: Eastern Europe Market Value (USD Billion) Forecast by Country, 2020-2035
  • Table 26: Eastern Europe Market Volume (Metric tons) Forecast by Country, 2020-2035
  • Table 27: Eastern Europe Market Value (USD Billion) Forecast by Product Type, 2020-2035
  • Table 28: Eastern Europe Market Volume (Metric tons) Forecast by Product Type, 2020-2035
  • Table 29: Eastern Europe Market Value (USD Billion) Forecast by Application, 2020-2035
  • Table 30: Eastern Europe Market Volume (Metric tons) Forecast by Application, 2020-2035
  • Table 31: East Asia Market Value (USD Billion) Forecast by Country, 2020-2035
  • Table 32: East Asia Market Volume (Metric tons) Forecast by Country, 2020-2035
  • Table 33: East Asia Market Value (USD Billion) Forecast by Product Type, 2020-2035
  • Table 34: East Asia Market Volume (Metric tons) Forecast by Product Type, 2020-2035
  • Table 35: East Asia Market Value (USD Billion) Forecast by Application, 2020-2035
  • Table 36: East Asia Market Volume (Metric tons) Forecast by Application, 2020-2035
  • Table 37: South Asia & Pacific Market Value (USD Billion) Forecast by Country, 2020-2035
  • Table 38: South Asia & Pacific Market Volume (Metric tons) Forecast by Country, 2020-2035
  • Table 39: South Asia & Pacific Market Value (USD Billion) Forecast by Product Type, 2020-2035
  • Table 40: South Asia & Pacific Market Volume (Metric tons) Forecast by Product Type, 2020-2035
  • Table 41: South Asia & Pacific Market Value (USD Billion) Forecast by Application, 2020-2035
  • Table 42: South Asia & Pacific Market Volume (Metric tons) Forecast by Application, 2020-2035
  • Table 43: Middle East and Africa Market Value (USD Billion) Forecast by Country, 2020-2035
  • Table 44: Middle East and Africa Market Volume (Metric tons) Forecast by Country, 2020-2035
  • Table 45: Middle East and Africa Market Value (USD Billion) Forecast by Product Type, 2020-2035
  • Table 46: Middle East and Africa Market Volume (Metric tons) Forecast by Product Type, 2020-2035
  • Table 47: Middle East and Africa Market Value (USD Billion) Forecast by Application, 2020-2035
  • Table 48: Middle East and Africa Market Volume (Metric tons) Forecast by Application, 2020-2035

List of Figures

  • Figure 1: Global Market Volume (Metric tons) Forecast 2020-2035
  • Figure 2: Global Market Pricing Analysis
  • Figure 3: Global Market Value (USD Billion) Forecast 2020-2035
  • Figure 4: Global Market Value Share and BPS Analysis by Product Type, 2025 and 2035
  • Figure 5: Global Market Y-o-Y Growth Comparison by Product Type, 2025-2035
  • Figure 6: Global Market Attractiveness Analysis by Product Type
  • Figure 7: Global Market Value Share and BPS Analysis by Application, 2025 and 2035
  • Figure 8: Global Market Y-o-Y Growth Comparison by Application, 2025-2035
  • Figure 9: Global Market Attractiveness Analysis by Application
  • Figure 10: Global Market Value (USD Billion) Share and BPS Analysis by Region, 2025 and 2035
  • Figure 11: Global Market Y-o-Y Growth Comparison by Region, 2025-2035
  • Figure 12: Global Market Attractiveness Analysis by Region
  • Figure 13: North America Market Incremental $ Opportunity, 2025-2035
  • Figure 14: Latin America Market Incremental $ Opportunity, 2025-2035
  • Figure 15: Western Europe Market Incremental $ Opportunity, 2025-2035
  • Figure 16: Eastern Europe Market Incremental $ Opportunity, 2025-2035
  • Figure 17: East Asia Market Incremental $ Opportunity, 2025-2035
  • Figure 18: South Asia & Pacific Market Incremental $ Opportunity, 2025-2035
  • Figure 19: Middle East and Africa Market Incremental $ Opportunity, 2025-2035
  • Figure 20: North America Market Value Share and BPS Analysis by Country, 2025 and 2035
  • Figure 21: North America Market Value Share and BPS Analysis by Product Type, 2025 and 2035
  • Figure 22: North America Market Y-o-Y Growth Comparison by Product Type, 2025-2035
  • Figure 23: North America Market Attractiveness Analysis by Product Type
  • Figure 24: North America Market Value Share and BPS Analysis by Application, 2025 and 2035
  • Figure 25: North America Market Y-o-Y Growth Comparison by Application, 2025-2035
  • Figure 26: North America Market Attractiveness Analysis by Application
  • Figure 27: Latin America Market Value Share and BPS Analysis by Country, 2025 and 2035
  • Figure 28: Latin America Market Value Share and BPS Analysis by Product Type, 2025 and 2035
  • Figure 29: Latin America Market Y-o-Y Growth Comparison by Product Type, 2025-2035
  • Figure 30: Latin America Market Attractiveness Analysis by Product Type
  • Figure 31: Latin America Market Value Share and BPS Analysis by Application, 2025 and 2035
  • Figure 32: Latin America Market Y-o-Y Growth Comparison by Application, 2025-2035
  • Figure 33: Latin America Market Attractiveness Analysis by Application
  • Figure 34: Western Europe Market Value Share and BPS Analysis by Country, 2025 and 2035
  • Figure 35: Western Europe Market Value Share and BPS Analysis by Product Type, 2025 and 2035
  • Figure 36: Western Europe Market Y-o-Y Growth Comparison by Product Type, 2025-2035
  • Figure 37: Western Europe Market Attractiveness Analysis by Product Type
  • Figure 38: Western Europe Market Value Share and BPS Analysis by Application, 2025 and 2035
  • Figure 39: Western Europe Market Y-o-Y Growth Comparison by Application, 2025-2035
  • Figure 40: Western Europe Market Attractiveness Analysis by Application
  • Figure 41: Eastern Europe Market Value Share and BPS Analysis by Country, 2025 and 2035
  • Figure 42: Eastern Europe Market Value Share and BPS Analysis by Product Type, 2025 and 2035
  • Figure 43: Eastern Europe Market Y-o-Y Growth Comparison by Product Type, 2025-2035
  • Figure 44: Eastern Europe Market Attractiveness Analysis by Product Type
  • Figure 45: Eastern Europe Market Value Share and BPS Analysis by Application, 2025 and 2035
  • Figure 46: Eastern Europe Market Y-o-Y Growth Comparison by Application, 2025-2035
  • Figure 47: Eastern Europe Market Attractiveness Analysis by Application
  • Figure 48: East Asia Market Value Share and BPS Analysis by Country, 2025 and 2035
  • Figure 49: East Asia Market Value Share and BPS Analysis by Product Type, 2025 and 2035
  • Figure 50: East Asia Market Y-o-Y Growth Comparison by Product Type, 2025-2035
  • Figure 51: East Asia Market Attractiveness Analysis by Product Type
  • Figure 52: East Asia Market Value Share and BPS Analysis by Application, 2025 and 2035
  • Figure 53: East Asia Market Y-o-Y Growth Comparison by Application, 2025-2035
  • Figure 54: East Asia Market Attractiveness Analysis by Application
  • Figure 55: South Asia & Pacific Market Value Share and BPS Analysis by Country, 2025 and 2035
  • Figure 56: South Asia & Pacific Market Value Share and BPS Analysis by Product Type, 2025 and 2035
  • Figure 57: South Asia & Pacific Market Y-o-Y Growth Comparison by Product Type, 2025-2035
  • Figure 58: South Asia & Pacific Market Attractiveness Analysis by Product Type
  • Figure 59: South Asia & Pacific Market Value Share and BPS Analysis by Application, 2025 and 2035
  • Figure 60: South Asia & Pacific Market Y-o-Y Growth Comparison by Application, 2025-2035
  • Figure 61: South Asia & Pacific Market Attractiveness Analysis by Application
  • Figure 62: Middle East and Africa Market Value Share and BPS Analysis by Country, 2025 and 2035
  • Figure 63: Middle East and Africa Market Value Share and BPS Analysis by Product Type, 2025 and 2035
  • Figure 64: Middle East and Africa Market Y-o-Y Growth Comparison by Product Type, 2025-2035
  • Figure 65: Middle East and Africa Market Attractiveness Analysis by Product Type
  • Figure 66: Middle East and Africa Market Value Share and BPS Analysis by Application, 2025 and 2035
  • Figure 67: Middle East and Africa Market Y-o-Y Growth Comparison by Application, 2025-2035
  • Figure 68: Middle East and Africa Market Attractiveness Analysis by Application
  • Figure 69: Global Market - Tier Structure Analysis
  • Figure 70: Global Market - Company Share Analysis

Frequently Asked Questions

What is the estimated market size of the fermented dairy ingredient industry in 2025?

The industry is valued at USD 9.2 billion in 2025.

What is the projected industry size of the fermented dairy ingredient industry by 2035?

It is forecasted to reach USD 20.4 billion by 2035.

What is the expected CAGR for the fermented dairy ingredient industry between 2025 and 2035?

The industry is anticipated to grow at a CAGR of 8.3% during this period.

Which segment is expected to lead the fermented dairy ingredient market in 2025?

Dairy is projected to lead the market with a 52.6% share in 2025.

Which region is expected to witness the highest growth in the fermented dairy ingredient market?

Asia Pacific, particularly China, is expected to be the key growth region with a projected growth rate of 10.9%.

Explore Similar Insights

Future Market Insights

Fermented Dairy Ingredient Market