Reports

- Global Locations -

Headquarters

Future Market Insights, Inc.

Christiana Corporate, 200
Continental Drive, Suite 401,
Newark, Delaware - 19713,
United States

T: +1-845-579-5705

Americas

Future Market Insights, Inc.

616 Corporate Way, Suite 2-9018,
Valley Cottage, NY 10989, United States

T: +1-347-918-3531

MEA

Future Market Insights

1602-6 Jumeirah Bay X2 Tower, Plot No: JLT-PH2-X2A,
Jumeirah Lakes Towers, Dubai,
United Arab Emirates

Europe

Future Market Insights

3rd Floor, 207 Regent Street,
W1B 3HH London
United Kingdom

T: + 44 (0) 20 8123 9659
D: +44 (0) 20 3287 4268

Asia Pacific

Future Market Insights

IndiaLand Global Tech Park, Unit UG-1, Behind Grand HighStreet, Phase 1, Hinjawadi, MH, Pune – 411057, India

Fermented Chymosin Market Outlook (2022-2032)

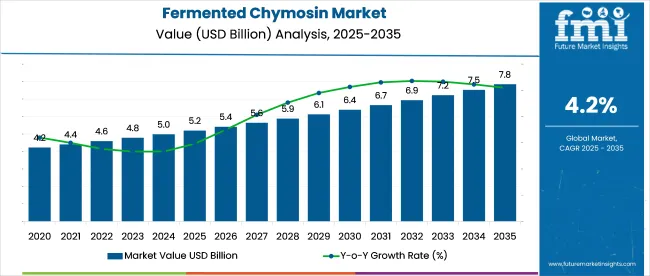
[333 Pages Report] The global fermented chymosin market is expected to gather a revenue of nearly US$ 6.7 billion by 2032, up from US$ 4.6 billion in 2022. The market is said to register a CAGR of 3.5% during the forecast period of 2022 to 2032.

The sales of fermented chymosin are anticipated to soar owing to the increasing vegan population across the world. One of the key factors, such as a surge in demand for cheese because of its nutritional characteristics, is promoting the growth of the global fermented chymosin market.

Report Attribute Details
Fermented Chymosin Market Value (2022) US$ 4.6 Billion
Fermented Chymosin Market Anticipated Forecast Value (2032) US$ 6.7 Billion
Fermented Chymosin Market Projected Growth Rate (2022-2032) 3.5%

Chymosin, also termed rennin, is a proteolytic enzyme associated with pepsin which is synthesized by chief cells in the stomach of some animals. Fermented chymosin is an enzyme that coagulates and clots milk. This enzyme is majorly used for producing cheese across the world.

The global sales of fermented chymosin are on the surge as consumption of cheese is increasing each day; it is indeed a globally loved food product. Fermented chymosin is an outstanding coagulant that is produced by the process of fermentation.

Aspergillus niger and Saccharomyces (Kluyveromyces) lactis are the two micro-organisms that are generally used for producing fermented chymosin. Some manufacturers make fermented chymosin with the help of recombinant DNA technology. In this case, genes are needed for the producing the chymosin enzyme, which is inserted in the micro-organisms. This is further used to produce chymosin by fermentation technique.

There is more awareness about chymosin's nutritional properties, which will boost the global fermented chymosin market growth. Additionally, increased consumption of cheese in various products contributes to the growth of the market. The demand for fermented chymosin is said to grow due to market boosting factors such as an increase in per capita and development in living standards across the world.

Don't pay for what you don't need

Customize your report by selecting specific countries or regions and save 30%!

Which are the Primary Factors Driving the Fermented Chymosin Market?

One of the key factors driving the global fermented chymosin market is the rising vegan population across the world. Globally, introduction of developed and enhanced methods of producing cost-efficient fermented chymosin, increasing food and beverage MNCs, and upsurge in fast-food chains is speeding up the sales of fermented chymosin and thereby contributing to a lucrative market growth.

According to a study by Vegetarian Times, nearly 7.3 million people which is 3.2% of adults in the United States follow a vegetarian-based diet. Out of these, around one million people do not eat or drink any animal products. This proves that the number of vegan populations is rising across the world. This increase in flexitarian and vegan population is anticipated to have a lucrative impact on the global fermented chymosin market.

The major concern for the cheese manufacturers is to enhance the taste, texture, whey value, and slice ability of cheese to meet the increasing demand of the consumers. This increasing need for cheese is anticipated serve as a market growing driver for fermented chymosin market.

Therefore, fermented chymosin functions as a well-suited coagulant as it improves the texture and enhances the taste of the cheese. Furthermore, among consumers there is more health awareness and therefore, manufacturers are trying to create fermented chymosin which assists in lowering the salt content of cheese. As an opportunity, the manufacturers of cheese can develop cheese with low salt content to attract more consumers who are health conscious.

Lastly, developing market for low-fat cheese and several improvements to better the quality and taste of the products deliver novel opportunities for growth to the manufacturers functioning in the global fermented chymosin market.

Which are the Key Regions Dominating the Fermented Chymosin Market?

Region-wise, Asia Pacific is said to gain maximum demand for cheese, which is predicted to boost the sales of fermented chymosin in this region. Several factors contribute to the growth in this region, such as the influence of western culture, an increase in demand for fast food, increased disposable income, and a bigger youth population.

The Asia Pacific is also witnessing an increase in the vegan population. Therefore, ascending vegan population and increasing demand for cheese are predicted to generate an opportunity for the manufacturers of fermented chymosin to sustain themselves in this region.

North America and Europe, too, have a higher consumption of cheese; however, the altering preferences of the consumers are said to have a lucrative effect on the fermented chymosin market. In countries like the United Kingdom, there is a surge in cheese production complimented by higher consumption. For example, the UK Dairy trade association mentioned that in 2021, nearly 504 thousand metric tons of cheese were manufactured in the country.

The increasing cheese manufacturing industry uses technologically advanced process and new production methods; these combined is projected to increase the demand for fermented chymosin in countries such as France, Germany, Russia, and Italy from the Europe region.

Nandini Roy Choudhury

Principal Consultant

Talk to Analyst

Find your sweet spots for generating winning opportunities in this market.

What is the Competitive Analysis of the Fermented Chymosin Market?

Some if the key manufacturers of the fermented chymosin that identified across the value chain of Fermented Chymosin market are – Hansen A/S, Koninklijke DSM N.V., Maysa Gida, Mayasan AS, and Nelson-Jameson.

Acquisition and expansion are the key strategic methods followed by a few primary players to broaden their business and make a global footprint. Crucial market players are constantly depending on invention and expansion of products. Enormous investment in research and development has been experienced in the past few years and this has resulted in invention of several products developments in the market.

In September 2021, DSM, a global science-based company announced its strategic decision to completely aim its resources and abilities to focus the vital environmental and societal challenges related to the manner the global population produces and consumes food.

Report Scope

Report Attribute Details
Growth Rate CAGR of 3.5% from 2022 to 2032
Base Year for Estimation 2021
Historical Data 2015-2020
Forecast Period 2022-2032
Quantitative Units Revenue in USD Million, and CAGR from 2022-2032
Report Coverage Revenue Forecast, Volume Forecast, Company Ranking, Competitive Landscape, Growth Factors, Trends and Pricing Analysis
Segments Covered
  • Form
  • End Use
  • Sales Channel
  • Region
Regions Covered
  • North America
  • Latin America
  • Western Europe
  • Eastern Europe
  • Asia Pacific
  • Japan
  • Middle East and Africa
Key Countries Profiled
  • U.S
  • Canada
  • Brazil
  • Argentina
  • Germany
  • U.K
  • France
  • Spain
  • Italy
  • Nordics
  • BENELUX
  • Australia & New Zealand
  • China
  • India
  • ASEAN
  • GCC
  • South Africa
Key Companies Profiled
Customization Available Upon Request

Get the data you need at a Fraction of the cost

Personalize your report by choosing insights you need
and save 40%!

Key Segments Profiled in the Fermented Chymosin Market Survey

By Form:

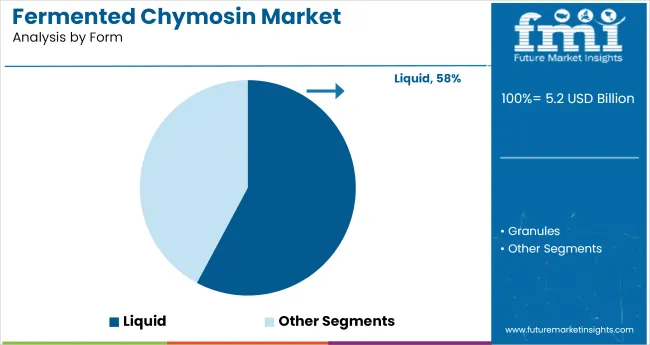
  • Liquid
  • Granules

By End Use:

  • Food Processing
  • Pharmaceutical Industry
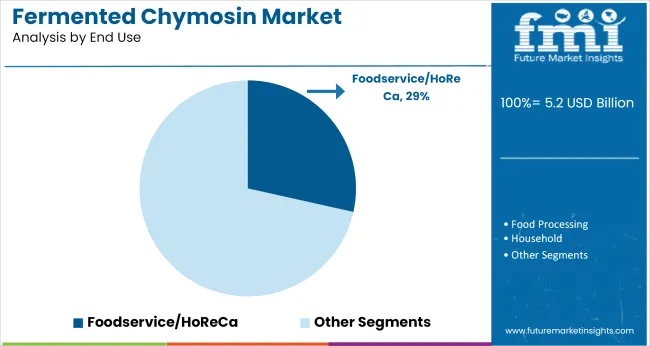
  • Foodservice/HoReCa (Hotels/Restaurants/Café)
  • Household

By Sales Channel:

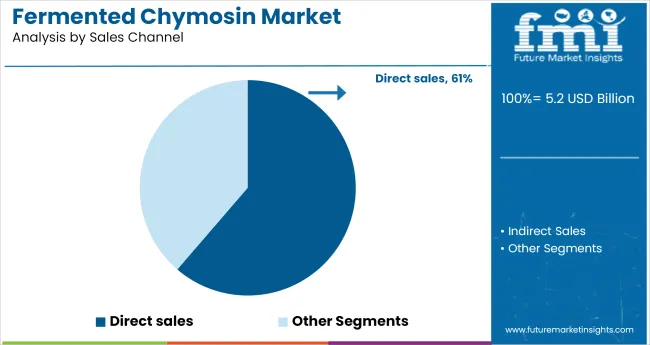
  • Direct Sales
  • Indirect Sales
  • Hypermarkets/Supermarkets
  • Wholesalers
  • Specialty Stores
  • Online Retailers

By Region:

  • North America
  • Latin America
  • Western Europe
  • Eastern Europe
  • Asia Pacific
  • Japan
  • Middle East and Africa

Frequently Asked Questions

What is the Growth Outlook for the Fermented Chymosin Market?

The global fermented chymosin market is set to advance at a CAGR of 3.5% from 2022 to 2032.

Which Region is Likely to Hold a Major Fermented Chymosin Market Share?

Asia Pacific is likely to hold a major fermented chymosin market share during the forecast period.

Who are a Few Key Players in the Fermented Chymosin Market?

Some of the key players in the global fermented chymosin market are Hansen A/S, Koninklijke DSM N.V., Maysa Gida, Mayasan AS, and Nelson-Jameson.

Table of Content

1. Executive Summary

    1.1. Global Market Outlook

    1.2. Demand-side Trends

    1.3. Supply-side Trends

    1.4. Technology Roadmap Analysis

    1.5. Analysis and Recommendations

2. Market Overview

    2.1. Market Coverage / Taxonomy

    2.2. Market Definition / Scope / Limitations

3. Market Background

    3.1. Market Dynamics

        3.1.1. Drivers

        3.1.2. Restraints

        3.1.3. Opportunity

        3.1.4. Trends

    3.2. Scenario Forecast

        3.2.1. Demand in Optimistic Scenario

        3.2.2. Demand in Likely Scenario

        3.2.3. Demand in Conservative Scenario

    3.3. Opportunity Map Analysis

    3.4. Product Life Cycle Analysis

    3.5. Supply Chain Analysis

        3.5.1. Supply Side Participants and their Roles

            3.5.1.1. Producers

            3.5.1.2. Mid-Level Participants (Traders/ Agents/ Brokers)

            3.5.1.3. Wholesalers and Distributors

        3.5.2. Value Added and Value Created at Node in the Supply Chain

        3.5.3. List of Raw Material Suppliers

        3.5.4. List of Existing and Potential Buyer’s

    3.6. Investment Feasibility Matrix

    3.7. Value Chain Analysis

        3.7.1. Profit Margin Analysis

        3.7.2. Wholesalers and Distributors

        3.7.3. Retailers

    3.8. PESTLE and Porter’s Analysis

    3.9. Regulatory Landscape

        3.9.1. By Key Regions

        3.9.2. By Key Countries

    3.10. Regional Parent Market Outlook

    3.11. Production and Consumption Statistics

    3.12. Import and Export Statistics

4. Global Fermented Chymosin Market Analysis 2017-2021 and Forecast, 2022-2032

    4.1. Historical Market Size Value (US$ Mn) & Volume (Tons) Analysis, 2017-2021

    4.2. Current and Future Market Size Value (US$ Mn) & Volume (Tons) Projections, 2022-2032

        4.2.1. Y-o-Y Growth Trend Analysis

        4.2.2. Absolute $ Opportunity Analysis

5. Global Fermented Chymosin Market Analysis 2017-2021 and Forecast 2022-2032, By Form

    5.1. Introduction / Key Findings

    5.2. Historical Market Size Value (US$ Mn) & Volume (Tons) Analysis By Form, 2017-2021

    5.3. Current and Future Market Size Value (US$ Mn) & Volume (Tons) Analysis and Forecast By Form, 2022-2032

        5.3.1. Liquid

        5.3.2. Granules

    5.4. Y-o-Y Growth Trend Analysis By Form, 2017-2021

    5.5. Absolute $ Opportunity Analysis By Form, 2022-2032

6. Global Fermented Chymosin Market Analysis 2017-2021 and Forecast 2022-2032, By End-use

    6.1. Introduction / Key Findings

    6.2. Historical Market Size Value (US$ Mn) & Volume (Tons) Analysis By End-use, 2017-2021

    6.3. Current and Future Market Size Value (US$ Mn) & Volume (Tons) Analysis and Forecast By End-use, 2022-2032

        6.3.1. Food Processing

        6.3.2. Pharmaceutical Industry

        6.3.3. Foodservice/HoReCa

        6.3.4. Household

    6.4. Y-o-Y Growth Trend Analysis By End-use, 2017-2021

    6.5. Absolute $ Opportunity Analysis By End-use, 2022-2032

7. Global Fermented Chymosin Market Analysis 2017-2021 and Forecast 2022-2032, By Sales Channel

    7.1. Introduction / Key Findings

    7.2. Historical Market Size Value (US$ Mn) & Volume (Tons) Analysis By Sales Channel, 2017-2021

    7.3. Current and Future Market Size Value (US$ Mn) & Volume (Tons) Analysis and Forecast By Sales Channel, 2022-2032

        7.3.1. Direct Sales

        7.3.2. Indirect Sales

        7.3.3. Hypermarkets/Supermarkets

        7.3.4. Wholesalers

        7.3.5. Specialty Stores

        7.3.6. Online Retailers

    7.4. Y-o-Y Growth Trend Analysis By Sales Channel, 2017-2021

    7.5. Absolute $ Opportunity Analysis By Sales Channel, 2022-2032

8. Global Fermented Chymosin Market Analysis 2017-2021 and Forecast 2022-2032, By Region

    8.1. Introduction

    8.2. Historical Market Size Value (US$ Mn) & Volume (Tons) Analysis By Region, 2017-2021

    8.3. Current Market Size Value (US$ Mn) & Volume (Tons) Analysis and Forecast By Region, 2022-2032

        8.3.1. North America

        8.3.2. Latin America

        8.3.3. Europe

        8.3.4. East Asia

        8.3.5. South Asia & Pacific

        8.3.6. MEA

    8.4. Market Attractiveness Analysis By Region

9. North America Fermented Chymosin Market Analysis 2017-2021 and Forecast 2022-2032, By Country

    9.1. Historical Market Size Value (US$ Mn) & Volume (Tons) Trend Analysis By Market Taxonomy, 2017-2021

    9.2. Market Size Value (US$ Mn) & Volume (Tons) Forecast By Market Taxonomy, 2022-2032

        9.2.1. By Country

            9.2.1.1. U.S.

            9.2.1.2. Canada

        9.2.2. By Form

        9.2.3. By End-use

        9.2.4. By Sales Channel

    9.3. Market Attractiveness Analysis

        9.3.1. By Country

        9.3.2. By Form

        9.3.3. By End-use

        9.3.4. By Sales Channel

    9.4. Key Takeaways

10. Latin America Fermented Chymosin Market Analysis 2017-2021 and Forecast 2022-2032, By Country

    10.1. Historical Market Size Value (US$ Mn) & Volume (Tons) Trend Analysis By Market Taxonomy, 2017-2021

    10.2. Market Size Value (US$ Mn) & Volume (Tons) Forecast By Market Taxonomy, 2022-2032

        10.2.1. By Country

            10.2.1.1. Brazil

            10.2.1.2. Mexico

            10.2.1.3. Rest of Latin America

        10.2.2. By Form

        10.2.3. By End-use

        10.2.4. By Sales Channel

    10.3. Market Attractiveness Analysis

        10.3.1. By Country

        10.3.2. By Form

        10.3.3. By End-use

        10.3.4. By Sales Channel

    10.4. Key Takeaways

11. Europe Fermented Chymosin Market Analysis 2017-2021 and Forecast 2022-2032, By Country

    11.1. Historical Market Size Value (US$ Mn) & Volume (Tons) Trend Analysis By Market Taxonomy, 2017-2021

    11.2. Market Size Value (US$ Mn) & Volume (Tons) Forecast By Market Taxonomy, 2022-2032

        11.2.1. By Country

            11.2.1.1. Germany

            11.2.1.2. U.K.

            11.2.1.3. France

            11.2.1.4. Spain

            11.2.1.5. Italy

            11.2.1.6. Rest of Europe

        11.2.2. By Form

        11.2.3. By End-use

        11.2.4. By Sales Channel

    11.3. Market Attractiveness Analysis

        11.3.1. By Country

        11.3.2. By Form

        11.3.3. By End-use

        11.3.4. By Sales Channel

    11.4. Key Takeaways

12. East Asia Fermented Chymosin Market Analysis 2017-2021 and Forecast 2022-2032, By Country

    12.1. Historical Market Size Value (US$ Mn) & Volume (Tons) Trend Analysis By Market Taxonomy, 2017-2021

    12.2. Market Size Value (US$ Mn) & Volume (Tons) Forecast By Market Taxonomy, 2022-2032

        12.2.1. By Country

            12.2.1.1. China

            12.2.1.2. Japan

            12.2.1.3. South Korea

        12.2.2. By Form

        12.2.3. By End-use

        12.2.4. By Sales Channel

    12.3. Market Attractiveness Analysis

        12.3.1. By Country

        12.3.2. By Form

        12.3.3. By End-use

        12.3.4. By Sales Channel

    12.4. Key Takeaways

13. South Asia & Pacific Fermented Chymosin Market Analysis 2017-2021 and Forecast 2022-2032, By Country

    13.1. Historical Market Size Value (US$ Mn) & Volume (Tons) Trend Analysis By Market Taxonomy, 2017-2021

    13.2. Market Size Value (US$ Mn) & Volume (Tons) Forecast By Market Taxonomy, 2022-2032

        13.2.1. By Country

            13.2.1.1. India

            13.2.1.2. Thailand

            13.2.1.3. Indonesia

            13.2.1.4. Malaysia

            13.2.1.5. Singapore

            13.2.1.6. Australia

            13.2.1.7. New Zealand

            13.2.1.8. Rest of South Asia & Pacific

        13.2.2. By Form

        13.2.3. By End-use

        13.2.4. By Sales Channel

    13.3. Market Attractiveness Analysis

        13.3.1. By Country

        13.3.2. By Form

        13.3.3. By End-use

        13.3.4. By Sales Channel

    13.4. Key Takeaways

14. MEA Fermented Chymosin Market Analysis 2017-2021 and Forecast 2022-2032, By Country

    14.1. Historical Market Size Value (US$ Mn) & Volume (Tons) Trend Analysis By Market Taxonomy, 2017-2021

    14.2. Market Size Value (US$ Mn) & Volume (Tons) Forecast By Market Taxonomy, 2022-2032

        14.2.1. By Country

            14.2.1.1. GCC Countries

            14.2.1.2. South Africa

            14.2.1.3. Israel

            14.2.1.4. Rest of MEA

        14.2.2. By Form

        14.2.3. By End-use

        14.2.4. By Sales Channel

    14.3. Market Attractiveness Analysis

        14.3.1. By Country

        14.3.2. By Form

        14.3.3. By End-use

        14.3.4. By Sales Channel

    14.4. Key Takeaways

15. Key Countries Fermented Chymosin Market Analysis

    15.1. U.S.

        15.1.1. Pricing Analysis

        15.1.2. Market Share Analysis, 2021

            15.1.2.1. By Form

            15.1.2.2. By End-use

            15.1.2.3. By Sales Channel

    15.2. Canada

        15.2.1. Pricing Analysis

        15.2.2. Market Share Analysis, 2021

            15.2.2.1. By Form

            15.2.2.2. By End-use

            15.2.2.3. By Sales Channel

    15.3. Brazil

        15.3.1. Pricing Analysis

        15.3.2. Market Share Analysis, 2021

            15.3.2.1. By Form

            15.3.2.2. By End-use

            15.3.2.3. By Sales Channel

    15.4. Mexico

        15.4.1. Pricing Analysis

        15.4.2. Market Share Analysis, 2021

            15.4.2.1. By Form

            15.4.2.2. By End-use

            15.4.2.3. By Sales Channel

    15.5. Germany

        15.5.1. Pricing Analysis

        15.5.2. Market Share Analysis, 2021

            15.5.2.1. By Form

            15.5.2.2. By End-use

            15.5.2.3. By Sales Channel

    15.6. U.K.

        15.6.1. Pricing Analysis

        15.6.2. Market Share Analysis, 2021

            15.6.2.1. By Form

            15.6.2.2. By End-use

            15.6.2.3. By Sales Channel

    15.7. France

        15.7.1. Pricing Analysis

        15.7.2. Market Share Analysis, 2021

            15.7.2.1. By Form

            15.7.2.2. By End-use

            15.7.2.3. By Sales Channel

    15.8. Spain

        15.8.1. Pricing Analysis

        15.8.2. Market Share Analysis, 2021

            15.8.2.1. By Form

            15.8.2.2. By End-use

            15.8.2.3. By Sales Channel

    15.9. Italy

        15.9.1. Pricing Analysis

        15.9.2. Market Share Analysis, 2021

            15.9.2.1. By Form

            15.9.2.2. By End-use

            15.9.2.3. By Sales Channel

    15.10. China

        15.10.1. Pricing Analysis

        15.10.2. Market Share Analysis, 2021

            15.10.2.1. By Form

            15.10.2.2. By End-use

            15.10.2.3. By Sales Channel

    15.11. Japan

        15.11.1. Pricing Analysis

        15.11.2. Market Share Analysis, 2021

            15.11.2.1. By Form

            15.11.2.2. By End-use

            15.11.2.3. By Sales Channel

    15.12. South Korea

        15.12.1. Pricing Analysis

        15.12.2. Market Share Analysis, 2021

            15.12.2.1. By Form

            15.12.2.2. By End-use

            15.12.2.3. By Sales Channel

    15.13. India

        15.13.1. Pricing Analysis

        15.13.2. Market Share Analysis, 2021

            15.13.2.1. By Form

            15.13.2.2. By End-use

            15.13.2.3. By Sales Channel

    15.14. Thailand

        15.14.1. Pricing Analysis

        15.14.2. Market Share Analysis, 2021

            15.14.2.1. By Form

            15.14.2.2. By End-use

            15.14.2.3. By Sales Channel

    15.15. Indonesia

        15.15.1. Pricing Analysis

        15.15.2. Market Share Analysis, 2021

            15.15.2.1. By Form

            15.15.2.2. By End-use

            15.15.2.3. By Sales Channel

    15.16. Malaysia

        15.16.1. Pricing Analysis

        15.16.2. Market Share Analysis, 2021

            15.16.2.1. By Form

            15.16.2.2. By End-use

            15.16.2.3. By Sales Channel

    15.17. Singapore

        15.17.1. Pricing Analysis

        15.17.2. Market Share Analysis, 2021

            15.17.2.1. By Form

            15.17.2.2. By End-use

            15.17.2.3. By Sales Channel

    15.18. Australia

        15.18.1. Pricing Analysis

        15.18.2. Market Share Analysis, 2021

            15.18.2.1. By Form

            15.18.2.2. By End-use

            15.18.2.3. By Sales Channel

    15.19. New Zealand

        15.19.1. Pricing Analysis

        15.19.2. Market Share Analysis, 2021

            15.19.2.1. By Form

            15.19.2.2. By End-use

            15.19.2.3. By Sales Channel

    15.20. GCC Countries

        15.20.1. Pricing Analysis

        15.20.2. Market Share Analysis, 2021

            15.20.2.1. By Form

            15.20.2.2. By End-use

            15.20.2.3. By Sales Channel

    15.21. South Africa

        15.21.1. Pricing Analysis

        15.21.2. Market Share Analysis, 2021

            15.21.2.1. By Form

            15.21.2.2. By End-use

            15.21.2.3. By Sales Channel

    15.22. Israel

        15.22.1. Pricing Analysis

        15.22.2. Market Share Analysis, 2021

            15.22.2.1. By Form

            15.22.2.2. By End-use

            15.22.2.3. By Sales Channel

16. Market Structure Analysis

    16.1. Competition Dashboard

    16.2. Competition Benchmarking

    16.3. Market Share Analysis of Top Players

        16.3.1. By Regional

        16.3.2. By Form

        16.3.3. By End-use

        16.3.4. By Sales Channel

17. Competition Analysis

    17.1. Competition Deep Dive

        17.1.1. Hansen A/S

            17.1.1.1. Overview

            17.1.1.2. Product Portfolio

            17.1.1.3. Profitability by Market Segments

            17.1.1.4. Sales Footprint

            17.1.1.5. Strategy Overview

                17.1.1.5.1. Marketing Strategy

                17.1.1.5.2. Product Strategy

                17.1.1.5.3. Channel Strategy

        17.1.2. Koninklijke DSM N.V.

            17.1.2.1. Overview

            17.1.2.2. Product Portfolio

            17.1.2.3. Profitability by Market Segments

            17.1.2.4. Sales Footprint

            17.1.2.5. Strategy Overview

                17.1.2.5.1. Marketing Strategy

                17.1.2.5.2. Product Strategy

                17.1.2.5.3. Channel Strategy

        17.1.3. Maysa Gida

            17.1.3.1. Overview

            17.1.3.2. Product Portfolio

            17.1.3.3. Profitability by Market Segments

            17.1.3.4. Sales Footprint

            17.1.3.5. Strategy Overview

                17.1.3.5.1. Marketing Strategy

                17.1.3.5.2. Product Strategy

                17.1.3.5.3. Channel Strategy

        17.1.4. Mayasan AS

            17.1.4.1. Overview

            17.1.4.2. Product Portfolio

            17.1.4.3. Profitability by Market Segments

            17.1.4.4. Sales Footprint

            17.1.4.5. Strategy Overview

                17.1.4.5.1. Marketing Strategy

                17.1.4.5.2. Product Strategy

                17.1.4.5.3. Channel Strategy

        17.1.5. Nelson-Jameson

            17.1.5.1. Overview

            17.1.5.2. Product Portfolio

            17.1.5.3. Profitability by Market Segments

            17.1.5.4. Sales Footprint

            17.1.5.5. Strategy Overview

                17.1.5.5.1. Marketing Strategy

                17.1.5.5.2. Product Strategy

                17.1.5.5.3. Channel Strategy

18. Assumptions & Acronyms Used

19. Research Methodology

Don't pay for what you don't need

Customize your report by selecting specific countries or regions and save 30%!

List of Tables

Table 1: Global Fermented Chymosin Market Value (US$ Mn) Forecast by Region, 2017-2032

Table 2: Global Fermented Chymosin Market Volume (Tons) Forecast by Region, 2017-2032

Table 3: Global Fermented Chymosin Market Value (US$ Mn) Forecast by Form, 2017-2032

Table 4: Global Fermented Chymosin Market Volume (Tons) Forecast by Form, 2017-2032

Table 5: Global Fermented Chymosin Market Value (US$ Mn) Forecast by End-use, 2017-2032

Table 6: Global Fermented Chymosin Market Volume (Tons) Forecast by End-use, 2017-2032

Table 7: Global Fermented Chymosin Market Value (US$ Mn) Forecast by Sales Channel, 2017-2032

Table 8: Global Fermented Chymosin Market Volume (Tons) Forecast by Sales Channel, 2017-2032

Table 9: North America Fermented Chymosin Market Value (US$ Mn) Forecast by Country, 2017-2032

Table 10: North America Fermented Chymosin Market Volume (Tons) Forecast by Country, 2017-2032

Table 11: North America Fermented Chymosin Market Value (US$ Mn) Forecast by Form, 2017-2032

Table 12: North America Fermented Chymosin Market Volume (Tons) Forecast by Form, 2017-2032

Table 13: North America Fermented Chymosin Market Value (US$ Mn) Forecast by End-use, 2017-2032

Table 14: North America Fermented Chymosin Market Volume (Tons) Forecast by End-use, 2017-2032

Table 15: North America Fermented Chymosin Market Value (US$ Mn) Forecast by Sales Channel, 2017-2032

Table 16: North America Fermented Chymosin Market Volume (Tons) Forecast by Sales Channel, 2017-2032

Table 17: Latin America Fermented Chymosin Market Value (US$ Mn) Forecast by Country, 2017-2032

Table 18: Latin America Fermented Chymosin Market Volume (Tons) Forecast by Country, 2017-2032

Table 19: Latin America Fermented Chymosin Market Value (US$ Mn) Forecast by Form, 2017-2032

Table 20: Latin America Fermented Chymosin Market Volume (Tons) Forecast by Form, 2017-2032

Table 21: Latin America Fermented Chymosin Market Value (US$ Mn) Forecast by End-use, 2017-2032

Table 22: Latin America Fermented Chymosin Market Volume (Tons) Forecast by End-use, 2017-2032

Table 23: Latin America Fermented Chymosin Market Value (US$ Mn) Forecast by Sales Channel, 2017-2032

Table 24: Latin America Fermented Chymosin Market Volume (Tons) Forecast by Sales Channel, 2017-2032

Table 25: Europe Fermented Chymosin Market Value (US$ Mn) Forecast by Country, 2017-2032

Table 26: Europe Fermented Chymosin Market Volume (Tons) Forecast by Country, 2017-2032

Table 27: Europe Fermented Chymosin Market Value (US$ Mn) Forecast by Form, 2017-2032

Table 28: Europe Fermented Chymosin Market Volume (Tons) Forecast by Form, 2017-2032

Table 29: Europe Fermented Chymosin Market Value (US$ Mn) Forecast by End-use, 2017-2032

Table 30: Europe Fermented Chymosin Market Volume (Tons) Forecast by End-use, 2017-2032

Table 31: Europe Fermented Chymosin Market Value (US$ Mn) Forecast by Sales Channel, 2017-2032

Table 32: Europe Fermented Chymosin Market Volume (Tons) Forecast by Sales Channel, 2017-2032

Table 33: East Asia Fermented Chymosin Market Value (US$ Mn) Forecast by Country, 2017-2032

Table 34: East Asia Fermented Chymosin Market Volume (Tons) Forecast by Country, 2017-2032

Table 35: East Asia Fermented Chymosin Market Value (US$ Mn) Forecast by Form, 2017-2032

Table 36: East Asia Fermented Chymosin Market Volume (Tons) Forecast by Form, 2017-2032

Table 37: East Asia Fermented Chymosin Market Value (US$ Mn) Forecast by End-use, 2017-2032

Table 38: East Asia Fermented Chymosin Market Volume (Tons) Forecast by End-use, 2017-2032

Table 39: East Asia Fermented Chymosin Market Value (US$ Mn) Forecast by Sales Channel, 2017-2032

Table 40: East Asia Fermented Chymosin Market Volume (Tons) Forecast by Sales Channel, 2017-2032

Table 41: South Asia & Pacific Fermented Chymosin Market Value (US$ Mn) Forecast by Country, 2017-2032

Table 42: South Asia & Pacific Fermented Chymosin Market Volume (Tons) Forecast by Country, 2017-2032

Table 43: South Asia & Pacific Fermented Chymosin Market Value (US$ Mn) Forecast by Form, 2017-2032

Table 44: South Asia & Pacific Fermented Chymosin Market Volume (Tons) Forecast by Form, 2017-2032

Table 45: South Asia & Pacific Fermented Chymosin Market Value (US$ Mn) Forecast by End-use, 2017-2032

Table 46: South Asia & Pacific Fermented Chymosin Market Volume (Tons) Forecast by End-use, 2017-2032

Table 47: South Asia & Pacific Fermented Chymosin Market Value (US$ Mn) Forecast by Sales Channel, 2017-2032

Table 48: South Asia & Pacific Fermented Chymosin Market Volume (Tons) Forecast by Sales Channel, 2017-2032

Table 49: MEA Fermented Chymosin Market Value (US$ Mn) Forecast by Country, 2017-2032

Table 50: MEA Fermented Chymosin Market Volume (Tons) Forecast by Country, 2017-2032

Table 51: MEA Fermented Chymosin Market Value (US$ Mn) Forecast by Form, 2017-2032

Table 52: MEA Fermented Chymosin Market Volume (Tons) Forecast by Form, 2017-2032

Table 53: MEA Fermented Chymosin Market Value (US$ Mn) Forecast by End-use, 2017-2032

Table 54: MEA Fermented Chymosin Market Volume (Tons) Forecast by End-use, 2017-2032

Table 55: MEA Fermented Chymosin Market Value (US$ Mn) Forecast by Sales Channel, 2017-2032

Table 56: MEA Fermented Chymosin Market Volume (Tons) Forecast by Sales Channel, 2017-2032
Nandini Roy Choudhury

Principal Consultant

Talk to Analyst

Find your sweet spots for generating winning opportunities in this market.

List of Charts

Figure 1: Global Fermented Chymosin Market Value (US$ Mn) by Form, 2022-2032

Figure 2: Global Fermented Chymosin Market Value (US$ Mn) by End-use, 2022-2032

Figure 3: Global Fermented Chymosin Market Value (US$ Mn) by Sales Channel, 2022-2032

Figure 4: Global Fermented Chymosin Market Value (US$ Mn) by Region, 2022-2032

Figure 5: Global Fermented Chymosin Market Value (US$ Mn) Analysis by Region, 2017-2032

Figure 6: Global Fermented Chymosin Market Volume (Tons) Analysis by Region, 2017-2032

Figure 7: Global Fermented Chymosin Market Value Share (%) and BPS Analysis by Region, 2022-2032

Figure 8: Global Fermented Chymosin Market Y-o-Y Growth (%) Projections by Region, 2022-2032

Figure 9: Global Fermented Chymosin Market Value (US$ Mn) Analysis by Form, 2017-2032

Figure 10: Global Fermented Chymosin Market Volume (Tons) Analysis by Form, 2017-2032

Figure 11: Global Fermented Chymosin Market Value Share (%) and BPS Analysis by Form, 2022-2032

Figure 12: Global Fermented Chymosin Market Y-o-Y Growth (%) Projections by Form, 2022-2032

Figure 13: Global Fermented Chymosin Market Value (US$ Mn) Analysis by End-use, 2017-2032

Figure 14: Global Fermented Chymosin Market Volume (Tons) Analysis by End-use, 2017-2032

Figure 15: Global Fermented Chymosin Market Value Share (%) and BPS Analysis by End-use, 2022-2032

Figure 16: Global Fermented Chymosin Market Y-o-Y Growth (%) Projections by End-use, 2022-2032

Figure 17: Global Fermented Chymosin Market Value (US$ Mn) Analysis by Sales Channel, 2017-2032

Figure 18: Global Fermented Chymosin Market Volume (Tons) Analysis by Sales Channel, 2017-2032

Figure 19: Global Fermented Chymosin Market Value Share (%) and BPS Analysis by Sales Channel, 2022-2032

Figure 20: Global Fermented Chymosin Market Y-o-Y Growth (%) Projections by Sales Channel, 2022-2032

Figure 21: Global Fermented Chymosin Market Attractiveness by Form, 2022-2032

Figure 22: Global Fermented Chymosin Market Attractiveness by End-use, 2022-2032

Figure 23: Global Fermented Chymosin Market Attractiveness by Sales Channel, 2022-2032

Figure 24: Global Fermented Chymosin Market Attractiveness by Region, 2022-2032

Figure 25: North America Fermented Chymosin Market Value (US$ Mn) by Form, 2022-2032

Figure 26: North America Fermented Chymosin Market Value (US$ Mn) by End-use, 2022-2032

Figure 27: North America Fermented Chymosin Market Value (US$ Mn) by Sales Channel, 2022-2032

Figure 28: North America Fermented Chymosin Market Value (US$ Mn) by Country, 2022-2032

Figure 29: North America Fermented Chymosin Market Value (US$ Mn) Analysis by Country, 2017-2032

Figure 30: North America Fermented Chymosin Market Volume (Tons) Analysis by Country, 2017-2032

Figure 31: North America Fermented Chymosin Market Value Share (%) and BPS Analysis by Country, 2022-2032

Figure 32: North America Fermented Chymosin Market Y-o-Y Growth (%) Projections by Country, 2022-2032

Figure 33: North America Fermented Chymosin Market Value (US$ Mn) Analysis by Form, 2017-2032

Figure 34: North America Fermented Chymosin Market Volume (Tons) Analysis by Form, 2017-2032

Figure 35: North America Fermented Chymosin Market Value Share (%) and BPS Analysis by Form, 2022-2032

Figure 36: North America Fermented Chymosin Market Y-o-Y Growth (%) Projections by Form, 2022-2032

Figure 37: North America Fermented Chymosin Market Value (US$ Mn) Analysis by End-use, 2017-2032

Figure 38: North America Fermented Chymosin Market Volume (Tons) Analysis by End-use, 2017-2032

Figure 39: North America Fermented Chymosin Market Value Share (%) and BPS Analysis by End-use, 2022-2032

Figure 40: North America Fermented Chymosin Market Y-o-Y Growth (%) Projections by End-use, 2022-2032

Figure 41: North America Fermented Chymosin Market Value (US$ Mn) Analysis by Sales Channel, 2017-2032

Figure 42: North America Fermented Chymosin Market Volume (Tons) Analysis by Sales Channel, 2017-2032

Figure 43: North America Fermented Chymosin Market Value Share (%) and BPS Analysis by Sales Channel, 2022-2032

Figure 44: North America Fermented Chymosin Market Y-o-Y Growth (%) Projections by Sales Channel, 2022-2032

Figure 45: North America Fermented Chymosin Market Attractiveness by Form, 2022-2032

Figure 46: North America Fermented Chymosin Market Attractiveness by End-use, 2022-2032

Figure 47: North America Fermented Chymosin Market Attractiveness by Sales Channel, 2022-2032

Figure 48: North America Fermented Chymosin Market Attractiveness by Country, 2022-2032

Figure 49: Latin America Fermented Chymosin Market Value (US$ Mn) by Form, 2022-2032

Figure 50: Latin America Fermented Chymosin Market Value (US$ Mn) by End-use, 2022-2032

Figure 51: Latin America Fermented Chymosin Market Value (US$ Mn) by Sales Channel, 2022-2032

Figure 52: Latin America Fermented Chymosin Market Value (US$ Mn) by Country, 2022-2032

Figure 53: Latin America Fermented Chymosin Market Value (US$ Mn) Analysis by Country, 2017-2032

Figure 54: Latin America Fermented Chymosin Market Volume (Tons) Analysis by Country, 2017-2032

Figure 55: Latin America Fermented Chymosin Market Value Share (%) and BPS Analysis by Country, 2022-2032

Figure 56: Latin America Fermented Chymosin Market Y-o-Y Growth (%) Projections by Country, 2022-2032

Figure 57: Latin America Fermented Chymosin Market Value (US$ Mn) Analysis by Form, 2017-2032

Figure 58: Latin America Fermented Chymosin Market Volume (Tons) Analysis by Form, 2017-2032

Figure 59: Latin America Fermented Chymosin Market Value Share (%) and BPS Analysis by Form, 2022-2032

Figure 60: Latin America Fermented Chymosin Market Y-o-Y Growth (%) Projections by Form, 2022-2032

Figure 61: Latin America Fermented Chymosin Market Value (US$ Mn) Analysis by End-use, 2017-2032

Figure 62: Latin America Fermented Chymosin Market Volume (Tons) Analysis by End-use, 2017-2032

Figure 63: Latin America Fermented Chymosin Market Value Share (%) and BPS Analysis by End-use, 2022-2032

Figure 64: Latin America Fermented Chymosin Market Y-o-Y Growth (%) Projections by End-use, 2022-2032

Figure 65: Latin America Fermented Chymosin Market Value (US$ Mn) Analysis by Sales Channel, 2017-2032

Figure 66: Latin America Fermented Chymosin Market Volume (Tons) Analysis by Sales Channel, 2017-2032

Figure 67: Latin America Fermented Chymosin Market Value Share (%) and BPS Analysis by Sales Channel, 2022-2032

Figure 68: Latin America Fermented Chymosin Market Y-o-Y Growth (%) Projections by Sales Channel, 2022-2032

Figure 69: Latin America Fermented Chymosin Market Attractiveness by Form, 2022-2032

Figure 70: Latin America Fermented Chymosin Market Attractiveness by End-use, 2022-2032

Figure 71: Latin America Fermented Chymosin Market Attractiveness by Sales Channel, 2022-2032

Figure 72: Latin America Fermented Chymosin Market Attractiveness by Country, 2022-2032

Figure 73: Europe Fermented Chymosin Market Value (US$ Mn) by Form, 2022-2032

Figure 74: Europe Fermented Chymosin Market Value (US$ Mn) by End-use, 2022-2032

Figure 75: Europe Fermented Chymosin Market Value (US$ Mn) by Sales Channel, 2022-2032

Figure 76: Europe Fermented Chymosin Market Value (US$ Mn) by Country, 2022-2032

Figure 77: Europe Fermented Chymosin Market Value (US$ Mn) Analysis by Country, 2017-2032

Figure 78: Europe Fermented Chymosin Market Volume (Tons) Analysis by Country, 2017-2032

Figure 79: Europe Fermented Chymosin Market Value Share (%) and BPS Analysis by Country, 2022-2032

Figure 80: Europe Fermented Chymosin Market Y-o-Y Growth (%) Projections by Country, 2022-2032

Figure 81: Europe Fermented Chymosin Market Value (US$ Mn) Analysis by Form, 2017-2032

Figure 82: Europe Fermented Chymosin Market Volume (Tons) Analysis by Form, 2017-2032

Figure 83: Europe Fermented Chymosin Market Value Share (%) and BPS Analysis by Form, 2022-2032

Figure 84: Europe Fermented Chymosin Market Y-o-Y Growth (%) Projections by Form, 2022-2032

Figure 85: Europe Fermented Chymosin Market Value (US$ Mn) Analysis by End-use, 2017-2032

Figure 86: Europe Fermented Chymosin Market Volume (Tons) Analysis by End-use, 2017-2032

Figure 87: Europe Fermented Chymosin Market Value Share (%) and BPS Analysis by End-use, 2022-2032

Figure 88: Europe Fermented Chymosin Market Y-o-Y Growth (%) Projections by End-use, 2022-2032

Figure 89: Europe Fermented Chymosin Market Value (US$ Mn) Analysis by Sales Channel, 2017-2032

Figure 90: Europe Fermented Chymosin Market Volume (Tons) Analysis by Sales Channel, 2017-2032

Figure 91: Europe Fermented Chymosin Market Value Share (%) and BPS Analysis by Sales Channel, 2022-2032

Figure 92: Europe Fermented Chymosin Market Y-o-Y Growth (%) Projections by Sales Channel, 2022-2032

Figure 93: Europe Fermented Chymosin Market Attractiveness by Form, 2022-2032

Figure 94: Europe Fermented Chymosin Market Attractiveness by End-use, 2022-2032

Figure 95: Europe Fermented Chymosin Market Attractiveness by Sales Channel, 2022-2032

Figure 96: Europe Fermented Chymosin Market Attractiveness by Country, 2022-2032

Figure 97: East Asia Fermented Chymosin Market Value (US$ Mn) by Form, 2022-2032

Figure 98: East Asia Fermented Chymosin Market Value (US$ Mn) by End-use, 2022-2032

Figure 99: East Asia Fermented Chymosin Market Value (US$ Mn) by Sales Channel, 2022-2032

Figure 100: East Asia Fermented Chymosin Market Value (US$ Mn) by Country, 2022-2032

Figure 101: East Asia Fermented Chymosin Market Value (US$ Mn) Analysis by Country, 2017-2032

Figure 102: East Asia Fermented Chymosin Market Volume (Tons) Analysis by Country, 2017-2032

Figure 103: East Asia Fermented Chymosin Market Value Share (%) and BPS Analysis by Country, 2022-2032

Figure 104: East Asia Fermented Chymosin Market Y-o-Y Growth (%) Projections by Country, 2022-2032

Figure 105: East Asia Fermented Chymosin Market Value (US$ Mn) Analysis by Form, 2017-2032

Figure 106: East Asia Fermented Chymosin Market Volume (Tons) Analysis by Form, 2017-2032

Figure 107: East Asia Fermented Chymosin Market Value Share (%) and BPS Analysis by Form, 2022-2032

Figure 108: East Asia Fermented Chymosin Market Y-o-Y Growth (%) Projections by Form, 2022-2032

Figure 109: East Asia Fermented Chymosin Market Value (US$ Mn) Analysis by End-use, 2017-2032

Figure 110: East Asia Fermented Chymosin Market Volume (Tons) Analysis by End-use, 2017-2032

Figure 111: East Asia Fermented Chymosin Market Value Share (%) and BPS Analysis by End-use, 2022-2032

Figure 112: East Asia Fermented Chymosin Market Y-o-Y Growth (%) Projections by End-use, 2022-2032

Figure 113: East Asia Fermented Chymosin Market Value (US$ Mn) Analysis by Sales Channel, 2017-2032

Figure 114: East Asia Fermented Chymosin Market Volume (Tons) Analysis by Sales Channel, 2017-2032

Figure 115: East Asia Fermented Chymosin Market Value Share (%) and BPS Analysis by Sales Channel, 2022-2032

Figure 116: East Asia Fermented Chymosin Market Y-o-Y Growth (%) Projections by Sales Channel, 2022-2032

Figure 117: East Asia Fermented Chymosin Market Attractiveness by Form, 2022-2032

Figure 118: East Asia Fermented Chymosin Market Attractiveness by End-use, 2022-2032

Figure 119: East Asia Fermented Chymosin Market Attractiveness by Sales Channel, 2022-2032

Figure 120: East Asia Fermented Chymosin Market Attractiveness by Country, 2022-2032

Figure 121: South Asia & Pacific Fermented Chymosin Market Value (US$ Mn) by Form, 2022-2032

Figure 122: South Asia & Pacific Fermented Chymosin Market Value (US$ Mn) by End-use, 2022-2032

Figure 123: South Asia & Pacific Fermented Chymosin Market Value (US$ Mn) by Sales Channel, 2022-2032

Figure 124: South Asia & Pacific Fermented Chymosin Market Value (US$ Mn) by Country, 2022-2032

Figure 125: South Asia & Pacific Fermented Chymosin Market Value (US$ Mn) Analysis by Country, 2017-2032

Figure 126: South Asia & Pacific Fermented Chymosin Market Volume (Tons) Analysis by Country, 2017-2032

Figure 127: South Asia & Pacific Fermented Chymosin Market Value Share (%) and BPS Analysis by Country, 2022-2032

Figure 128: South Asia & Pacific Fermented Chymosin Market Y-o-Y Growth (%) Projections by Country, 2022-2032

Figure 129: South Asia & Pacific Fermented Chymosin Market Value (US$ Mn) Analysis by Form, 2017-2032

Figure 130: South Asia & Pacific Fermented Chymosin Market Volume (Tons) Analysis by Form, 2017-2032

Figure 131: South Asia & Pacific Fermented Chymosin Market Value Share (%) and BPS Analysis by Form, 2022-2032

Figure 132: South Asia & Pacific Fermented Chymosin Market Y-o-Y Growth (%) Projections by Form, 2022-2032

Figure 133: South Asia & Pacific Fermented Chymosin Market Value (US$ Mn) Analysis by End-use, 2017-2032

Figure 134: South Asia & Pacific Fermented Chymosin Market Volume (Tons) Analysis by End-use, 2017-2032

Figure 135: South Asia & Pacific Fermented Chymosin Market Value Share (%) and BPS Analysis by End-use, 2022-2032

Figure 136: South Asia & Pacific Fermented Chymosin Market Y-o-Y Growth (%) Projections by End-use, 2022-2032

Figure 137: South Asia & Pacific Fermented Chymosin Market Value (US$ Mn) Analysis by Sales Channel, 2017-2032

Figure 138: South Asia & Pacific Fermented Chymosin Market Volume (Tons) Analysis by Sales Channel, 2017-2032

Figure 139: South Asia & Pacific Fermented Chymosin Market Value Share (%) and BPS Analysis by Sales Channel, 2022-2032

Figure 140: South Asia & Pacific Fermented Chymosin Market Y-o-Y Growth (%) Projections by Sales Channel, 2022-2032

Figure 141: South Asia & Pacific Fermented Chymosin Market Attractiveness by Form, 2022-2032

Figure 142: South Asia & Pacific Fermented Chymosin Market Attractiveness by End-use, 2022-2032

Figure 143: South Asia & Pacific Fermented Chymosin Market Attractiveness by Sales Channel, 2022-2032

Figure 144: South Asia & Pacific Fermented Chymosin Market Attractiveness by Country, 2022-2032

Figure 145: MEA Fermented Chymosin Market Value (US$ Mn) by Form, 2022-2032

Figure 146: MEA Fermented Chymosin Market Value (US$ Mn) by End-use, 2022-2032

Figure 147: MEA Fermented Chymosin Market Value (US$ Mn) by Sales Channel, 2022-2032

Figure 148: MEA Fermented Chymosin Market Value (US$ Mn) by Country, 2022-2032

Figure 149: MEA Fermented Chymosin Market Value (US$ Mn) Analysis by Country, 2017-2032

Figure 150: MEA Fermented Chymosin Market Volume (Tons) Analysis by Country, 2017-2032

Figure 151: MEA Fermented Chymosin Market Value Share (%) and BPS Analysis by Country, 2022-2032

Figure 152: MEA Fermented Chymosin Market Y-o-Y Growth (%) Projections by Country, 2022-2032

Figure 153: MEA Fermented Chymosin Market Value (US$ Mn) Analysis by Form, 2017-2032

Figure 154: MEA Fermented Chymosin Market Volume (Tons) Analysis by Form, 2017-2032

Figure 155: MEA Fermented Chymosin Market Value Share (%) and BPS Analysis by Form, 2022-2032

Figure 156: MEA Fermented Chymosin Market Y-o-Y Growth (%) Projections by Form, 2022-2032

Figure 157: MEA Fermented Chymosin Market Value (US$ Mn) Analysis by End-use, 2017-2032

Figure 158: MEA Fermented Chymosin Market Volume (Tons) Analysis by End-use, 2017-2032

Figure 159: MEA Fermented Chymosin Market Value Share (%) and BPS Analysis by End-use, 2022-2032

Figure 160: MEA Fermented Chymosin Market Y-o-Y Growth (%) Projections by End-use, 2022-2032

Figure 161: MEA Fermented Chymosin Market Value (US$ Mn) Analysis by Sales Channel, 2017-2032

Figure 162: MEA Fermented Chymosin Market Volume (Tons) Analysis by Sales Channel, 2017-2032

Figure 163: MEA Fermented Chymosin Market Value Share (%) and BPS Analysis by Sales Channel, 2022-2032

Figure 164: MEA Fermented Chymosin Market Y-o-Y Growth (%) Projections by Sales Channel, 2022-2032

Figure 165: MEA Fermented Chymosin Market Attractiveness by Form, 2022-2032

Figure 166: MEA Fermented Chymosin Market Attractiveness by End-use, 2022-2032

Figure 167: MEA Fermented Chymosin Market Attractiveness by Sales Channel, 2022-2032

Figure 168: MEA Fermented Chymosin Market Attractiveness by Country, 2022-2032

Recommendations

Food and Beverage

Fermented Dairy Ingredients Market

Published : July 2023

Food and Beverage

Fermented Dairy Products Market

Published : July 2022

Explore Food and Beverage Insights

View Reports

Fermented Chymosin Market