Fermented Vitamins Market Size and Share Forecast Outlook 2025 to 2035

The market is expected to record a valuation of USD 6,217.5 million in 2025 and reach USD 11,127.3 million in 2035, reflecting a 6.0% CAGR. From 2025 to 2030, about USD 2.0 billion in incremental value is anticipated, supported by dietary supplements, fortified beverages, and functional skincare.
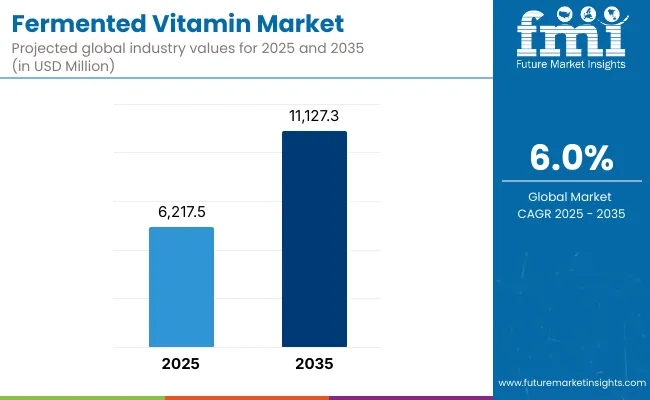
Quick Stats for Fermented Vitamins Market

  • Market Value (2025): USD 6,217.5 Million
  • Market Forecast Value (2035): USD 11,127.3 Million
  • Market Forecast CAGR (2025 to 2035): 6.0%
  • Leading Vitamin Type in 2025: Vitamin B Complex (34.0% share)
  • Leading Source in 2025: Microbial Fermentation (52.0% share)
  • Leading Form in 2025: Powder (60.0% share)
  • Key Growth Regions: India (8.8% CAGR), China (8.0%), South Asia & Pacific (8.0%), East Asia (7.5%)
  • Top Key Players: dsm-firmenich, BASF, Gnosis by Lesaffre, Balchem (Kappa Bioscience), Kyowa Hakko Bio, Zhejiang NHU

Fermented Vitamins Market

Fermented Vitamins Market Key Takeaways

Metric Value
Market Estimated Value In (2025E) USD 6,217.5 Million
Market Forecast Value In (2035f) USD 11,127.3 Million
Forecast CAGR (2025 to 2035) 6.0 %

A 2025 valuation of USD 6.22 billion has been indicated, rising to USD 11.13 billion by 2035 at a CAGR of 6.0%. Vitamin B Complex is positioned as the leading type, while microbial fermentation anchors supply. Asia, led by China and India, is expected to gain share by 2035. dsm-firmenich is assessed as the leading supplier cohort, with BASF’s 2025 restarts poised to stabilize broader vitamin availability.

From 2030 to 2035, a further ~USD 2.9 billion is projected as algal fermentation scales and personalized nutrition platforms deepen penetration. Integration into clinical nutrition, sports performance, and animal health is expected to broaden use cases. Digital commerce should accelerate access, while investments in strains and capacity expansion will enhance supply reliability. Asia-Pacific, particularly China and India, is forecast to drive share gains, with China’s global share rising from 17% in 2025 to 21% in 2035.

The expansion of the Fermented Vitamins Market is being propelled by advancements in microbial and algal fermentation technologies, offering higher bioavailability and eco-friendly production methods. Increasing consumer preference for clean-label, naturally derived vitamins has been reinforced by the rise of personalized nutrition and functional foods. Portable formats such as capsules and tablets are being integrated with software-driven wellness platforms, enabling scalable adoption across healthcare and consumer industries. The automation of fermentation processes has further enhanced production reliability, while pharmaceutical applications of vitamins in therapeutic and preventive care settings have solidified their role in global health strategies. The convergence of sustainable sourcing, clinical validation, and expanding dietary supplementation is projected to sustain long-term growth.

Why is the Fermented Vitamins Market Growing?

The growth of the Fermented Vitamins Market is being fueled by the convergence of health awareness, sustainability, and technological innovation. Rising consumer demand for clean-label and naturally derived nutrients has accelerated the shift away from synthetic vitamins toward fermentation-based alternatives that offer higher bioavailability and better digestibility. Advances in microbial and algal fermentation, coupled with strain engineering, are delivering consistent yields, lower impurity levels, and scalable production suited for pharmaceutical, dietary supplement, and functional food applications.

Preventive healthcare trends and the popularity of personalized nutrition have further reinforced demand, particularly for B-complex and multivitamin blends that target energy, immunity, and overall wellness. Expanding use in fortified foods, nutraceutical beverages, clinical nutrition, and beauty-from-within formulations has broadened application diversity. At the same time, Industry 4.0-enabled biomanufacturing practices are enhancing efficiency, quality, and traceability, making fermented vitamins attractive to both brands and regulators, thereby sustaining long-term market momentum.

Segmental Analysis

The Fermented Vitamins Market is segmented across vitamin type, source, form, application, and end user, each reflecting distinct growth pathways and consumer adoption dynamics. Vitamin type analysis highlights the dominance of B-complex and C, supported by their central roles in energy metabolism, immunity, and cognitive health, while multivitamin blends emerge as the fastest-growing due to their holistic appeal. Source segmentation emphasizes microbial fermentation as the established backbone of supply, with plant-based and algal methods expanding rapidly to align with sustainability and vegan preferences.

Form segmentation reveals powders as the most widely used for fortification, while capsules, tablets, and liquids gain traction through convenience, personalization, and e-commerce distribution. Applications range from dietary supplements and pharmaceuticals to animal nutrition and cosmetics, illustrating the versatility of fermented vitamins across industries. End-user analysis points to dietary supplement brands and pharmaceutical companies as leading demand drivers, shaping global adoption and reinforcing the market’s diversified growth base.
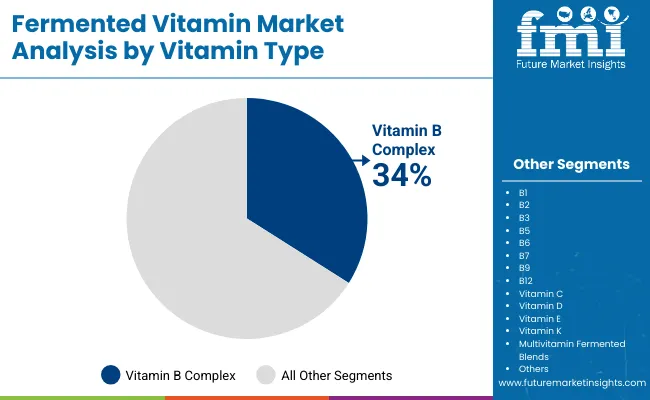
Insights into the Vitamin Type Segment with Vitamin B Complex Leading Market Share

Fermented Vitamins Market By Vitamin

Vitamin Type Market Value Share, 2025
Vitamin B Complex 34.0%
Others 66.0%

The vitamin type segment is expected to witness strong differentiation, with Vitamin B Complex positioned as the dominant contributor in 2025. Its broad functional benefits across energy, cognition, and cellular processes have reinforced integration into dietary supplements, fortified foods, and therapeutic formulations. Rising adoption of personalized nutrition and preventive healthcare has further expanded its market base, particularly in capsules, tablets, and multivitamin blends where B-complex remains the cornerstone.

Although other vitamins including C, A, D, E, and K hold important application-specific roles, their collective contribution is outweighed by the sustained dominance of B-complex. This pattern reflects the critical positioning of B-complex as a foundation nutrient category, securing its relevance across consumer, pharmaceutical, and clinical nutrition markets while continuing to attract investment in fermentation innovation.
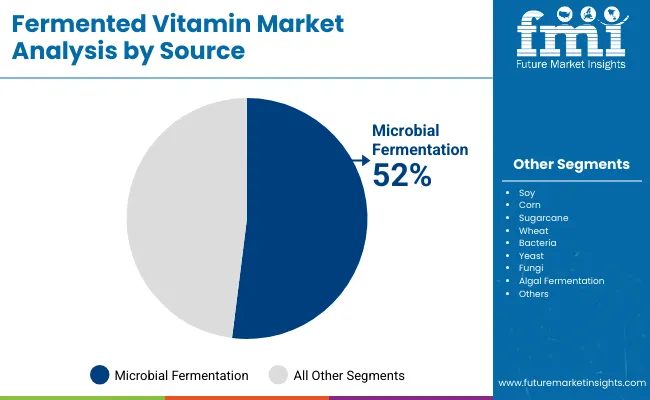
Insights into the Source Segment with Microbial Fermentation Leading Market Share

Fermented Vitamins Market By Source

Source Market Value Share, 2025
Microbial Fermentation 52.00%
Others 48.00%

The source segment continues to highlight microbial fermentation as the central driver of the fermented vitamins industry. Its established scalability, cost efficiency, and technical reliability have positioned it as the preferred production method for critical vitamins such as B12, K2, and riboflavin. Pharmaceutical companies, dietary supplement brands, and food and beverage manufacturers rely heavily on microbial fermentation due to its ability to deliver consistent purity and bioavailability. While plant-based and algal fermentation methods are advancing rapidly with sustainability and vegan credentials, they remain secondary to microbial platforms in absolute share. The dominance of microbial fermentation reflects both legacy infrastructure and its adaptability to industrial-scale processes, ensuring it remains the backbone of vitamin production through 2025.

Insights into the Form Segment with Powder Leading Market Share

Fermented Vitamins Market By Form

Form Market Value Share, 2025
Powder 60.00%
Others 40.00%

The form segment is expected to be led by powders, which represent the most versatile and widely adopted delivery form in 2025. Powders enable seamless integration into functional foods, fortified beverages, and dietary supplements, while also serving pharmaceutical and clinical nutrition requirements. Their compatibility with multiple end uses, cost-effectiveness, and longer shelf life have reinforced dominance. Although capsules, tablets, and liquids are gaining rapid traction due to convenience and personalization, powders continue to underpin industrial-scale formulations where blending, stability, and scalability are prioritized. The leading share of powders reflects their utility across both B2B manufacturing and consumer-facing applications, highlighting their indispensable role in the supply chain for fermented vitamins.

What are the Drivers, Restraints, and Key Trends of the Fermented Vitamins Market?

A multi-factor interplay is expected to shape demand, supply, and innovation in the Fermented Vitamins Market. Fermentation efficiency, sustainability, and clean-label positioning are anticipated to propel demand, while input volatility and regulatory scrutiny are likely to challenge smaller producers. Trends reflect alignment with preventive healthcare, personalized nutrition, and digital commerce expansion.

Driver: Bio-manufacturing scale and strain innovation will raise potency, consistency, and margins

Production capacity is anticipated to expand through optimized fermentation techniques and advanced downstream purification. Proprietary microbial strains for vitamins B12, K2, and riboflavin are projected to deliver higher yields and purity, aligning with pharmaceutical-grade standards. This consistency is expected to strengthen consumer trust in supplements, fortified beverages, and clinical applications. Plant-based feedstocks such as corn and sugarcane hydrolysates are likely to enhance sustainability credentials while reducing supply risk. As Industry 4.0-enabled process control improves efficiency, contract bio-manufacturers are positioned to offer turnkey solutions, accelerating launches for supplement and cosmetic brands. These innovations are forecast to reinforce microbial fermentation’s leadership while expanding accessibility across industries.

Restraint: Input volatility, specification tightening, and compliance burden will compress smaller players

Feedstock dependency on agricultural commodities exposes producers to cost volatility, while energy-intensive fermentation processes add further margin pressure. Regulatory expectations are becoming stricter, with pharmacopeial standards demanding lower impurities and improved stability for blends and liquids. Traceability, allergen management, and non-GMO verification are now prerequisites for market entry in the USA, EU, and Japan. These factors disproportionately challenge smaller producers, extending validation timelines and increasing compliance costs. The need for stability studies and formulation adjustments in multivitamin blends also raises complexity, reducing speed to market. Such conditions are expected to encourage industry consolidation, with distributors and large players gaining advantage through robust quality assurance and digital batch records.

Trend: Personalized nutrition, clean-label preferences, and digital commerce expansion will redefine adoption

Consumer preference for natural, eco-friendly, and bioavailable nutrients is accelerating demand for fermented vitamins across capsules, tablets, and liquids. Personalized wellness platforms are leveraging data-driven insights to recommend specific vitamin formulations, creating new opportunities for multivitamin blends and targeted products. Digital commerce channels, including subscription-based models and direct-to-consumer platforms, are expanding access to premium formats, particularly in supplements and beauty-from-within categories.

Cosmetic and functional beverage manufacturers are also integrating vitamins C and E into skin and immunity-focused offerings, reinforcing cross-industry adoption. Sustainability expectations are further supporting investment in plant-based and algal fermentation, positioning them as high-growth alternatives alongside microbial platforms. Together, these trends indicate that clean-label positioning and personalized delivery formats will shape the next phase of structural transformation.
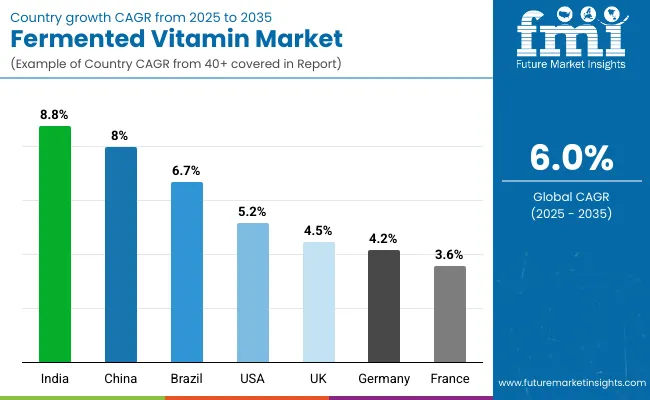
Analysis of Fermented Vitamins Market By Key Countries

Fermented Vitamins Market By Country

Countries CAGR (2025 to 2035)
China 8.0%
India 8.8%
Germany 4.2%
France 3.6%
UK 4.5%
USA 5.2%
Brazil 6.7%

Adoption is expected to advance unevenly across regions as industrial capabilities, policy frameworks, and consumer preferences diverge. In Asia-Pacific, capacity build-out and strong supplement penetration are projected to accelerate growth, supported by EV-like scale effects in precision manufacturing and Industry 4.0 practices in bio-plants. Europe is anticipated to emphasize compliance, sustainability, and traceability, with producers aligning to stringent pharmacopeial and labeling rules that raise barriers to entry but enable premium positioning.

North America is expected to leverage clinical validation and multichannel distribution, with direct-to-consumer brands expanding capsules and liquids through e-commerce while large food and beverage companies grow fortification programs. Across regions, digital quality systems, clean-label marketing, and integration into preventive healthcare are likely to reinforce demand. Divergent regulatory timelines and input cost exposure are expected to shape competitive strategies, while ecosystem strength in fermentation equipment, media, and downstream processing will determine the pace of innovation and export readiness.
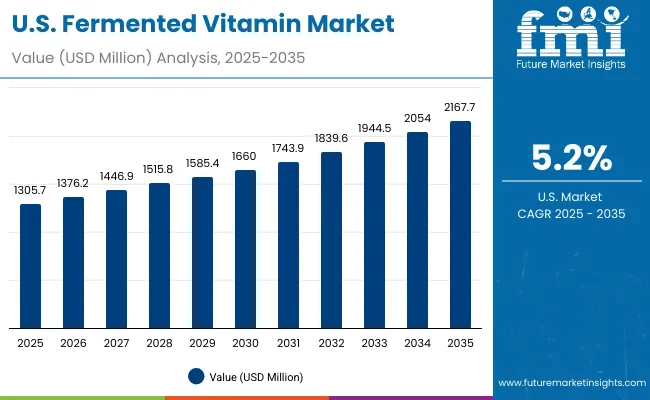
Sales Outlook for Fermented Vitamin in the United States

Fermented Vitamins Market Usa

Year USA Fermented Vitamins Market (USD Million)
2025 1,305.7
2026 1,376.2
2027 1,446.9
2028 1,515.8
2029 1,585.4
2030 1,660.0
2031 1,743.9
2032 1,839.6
2033 1,944.5
2034 2,054.0
2035 2,167.7

A CAGR of 5.2% through 2035 is anticipated. Growth is expected to be anchored in dietary supplements and sports nutrition as capsules and tablets gain convenience share, while liquids expand in fortified beverages. Pharmaceutical and clinical nutrition uses should rise as stability and impurity controls improve for B-complex and K2 grades. Retail and DTC channels are projected to scale online sales, supported by transparent sourcing and non-GMO positioning. Food and beverage manufacturers are likely to broaden fortification in functional drinks, aided by powders that blend cleanly and meet label claims. Partnerships between bio-manufacturers and healthcare brands are expected to elevate clinical evidence and accelerate premiumization.

  • Market share declines from 21% to 19% by 2035.
  • Capsules and tablets remain the leading delivery format.
  • Preventive healthcare adoption strengthens B-complex demand.
  • Online and subscription channels accelerate distribution.

United Kingdom: Clean-Label Focus and Stringent Standards Sustain Demand

A CAGR of 4.5% is projected. The market is expected to prioritize clean-label credentials and audited supply chains, supporting microbial and plant-based sources in multivitamin blends. Retailers are likely to expand private-label supplements with verified vegan and allergen-controlled claims. Pharmaceutical alignment to MHRA and EU standards is anticipated to lift demand for higher-spec vitamins B12 and riboflavin. Fortified beverages should gain traction as functional hydration grows, while e-commerce continues to streamline distribution. Sustainability disclosures and recyclable packaging are expected to influence buyer selection, particularly in capsules and powders.

  • Market share contracts from 5% to 4% by 2035.
  • Private-label supplements expand in retail chains.
  • Verified vegan and allergen-free claims dominate positioning.
  • Online sales platforms strengthen consumer outreach.

India: Contract Manufacturing and Preventive Healthcare Drive Expansion

A CAGR of 8.8% is forecast, the highest among key countries. Expansion is expected to be powered by preventive healthcare awareness, widespread use of B-complex and vitamin C supplements, and government support for nutraceutical exports. Contract fermentation facilities utilizing corn and sugarcane substrates are anticipated to enhance supply security while supporting affordability. Capsules and tablets dominate domestic demand, though fortified beverages and functional foods are rapidly gaining acceptance. Export capability is projected to improve through pharmacopeial alignment and sustainability certifications, making India a competitive hub in regional supply networks.

  • Market share rises from 8% to 11% by 2035.
  • Contract fermentation boosts export competitiveness.
  • Preventive healthcare drives multivitamin demand.
  • Capsules and tablets remain dominant formats.

China: Scale Expansion and Functional Beverages Elevate Market Share

A CAGR of 8.0% is anticipated, reinforcing China’s role as a global growth engine. Investments in microbial and algal fermentation are expected to strengthen leadership in B12, K2, and riboflavin supply. Domestic demand for fortified beverages and multivitamin blends is expanding rapidly, supported by consumer preference for immunity and beauty-from-within products. Government-led quality audits and sustainability targets are shaping industrial practices, pushing producers toward Industry 4.0 systems. Export strength in high-volume vitamins is forecast to increase, further consolidating China’s role in global supply chains.

  • Market share rises from 17% to 21% by 2035.
  • Functional beverages remain the leading application.
  • Industry 4.0 practices strengthen process efficiency.
  • Algal fermentation gains ground in premium supplements.

Germany: Pharmaceutical Standards and Sustainability Lead Market Priorities

A CAGR of 4.2% is projected. Germany is expected to maintain emphasis on pharmaceutical-grade compliance, rigorous stability studies, and lifecycle assessments of fermentation processes. Premium positioning in pharmaceutical and clinical nutrition markets will reinforce demand for high-spec vitamins, particularly B-complex and K2. Food and beverage fortification continues steadily, while cosmetics adopt vitamin C and E in skincare and serums. Collaboration with advanced equipment providers and process-analytics firms sustains competitive efficiency. Direct B2B distribution is dominant, though online professional supplement sales are gradually expanding.

  • Market share contracts from 7% to 6% by 2035.
  • Pharmaceutical standards ensure premium positioning.
  • Stability validation drives product development.
  • Cosmetics expand use of C and E in formulations.

Japan: Quality Assurance and Aging Demographics Support Demand

A CAGR of around 5-6% is expected. Vitamin C and B-complex dominate domestic consumption, reflecting their strong roles in immunity and energy support. Multivitamin blends are projected to rise fastest, aligned with consumer preference for holistic health solutions. Aging demographics are likely to sustain preventive care adoption, particularly in capsules and tablets. Pharmaceutical and clinical nutrition uses emphasize microbial and algal fermentation due to strict safety and purity expectations. Labeling transparency and traceability remain decisive in brand selection, reinforcing trust in premium formulations.

  • Market share grows from 9% to 10% by 2035.
  • Capsules and tablets lead preventive care adoption.
  • Multivitamin blends post strongest growth.
  • Traceability drives consumer trust in premium brands.

South Korea: Algal Fermentation and K-Beauty Boost Market Growth

A high-single-digit CAGR is projected, supported by growing integration of vitamins into functional foods, sports nutrition, and K-beauty. Microbial fermentation maintains dominance, though algal and plant-based sources are rising quickly due to strong sustainability appeal. Capsules and liquids are anticipated to expand in both supplement and cosmetic categories. Local innovation ecosystems, supported by digital health platforms and robust quality controls, are expected to shorten product cycles and accelerate premium launches. Export-oriented suppliers will likely leverage this advantage to strengthen regional leadership.
  • Market share remains stable at around 4% by 2035.
  • Algal fermentation gains adoption in premium lines.
  • K-beauty drives C and E usage in skincare.
  • Sports nutrition expands capsule and liquid uptake.

Competitive Landscape of Fermented Vitamins Market

Fermented Vitamins Market By Company

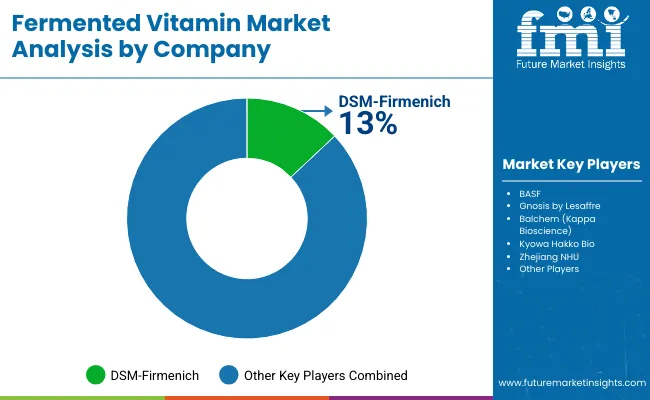
The competitive landscape of the Fermented Vitamins Market is expected to remain anchored by a few global leaders with extensive manufacturing capabilities, supported by regional specialists that cater to niche demands. dsm-firmenich is anticipated to maintain its leadership, driven by broad product coverage across B-complex, vitamin C, and clinical-grade vitamins, coupled with multi-site fermentation capacity and strong integration into pharmaceutical and nutrition channels.

BASF is positioned as a critical supplier, particularly in vitamins A and E, where production restarts are expected to stabilize availability and pricing across fortified food and personal care categories. Category-focused specialists such as Gnosis by Lesaffre and Balchem (Kappa Bioscience) are projected to dominate the fermented vitamin K2 space, leveraging their expertise in high-purity MK-7 production and strong clinical validation. Regional producers, including Zhejiang NHU and Kyowa Hakko Bio, provide scale and diversification, especially in Asia. The broader market outside of dsm-firmenich remains fragmented, with mid-sized innovators and contract manufacturers increasingly focusing on plant-based and algal fermentation methods to address sustainability and clean-label demands.

Key Developments in Fermented Vitamins Market

  • March 2025 BASF vitamin capacity restart updates. Production restarts for vitamin A (early April) and accelerated timelines for vitamin E (mid-May) were communicated, with carotenoids following in early July. Supply normalization over subsequent months is expected to ease volatility across fortified foods and supplements globally.
  • February 2025 Bioengineered spirulina enables active B12. Researchers reported spirulina engineered to produce bioactive vitamin B12, creating a plant-forward, carbon-light source with relevance to precision-fermented nutrition. This advance strengthens future-proofing for vegan applications and functional beverages.

Scope of the Report

Item Details
Market Size, 2025 USD 6,217.5 Million
Market Size, 2035 USD 11,127.3 Million
Absolute Growth (2025-2035) USD 4,909.8 Million
CAGR (2025-2035) 6.00%
Value Added 2025-2030 ~USD 1,985.5 Million
Value Added 2030-2035 ~USD 2,924.3 Million
Vitamin Type (2025) Vitamin B Complex leads with 34.0% share
Source (2025) Microbial Fermentation leads with 52.0% share
Form (2025) Powder leads with 6 0.0% share
Application (2025) Dietary Supplements & Sports Nutrition leads with 34.0% share
End User (2025) Dietary Supplement Brands lead with 30.0% share
Key Growth Regions (CAGR) India (8.8%), China (8.0%), South Asia & Pacific (8.0%), East Asia (7.5%)
Regions Covered North America, Latin America, Europe, East Asia, South Asia & Pacific, Middle East & Africa
Countries Covered USA, UK, Germany, France, China, India, Japan, South Korea, Brazil
Key Companies Profiled dsm-firmenich, BASF, Gnosis by Lesaffre, Balchem (Kappa Bioscience), Kyowa Hakko Bio, Zhejiang NHU
Additional Attributes Clean-label adoption, traceability, ESG alignment, Industry 4.0 in fermentation, personalized nutrition integration, e-commerce enablement

Key Segments

By Vitamin Type:

  • Vitamin A
  • Vitamin B Complex
    • B1
    • B2
    • B3
    • B5
    • B6
    • B7
    • B9
    • B12
  • Vitamin C
  • Vitamin D
  • Vitamin E
  • Vitamin K
  • Multivitamin Fermented Blends
  • Others

By Source:

  • Plant-Based Fermentation ( Soy , Corn , Sugarcane , Wheat , etc.)
    • Soy
    • Corn
    • Sugarcane
    • Wheat
  • Microbial Fermentation
    • Bacteria
    • Yeast
    • Fungi
  • Algal Fermentation
  • Others

By Form:

  • Powder
  • Liquid
  • Granules
  • Capsules/Tablets

By Application:

  • Food & Beverages
    • Fortified Foods
    • Nutraceutical Drinks
    • Functional Ingredients
  • Dietary Supplements & Sports Nutrition
  • Pharmaceuticals
    • Therapeutics
    • Clinical Nutrition
    • Preventive Care
  • Animal Nutrition
    • Poultry
    • Swine
    • Aquaculture
    • Ruminants
    • Pet Food
  • Cosmetics & Personal Care
    • Skin Care
    • Hair Care
    • Anti-Aging Products
  • Others

By End User:

  • Food & Beverage Manufacturers
  • Pharmaceutical & Healthcare Companies
  • Dietary Supplement Brands
  • Animal Feed Manufacturers
  • Cosmetic & Personal Care Companies
  • Research & Academic Institutes

By Distribution Channel:

  • Direct Sales (B2B Supply Agreements)
  • Distributors & Wholesalers
  • Online Sales (E-commerce, Company Portals)

By Region:

  • North America
  • Latin America
  • Europe
  • East Asia
  • South Asia & Pacific
  • Middle East and Africa

Table of Content

  1. Executive Summary
    • Global Market Outlook
    • Demand-side Trends
    • Supply-side Trends
    • Technology Roadmap Analysis
    • Analysis and Recommendations
  2. Market Overview
    • Market Coverage / Taxonomy
    • Market Definition / Scope / Limitations
  3. Market Background
    • Market Dynamics
      • Drivers
      • Restraints
      • Opportunity
      • Trends
    • Scenario Forecast
      • Demand in Optimistic Scenario
      • Demand in Likely Scenario
      • Demand in Conservative Scenario
    • Opportunity Map Analysis
    • Product Life Cycle Analysis
    • Supply Chain Analysis
    • Investment Feasibility Matrix
    • Value Chain Analysis
    • PESTLE and Porter’s Analysis
    • Regulatory Landscape
    • Regional Parent Market Outlook
    • Production and Consumption Statistics
    • Import and Export Statistics
  4. Global Analysis 2020 to 2024 and Forecast, 2025 to 2035
    • Historical Market Size Value (USD Million) & Volume (MT) Analysis, 2020 to 2024
    • Current and Future Market Size Value (USD Million) & Volume (MT) Projections, 2025 to 2035
      • Y-o-Y Growth Trend Analysis
      • Absolute $ Opportunity Analysis
  5. Global Pricing Analysis 2020 to 2024 and Forecast 2025 to 2035
  6. Global Analysis 2020 to 2024 and Forecast 2025 to 2035, By Vitamin Type
    • Introduction / Key Findings
    • Historical Market Size Value (USD Million) & Volume (MT) Analysis By Vitamin Type, 2020 to 2024
    • Current and Future Market Size Value (USD Million) & Volume (MT) Analysis and Forecast By Vitamin Type, 2025 to 2035
      • Vitamin A
      • Vitamin B Complex
        • B1
        • B2
        • B3
        • B5
        • B6
        • B7
        • B9
        • B12
      • Vitamin C
      • Vitamin D
      • Vitamin E
      • Vitamin K
      • Multivitamin Fermented Blends
      • Others
    • Y-o-Y Growth Trend Analysis By Vitamin Type, 2020 to 2024
    • Absolute $ Opportunity Analysis By Vitamin Type, 2025 to 2035
  7. Global Analysis 2020 to 2024 and Forecast 2025 to 2035, By Source
    • Introduction / Key Findings
    • Historical Market Size Value (USD Million) & Volume (MT) Analysis By Source, 2020 to 2024
    • Current and Future Market Size Value (USD Million) & Volume (MT) Analysis and Forecast By Source, 2025 to 2035
      • Plant-Based Fermentation ( Soy , Corn , Sugarcane , Wheat , etc.)
        • Soy
        • Corn
        • Sugarcane
        • Wheat
      • Microbial Fermentation
        • Bacteria
        • Yeast
        • Fungi
      • Algal Fermentation
      • Others
    • Y-o-Y Growth Trend Analysis By Source, 2020 to 2024
    • Absolute $ Opportunity Analysis By Source, 2025 to 2035
  8. Global Analysis 2020 to 2024 and Forecast 2025 to 2035, By Form
    • Introduction / Key Findings
    • Historical Market Size Value (USD Million) & Volume (MT) Analysis By Form, 2020 to 2024
    • Current and Future Market Size Value (USD Million) & Volume (MT) Analysis and Forecast By Form, 2025 to 2035
      • Powder
      • Liquid
      • Granules
      • Capsules/Tablets
    • Y-o-Y Growth Trend Analysis By Form, 2020 to 2024
    • Absolute $ Opportunity Analysis By Form, 2025 to 2035
  9. Global Analysis 2020 to 2024 and Forecast 2025 to 2035, By Application
    • Introduction / Key Findings
    • Historical Market Size Value (USD Million) & Volume (MT) Analysis By Application, 2020 to 2024
    • Current and Future Market Size Value (USD Million) & Volume (MT) Analysis and Forecast By Application, 2025 to 2035
      • Food & Beverages
        • Fortified Foods
        • Nutraceutical Drinks
        • Functional Ingredients
      • Dietary Supplements & Sports Nutrition
      • Pharmaceuticals
        • Therapeutics
        • Clinical Nutrition
        • Preventive Care
      • Animal Nutrition
        • Poultry
        • Swine
        • Aquaculture
        • Ruminants
        • Pet Food
      • Cosmetics & Personal Care
        • Skin Care
        • Hair Care
        • Anti-Aging Products
      • Others
    • Y-o-Y Growth Trend Analysis By Application, 2020 to 2024
    • Absolute $ Opportunity Analysis By Application, 2025 to 2035
  10. Global Analysis 2020 to 2024 and Forecast 2025 to 2035, By End User
    • Introduction / Key Findings
    • Historical Market Size Value (USD Million) & Volume (MT) Analysis By End User, 2020 to 2024
    • Current and Future Market Size Value (USD Million) & Volume (MT) Analysis and Forecast By End User, 2025 to 2035
      • Food & Beverage Manufacturers
      • Pharmaceutical & Healthcare Companies
      • Dietary Supplement Brands
      • Animal Feed Manufacturers
      • Cosmetic & Personal Care Companies
      • Research & Academic Institutes
    • Y-o-Y Growth Trend Analysis By End User, 2020 to 2024
    • Absolute $ Opportunity Analysis By End User, 2025 to 2035
  11. Global Analysis 2020 to 2024 and Forecast 2025 to 2035, By Distribution Channel
    • Introduction / Key Findings
    • Historical Market Size Value (USD Million) & Volume (MT) Analysis By Distribution Channel, 2020 to 2024
    • Current and Future Market Size Value (USD Million) & Volume (MT) Analysis and Forecast By Distribution Channel, 2025 to 2035
      • Direct Sales (B2B Supply Agreements)
      • Distributors & Wholesalers
      • Online Sales (E-commerce, Company Portals)
    • Y-o-Y Growth Trend Analysis By Distribution Channel, 2020 to 2024
    • Absolute $ Opportunity Analysis By Distribution Channel, 2025 to 2035
  12. Global Analysis 2020 to 2024 and Forecast 2025 to 2035, By Region
    • Introduction
    • Historical Market Size Value (USD Million) & Volume (MT) Analysis By Region, 2020 to 2024
    • Current Market Size Value (USD Million) & Volume (MT) Analysis and Forecast By Region, 2025 to 2035
      • North America
      • Latin America
      • Europe
      • East Asia
      • South Asia & Pacific
      • Middle East and Africa
    • Market Attractiveness Analysis By Region
  13. North America Analysis 2020 to 2024 and Forecast 2025 to 2035, By Country
    • Historical Market Size Value (USD Million) & Volume (MT) Trend Analysis By Market Taxonomy, 2020 to 2024
    • Market Size Value (USD Million) & Volume (MT) Forecast By Market Taxonomy, 2025 to 2035
      • By Country
        • USA
        • Canada
      • By Vitamin Type
      • By Source
      • By Form
      • By Application
      • By End User
      • By Distribution Channel
    • Market Attractiveness Analysis
      • By Country
      • By Vitamin Type
      • By Source
      • By Form
      • By Application
      • By End User
      • By Distribution Channel
    • Key Takeaways
  14. Latin America Analysis 2020 to 2024 and Forecast 2025 to 2035, By Country
    • Historical Market Size Value (USD Million) & Volume (MT) Trend Analysis By Market Taxonomy, 2020 to 2024
    • Market Size Value (USD Million) & Volume (MT) Forecast By Market Taxonomy, 2025 to 2035
      • By Country
        • Brazil
        • Mexico
        • Colombia
        • Rest of Latin America
      • By Vitamin Type
      • By Source
      • By Form
      • By Application
      • By End User
      • By Distribution Channel
    • Market Attractiveness Analysis
      • By Country
      • By Vitamin Type
      • By Source
      • By Form
      • By Application
      • By End User
      • By Distribution Channel
    • Key Takeaways
  15. Europe Analysis 2020 to 2024 and Forecast 2025 to 2035, By Country
    • Historical Market Size Value (USD Million) & Volume (MT) Trend Analysis By Market Taxonomy, 2020 to 2024
    • Market Size Value (USD Million) & Volume (MT) Forecast By Market Taxonomy, 2025 to 2035
      • By Country
        • Germany
        • UK
        • France
        • Italy
        • Spain
        • Belgium
        • Netherlands
        • Nordic
        • Switzerland
        • Russia
        • Poland
        • Rest of Europe
      • By Vitamin Type
      • By Source
      • By Form
      • By Application
      • By End User
      • By Distribution Channel
    • Market Attractiveness Analysis
      • By Country
      • By Vitamin Type
      • By Source
      • By Form
      • By Application
      • By End User
      • By Distribution Channel
    • Key Takeaways
  16. East Asia Analysis 2020 to 2024 and Forecast 2025 to 2035, By Country
    • Historical Market Size Value (USD Million) & Volume (MT) Trend Analysis By Market Taxonomy, 2020 to 2024
    • Market Size Value (USD Million) & Volume (MT) Forecast By Market Taxonomy, 2025 to 2035
      • By Country
        • China
        • Japan
        • South Korea
      • By Vitamin Type
      • By Source
      • By Form
      • By Application
      • By End User
      • By Distribution Channel
    • Market Attractiveness Analysis
      • By Country
      • By Vitamin Type
      • By Source
      • By Form
      • By Application
      • By End User
      • By Distribution Channel
    • Key Takeaways
  17. South Asia & Pacific Analysis 2020 to 2024 and Forecast 2025 to 2035, By Country
    • Historical Market Size Value (USD Million) & Volume (MT) Trend Analysis By Market Taxonomy, 2020 to 2024
    • Market Size Value (USD Million) & Volume (MT) Forecast By Market Taxonomy, 2025 to 2035
      • By Country
        • India
        • Thailand
        • Malaysia
        • Indonesia
        • Singapore
        • Vietnam
        • Australia
        • New Zealand
        • Rest of South Asia
      • By Vitamin Type
      • By Source
      • By Form
      • By Application
      • By End User
      • By Distribution Channel
    • Market Attractiveness Analysis
      • By Country
      • By Vitamin Type
      • By Source
      • By Form
      • By Application
      • By End User
      • By Distribution Channel
    • Key Takeaways
  18. Middle East and Africa Analysis 2020 to 2024 and Forecast 2025 to 2035, By Country
    • Historical Market Size Value (USD Million) & Volume (MT) Trend Analysis By Market Taxonomy, 2020 to 2024
    • Market Size Value (USD Million) & Volume (MT) Forecast By Market Taxonomy, 2025 to 2035
      • By Country
        • Turkey
        • UAE
        • Saudi Arabia
        • Israel
        • Other GCC Countries
        • North Africa
        • South Africa
      • By Vitamin Type
      • By Source
      • By Form
      • By Application
      • By End User
      • By Distribution Channel
    • Market Attractiveness Analysis
      • By Country
      • By Vitamin Type
      • By Source
      • By Form
      • By Application
      • By End User
      • By Distribution Channel
    • Key Takeaways
  19. Key Countries Analysis
    • USA
      • Pricing Analysis
      • Market Share Analysis, 2024
        • By Vitamin Type
        • By Source
        • By Form
        • By Application
        • By End User
        • By Distribution Channel
    • Canada
      • Pricing Analysis
      • Market Share Analysis, 2024
        • By Vitamin Type
        • By Source
        • By Form
        • By Application
        • By End User
        • By Distribution Channel
    • Mexico
      • Pricing Analysis
      • Market Share Analysis, 2024
        • By Vitamin Type
        • By Source
        • By Form
        • By Application
        • By End User
        • By Distribution Channel
    • Brazil
      • Pricing Analysis
      • Market Share Analysis, 2024
        • By Vitamin Type
        • By Source
        • By Form
        • By Application
        • By End User
        • By Distribution Channel
    • Germany
      • Pricing Analysis
      • Market Share Analysis, 2024
        • By Vitamin Type
        • By Source
        • By Form
        • By Application
        • By End User
        • By Distribution Channel
    • UK
      • Pricing Analysis
      • Market Share Analysis, 2024
        • By Vitamin Type
        • By Source
        • By Form
        • By Application
        • By End User
        • By Distribution Channel
    • Italy
      • Pricing Analysis
      • Market Share Analysis, 2024
        • By Vitamin Type
        • By Source
        • By Form
        • By Application
        • By End User
        • By Distribution Channel
    • Spain
      • Pricing Analysis
      • Market Share Analysis, 2024
        • By Vitamin Type
        • By Source
        • By Form
        • By Application
        • By End User
        • By Distribution Channel
    • France
      • Pricing Analysis
      • Market Share Analysis, 2024
        • By Vitamin Type
        • By Source
        • By Form
        • By Application
        • By End User
        • By Distribution Channel
    • India
      • Pricing Analysis
      • Market Share Analysis, 2024
        • By Vitamin Type
        • By Source
        • By Form
        • By Application
        • By End User
        • By Distribution Channel
    • Australia & New Zealand
      • Pricing Analysis
      • Market Share Analysis, 2024
        • By Vitamin Type
        • By Source
        • By Form
        • By Application
        • By End User
        • By Distribution Channel
    • China
      • Pricing Analysis
      • Market Share Analysis, 2024
        • By Vitamin Type
        • By Source
        • By Form
        • By Application
        • By End User
        • By Distribution Channel
    • Japan
      • Pricing Analysis
      • Market Share Analysis, 2024
        • By Vitamin Type
        • By Source
        • By Form
        • By Application
        • By End User
        • By Distribution Channel
    • South Korea
      • Pricing Analysis
      • Market Share Analysis, 2024
        • By Vitamin Type
        • By Source
        • By Form
        • By Application
        • By End User
        • By Distribution Channel
    • Russia
      • Pricing Analysis
      • Market Share Analysis, 2024
        • By Vitamin Type
        • By Source
        • By Form
        • By Application
        • By End User
        • By Distribution Channel
    • Poland
      • Pricing Analysis
      • Market Share Analysis, 2024
        • By Vitamin Type
        • By Source
        • By Form
        • By Application
        • By End User
        • By Distribution Channel
    • Hungary
      • Pricing Analysis
      • Market Share Analysis, 2024
        • By Vitamin Type
        • By Source
        • By Form
        • By Application
        • By End User
        • By Distribution Channel
    • Kingdom of Saudi Arabia
      • Pricing Analysis
      • Market Share Analysis, 2024
        • By Vitamin Type
        • By Source
        • By Form
        • By Application
        • By End User
        • By Distribution Channel
    • Turkiye
      • Pricing Analysis
      • Market Share Analysis, 2024
        • By Vitamin Type
        • By Source
        • By Form
        • By Application
        • By End User
        • By Distribution Channel
    • South Africa
      • Pricing Analysis
      • Market Share Analysis, 2024
        • By Vitamin Type
        • By Source
        • By Form
        • By Application
        • By End User
        • By Distribution Channel
  20. Market Structure Analysis
    • Competition Dashboard
    • Competition Benchmarking
    • Market Share Analysis of Top Players
      • By Regional
      • By Vitamin Type
      • By Source
      • By Form
      • By Application
      • By End User
      • By Distribution Channel
  21. Competition Analysis
    • Competition Deep Dive
  22. Assumptions & Acronyms Used
  23. Research Methodology

List of Tables

  • Table 1: Global Value (USD Million) Forecast by Region, 2020-2035
  • Table 2: Global Volume (MT) Forecast by Region, 2020-2035
  • Table 3: Global Value (USD Million) Forecast by Vitamin Type, 2020-2035
  • Table 4: Global Volume (MT) Forecast by Vitamin Type, 2020-2035
  • Table 5: Global Value (USD Million) Forecast by Source, 2020-2035
  • Table 6: Global Volume (MT) Forecast by Source, 2020-2035
  • Table 7: Global Value (USD Million) Forecast by Form, 2020-2035
  • Table 8: Global Volume (MT) Forecast by Form, 2020-2035
  • Table 9: Global Value (USD Million) Forecast by Application, 2020-2035
  • Table 10: Global Volume (MT) Forecast by Application, 2020-2035
  • Table 11: Global Value (USD Million) Forecast by End User, 2020-2035
  • Table 12: Global Volume (MT) Forecast by End User, 2020-2035
  • Table 13: Global Value (USD Million) Forecast by Distribution Channel, 2020-2035
  • Table 14: Global Volume (MT) Forecast by Distribution Channel, 2020-2035
  • Table 15: North America Value (USD Million) Forecast by Country, 2020-2035
  • Table 16: North America Volume (MT) Forecast by Country, 2020-2035
  • Table 17: North America Value (USD Million) Forecast by Vitamin Type, 2020-2035
  • Table 18: North America Volume (MT) Forecast by Vitamin Type, 2020-2035
  • Table 19: North America Value (USD Million) Forecast by Source, 2020-2035
  • Table 20: North America Volume (MT) Forecast by Source, 2020-2035
  • Table 21: North America Value (USD Million) Forecast by Form, 2020-2035
  • Table 22: North America Volume (MT) Forecast by Form, 2020-2035
  • Table 23: North America Value (USD Million) Forecast by Application, 2020-2035
  • Table 24: North America Volume (MT) Forecast by Application, 2020-2035
  • Table 25: North America Value (USD Million) Forecast by End User, 2020-2035
  • Table 26: North America Volume (MT) Forecast by End User, 2020-2035
  • Table 27: North America Value (USD Million) Forecast by Distribution Channel, 2020-2035
  • Table 28: North America Volume (MT) Forecast by Distribution Channel, 2020-2035
  • Table 29: Latin America Value (USD Million) Forecast by Country, 2020-2035
  • Table 30: Latin America Volume (MT) Forecast by Country, 2020-2035
  • Table 31: Latin America Value (USD Million) Forecast by Vitamin Type, 2020-2035
  • Table 32: Latin America Volume (MT) Forecast by Vitamin Type, 2020-2035
  • Table 33: Latin America Value (USD Million) Forecast by Source, 2020-2035
  • Table 34: Latin America Volume (MT) Forecast by Source, 2020-2035
  • Table 35: Latin America Value (USD Million) Forecast by Form, 2020-2035
  • Table 36: Latin America Volume (MT) Forecast by Form, 2020-2035
  • Table 37: Latin America Value (USD Million) Forecast by Application, 2020-2035
  • Table 38: Latin America Volume (MT) Forecast by Application, 2020-2035
  • Table 39: Latin America Value (USD Million) Forecast by End User, 2020-2035
  • Table 40: Latin America Volume (MT) Forecast by End User, 2020-2035
  • Table 41: Latin America Value (USD Million) Forecast by Distribution Channel, 2020-2035
  • Table 42: Latin America Volume (MT) Forecast by Distribution Channel, 2020-2035
  • Table 43: Europe Value (USD Million) Forecast by Country, 2020-2035
  • Table 44: Europe Volume (MT) Forecast by Country, 2020-2035
  • Table 45: Europe Value (USD Million) Forecast by Vitamin Type, 2020-2035
  • Table 46: Europe Volume (MT) Forecast by Vitamin Type, 2020-2035
  • Table 47: Europe Value (USD Million) Forecast by Source, 2020-2035
  • Table 48: Europe Volume (MT) Forecast by Source, 2020-2035
  • Table 49: Europe Value (USD Million) Forecast by Form, 2020-2035
  • Table 50: Europe Volume (MT) Forecast by Form, 2020-2035
  • Table 51: Europe Value (USD Million) Forecast by Application, 2020-2035
  • Table 52: Europe Volume (MT) Forecast by Application, 2020-2035
  • Table 53: Europe Value (USD Million) Forecast by End User, 2020-2035
  • Table 54: Europe Volume (MT) Forecast by End User, 2020-2035
  • Table 55: Europe Value (USD Million) Forecast by Distribution Channel, 2020-2035
  • Table 56: Europe Volume (MT) Forecast by Distribution Channel, 2020-2035
  • Table 57: East Asia Value (USD Million) Forecast by Country, 2020-2035
  • Table 58: East Asia Volume (MT) Forecast by Country, 2020-2035
  • Table 59: East Asia Value (USD Million) Forecast by Vitamin Type, 2020-2035
  • Table 60: East Asia Volume (MT) Forecast by Vitamin Type, 2020-2035
  • Table 61: East Asia Value (USD Million) Forecast by Source, 2020-2035
  • Table 62: East Asia Volume (MT) Forecast by Source, 2020-2035
  • Table 63: East Asia Value (USD Million) Forecast by Form, 2020-2035
  • Table 64: East Asia Volume (MT) Forecast by Form, 2020-2035
  • Table 65: East Asia Value (USD Million) Forecast by Application, 2020-2035
  • Table 66: East Asia Volume (MT) Forecast by Application, 2020-2035
  • Table 67: East Asia Value (USD Million) Forecast by End User, 2020-2035
  • Table 68: East Asia Volume (MT) Forecast by End User, 2020-2035
  • Table 69: East Asia Value (USD Million) Forecast by Distribution Channel, 2020-2035
  • Table 70: East Asia Volume (MT) Forecast by Distribution Channel, 2020-2035
  • Table 71: South Asia & Pacific Value (USD Million) Forecast by Country, 2020-2035
  • Table 72: South Asia & Pacific Volume (MT) Forecast by Country, 2020-2035
  • Table 73: South Asia & Pacific Value (USD Million) Forecast by Vitamin Type, 2020-2035
  • Table 74: South Asia & Pacific Volume (MT) Forecast by Vitamin Type, 2020-2035
  • Table 75: South Asia & Pacific Value (USD Million) Forecast by Source, 2020-2035
  • Table 76: South Asia & Pacific Volume (MT) Forecast by Source, 2020-2035
  • Table 77: South Asia & Pacific Value (USD Million) Forecast by Form, 2020-2035
  • Table 78: South Asia & Pacific Volume (MT) Forecast by Form, 2020-2035
  • Table 79: South Asia & Pacific Value (USD Million) Forecast by Application, 2020-2035
  • Table 80: South Asia & Pacific Volume (MT) Forecast by Application, 2020-2035
  • Table 81: South Asia & Pacific Value (USD Million) Forecast by End User, 2020-2035
  • Table 82: South Asia & Pacific Volume (MT) Forecast by End User, 2020-2035
  • Table 83: South Asia & Pacific Value (USD Million) Forecast by Distribution Channel, 2020-2035
  • Table 84: South Asia & Pacific Volume (MT) Forecast by Distribution Channel, 2020-2035
  • Table 85: Middle East and Africa Value (USD Million) Forecast by Country, 2020-2035
  • Table 86: Middle East and Africa Volume (MT) Forecast by Country, 2020-2035
  • Table 87: Middle East and Africa Value (USD Million) Forecast by Vitamin Type, 2020-2035
  • Table 88: Middle East and Africa Volume (MT) Forecast by Vitamin Type, 2020-2035
  • Table 89: Middle East and Africa Value (USD Million) Forecast by Source, 2020-2035
  • Table 90: Middle East and Africa Volume (MT) Forecast by Source, 2020-2035
  • Table 91: Middle East and Africa Value (USD Million) Forecast by Form, 2020-2035
  • Table 92: Middle East and Africa Volume (MT) Forecast by Form, 2020-2035
  • Table 93: Middle East and Africa Value (USD Million) Forecast by Application, 2020-2035
  • Table 94: Middle East and Africa Volume (MT) Forecast by Application, 2020-2035
  • Table 95: Middle East and Africa Value (USD Million) Forecast by End User, 2020-2035
  • Table 96: Middle East and Africa Volume (MT) Forecast by End User, 2020-2035
  • Table 97: Middle East and Africa Value (USD Million) Forecast by Distribution Channel, 2020-2035
  • Table 98: Middle East and Africa Volume (MT) Forecast by Distribution Channel, 2020-2035

List of Figures

  • Figure 1: Global Volume (MT) Forecast 2020-2035
  • Figure 2: Global Pricing Analysis
  • Figure 3: Global Value (USD Million) Forecast 2020-2035
  • Figure 4: Global Value Share and BPS Analysis by Vitamin Type, 2025 and 2035
  • Figure 5: Global Y-o-Y Growth Comparison by Vitamin Type, 2025-2035
  • Figure 6: Global Attractiveness Analysis by Vitamin Type
  • Figure 7: Global Value Share and BPS Analysis by Source, 2025 and 2035
  • Figure 8: Global Y-o-Y Growth Comparison by Source, 2025-2035
  • Figure 9: Global Attractiveness Analysis by Source
  • Figure 10: Global Value Share and BPS Analysis by Form, 2025 and 2035
  • Figure 11: Global Y-o-Y Growth Comparison by Form, 2025-2035
  • Figure 12: Global Attractiveness Analysis by Form
  • Figure 13: Global Value Share and BPS Analysis by Application, 2025 and 2035
  • Figure 14: Global Y-o-Y Growth Comparison by Application, 2025-2035
  • Figure 15: Global Attractiveness Analysis by Application
  • Figure 16: Global Value Share and BPS Analysis by End User, 2025 and 2035
  • Figure 17: Global Y-o-Y Growth Comparison by End User, 2025-2035
  • Figure 18: Global Attractiveness Analysis by End User
  • Figure 19: Global Value Share and BPS Analysis by Distribution Channel, 2025 and 2035
  • Figure 20: Global Y-o-Y Growth Comparison by Distribution Channel, 2025-2035
  • Figure 21: Global Attractiveness Analysis by Distribution Channel
  • Figure 22: Global Value (USD Million) Share and BPS Analysis by Region, 2025 and 2035
  • Figure 23: Global Y-o-Y Growth Comparison by Region, 2025-2035
  • Figure 24: Global Attractiveness Analysis by Region
  • Figure 25: North America Incremental $ Opportunity, 2025-2035
  • Figure 26: Latin America Incremental $ Opportunity, 2025-2035
  • Figure 27: Europe Incremental $ Opportunity, 2025-2035
  • Figure 28: East Asia Incremental $ Opportunity, 2025-2035
  • Figure 29: South Asia & Pacific Incremental $ Opportunity, 2025-2035
  • Figure 30: Middle East and Africa Incremental $ Opportunity, 2025-2035
  • Figure 31: North America Value Share and BPS Analysis by Country, 2025 and 2035
  • Figure 32: North America Value Share and BPS Analysis by Vitamin Type, 2025 and 2035
  • Figure 33: North America Y-o-Y Growth Comparison by Vitamin Type, 2025-2035
  • Figure 34: North America Attractiveness Analysis by Vitamin Type
  • Figure 35: North America Value Share and BPS Analysis by Source, 2025 and 2035
  • Figure 36: North America Y-o-Y Growth Comparison by Source, 2025-2035
  • Figure 37: North America Attractiveness Analysis by Source
  • Figure 38: North America Value Share and BPS Analysis by Form, 2025 and 2035
  • Figure 39: North America Y-o-Y Growth Comparison by Form, 2025-2035
  • Figure 40: North America Attractiveness Analysis by Form
  • Figure 41: North America Value Share and BPS Analysis by Application, 2025 and 2035
  • Figure 42: North America Y-o-Y Growth Comparison by Application, 2025-2035
  • Figure 43: North America Attractiveness Analysis by Application
  • Figure 44: North America Value Share and BPS Analysis by End User, 2025 and 2035
  • Figure 45: North America Y-o-Y Growth Comparison by End User, 2025-2035
  • Figure 46: North America Attractiveness Analysis by End User
  • Figure 47: North America Value Share and BPS Analysis by Distribution Channel, 2025 and 2035
  • Figure 48: North America Y-o-Y Growth Comparison by Distribution Channel, 2025-2035
  • Figure 49: North America Attractiveness Analysis by Distribution Channel
  • Figure 50: Latin America Value Share and BPS Analysis by Country, 2025 and 2035
  • Figure 51: Latin America Value Share and BPS Analysis by Vitamin Type, 2025 and 2035
  • Figure 52: Latin America Y-o-Y Growth Comparison by Vitamin Type, 2025-2035
  • Figure 53: Latin America Attractiveness Analysis by Vitamin Type
  • Figure 54: Latin America Value Share and BPS Analysis by Source, 2025 and 2035
  • Figure 55: Latin America Y-o-Y Growth Comparison by Source, 2025-2035
  • Figure 56: Latin America Attractiveness Analysis by Source
  • Figure 57: Latin America Value Share and BPS Analysis by Form, 2025 and 2035
  • Figure 58: Latin America Y-o-Y Growth Comparison by Form, 2025-2035
  • Figure 59: Latin America Attractiveness Analysis by Form
  • Figure 60: Latin America Value Share and BPS Analysis by Application, 2025 and 2035
  • Figure 61: Latin America Y-o-Y Growth Comparison by Application, 2025-2035
  • Figure 62: Latin America Attractiveness Analysis by Application
  • Figure 63: Latin America Value Share and BPS Analysis by End User, 2025 and 2035
  • Figure 64: Latin America Y-o-Y Growth Comparison by End User, 2025-2035
  • Figure 65: Latin America Attractiveness Analysis by End User
  • Figure 66: Latin America Value Share and BPS Analysis by Distribution Channel, 2025 and 2035
  • Figure 67: Latin America Y-o-Y Growth Comparison by Distribution Channel, 2025-2035
  • Figure 68: Latin America Attractiveness Analysis by Distribution Channel
  • Figure 69: Europe Value Share and BPS Analysis by Country, 2025 and 2035
  • Figure 70: Europe Value Share and BPS Analysis by Vitamin Type, 2025 and 2035
  • Figure 71: Europe Y-o-Y Growth Comparison by Vitamin Type, 2025-2035
  • Figure 72: Europe Attractiveness Analysis by Vitamin Type
  • Figure 73: Europe Value Share and BPS Analysis by Source, 2025 and 2035
  • Figure 74: Europe Y-o-Y Growth Comparison by Source, 2025-2035
  • Figure 75: Europe Attractiveness Analysis by Source
  • Figure 76: Europe Value Share and BPS Analysis by Form, 2025 and 2035
  • Figure 77: Europe Y-o-Y Growth Comparison by Form, 2025-2035
  • Figure 78: Europe Attractiveness Analysis by Form
  • Figure 79: Europe Value Share and BPS Analysis by Application, 2025 and 2035
  • Figure 80: Europe Y-o-Y Growth Comparison by Application, 2025-2035
  • Figure 81: Europe Attractiveness Analysis by Application
  • Figure 82: Europe Value Share and BPS Analysis by End User, 2025 and 2035
  • Figure 83: Europe Y-o-Y Growth Comparison by End User, 2025-2035
  • Figure 84: Europe Attractiveness Analysis by End User
  • Figure 85: Europe Value Share and BPS Analysis by Distribution Channel, 2025 and 2035
  • Figure 86: Europe Y-o-Y Growth Comparison by Distribution Channel, 2025-2035
  • Figure 87: Europe Attractiveness Analysis by Distribution Channel
  • Figure 88: East Asia Value Share and BPS Analysis by Country, 2025 and 2035
  • Figure 89: East Asia Value Share and BPS Analysis by Vitamin Type, 2025 and 2035
  • Figure 90: East Asia Y-o-Y Growth Comparison by Vitamin Type, 2025-2035
  • Figure 91: East Asia Attractiveness Analysis by Vitamin Type
  • Figure 92: East Asia Value Share and BPS Analysis by Source, 2025 and 2035
  • Figure 93: East Asia Y-o-Y Growth Comparison by Source, 2025-2035
  • Figure 94: East Asia Attractiveness Analysis by Source
  • Figure 95: East Asia Value Share and BPS Analysis by Form, 2025 and 2035
  • Figure 96: East Asia Y-o-Y Growth Comparison by Form, 2025-2035
  • Figure 97: East Asia Attractiveness Analysis by Form
  • Figure 98: East Asia Value Share and BPS Analysis by Application, 2025 and 2035
  • Figure 99: East Asia Y-o-Y Growth Comparison by Application, 2025-2035
  • Figure 100: East Asia Attractiveness Analysis by Application
  • Figure 101: East Asia Value Share and BPS Analysis by End User, 2025 and 2035
  • Figure 102: East Asia Y-o-Y Growth Comparison by End User, 2025-2035
  • Figure 103: East Asia Attractiveness Analysis by End User
  • Figure 104: East Asia Value Share and BPS Analysis by Distribution Channel, 2025 and 2035
  • Figure 105: East Asia Y-o-Y Growth Comparison by Distribution Channel, 2025-2035
  • Figure 106: East Asia Attractiveness Analysis by Distribution Channel
  • Figure 107: South Asia & Pacific Value Share and BPS Analysis by Country, 2025 and 2035
  • Figure 108: South Asia & Pacific Value Share and BPS Analysis by Vitamin Type, 2025 and 2035
  • Figure 109: South Asia & Pacific Y-o-Y Growth Comparison by Vitamin Type, 2025-2035
  • Figure 110: South Asia & Pacific Attractiveness Analysis by Vitamin Type
  • Figure 111: South Asia & Pacific Value Share and BPS Analysis by Source, 2025 and 2035
  • Figure 112: South Asia & Pacific Y-o-Y Growth Comparison by Source, 2025-2035
  • Figure 113: South Asia & Pacific Attractiveness Analysis by Source
  • Figure 114: South Asia & Pacific Value Share and BPS Analysis by Form, 2025 and 2035
  • Figure 115: South Asia & Pacific Y-o-Y Growth Comparison by Form, 2025-2035
  • Figure 116: South Asia & Pacific Attractiveness Analysis by Form
  • Figure 117: South Asia & Pacific Value Share and BPS Analysis by Application, 2025 and 2035
  • Figure 118: South Asia & Pacific Y-o-Y Growth Comparison by Application, 2025-2035
  • Figure 119: South Asia & Pacific Attractiveness Analysis by Application
  • Figure 120: South Asia & Pacific Value Share and BPS Analysis by End User, 2025 and 2035
  • Figure 121: South Asia & Pacific Y-o-Y Growth Comparison by End User, 2025-2035
  • Figure 122: South Asia & Pacific Attractiveness Analysis by End User
  • Figure 123: South Asia & Pacific Value Share and BPS Analysis by Distribution Channel, 2025 and 2035
  • Figure 124: South Asia & Pacific Y-o-Y Growth Comparison by Distribution Channel, 2025-2035
  • Figure 125: South Asia & Pacific Attractiveness Analysis by Distribution Channel
  • Figure 126: Middle East and Africa Value Share and BPS Analysis by Country, 2025 and 2035
  • Figure 127: Middle East and Africa Value Share and BPS Analysis by Vitamin Type, 2025 and 2035
  • Figure 128: Middle East and Africa Y-o-Y Growth Comparison by Vitamin Type, 2025-2035
  • Figure 129: Middle East and Africa Attractiveness Analysis by Vitamin Type
  • Figure 130: Middle East and Africa Value Share and BPS Analysis by Source, 2025 and 2035
  • Figure 131: Middle East and Africa Y-o-Y Growth Comparison by Source, 2025-2035
  • Figure 132: Middle East and Africa Attractiveness Analysis by Source
  • Figure 133: Middle East and Africa Value Share and BPS Analysis by Form, 2025 and 2035
  • Figure 134: Middle East and Africa Y-o-Y Growth Comparison by Form, 2025-2035
  • Figure 135: Middle East and Africa Attractiveness Analysis by Form
  • Figure 136: Middle East and Africa Value Share and BPS Analysis by Application, 2025 and 2035
  • Figure 137: Middle East and Africa Y-o-Y Growth Comparison by Application, 2025-2035
  • Figure 138: Middle East and Africa Attractiveness Analysis by Application
  • Figure 139: Middle East and Africa Value Share and BPS Analysis by End User, 2025 and 2035
  • Figure 140: Middle East and Africa Y-o-Y Growth Comparison by End User, 2025-2035
  • Figure 141: Middle East and Africa Attractiveness Analysis by End User
  • Figure 142: Middle East and Africa Value Share and BPS Analysis by Distribution Channel, 2025 and 2035
  • Figure 143: Middle East and Africa Y-o-Y Growth Comparison by Distribution Channel, 2025-2035
  • Figure 144: Middle East and Africa Attractiveness Analysis by Distribution Channel
  • Figure 145: Global - Tier Structure Analysis
  • Figure 146: Global - Company Share Analysis

Frequently Asked Questions

What is the market size of the Fermented Vitamins Market in 2025?

The market is valued at USD 6,217.5 million in 2025.

What is the projected market size of the Fermented Vitamins Market in 2035?

The market is forecasted to reach USD 11,127.3 million by 2035.

What is the CAGR of the Fermented Vitamins Market during 2025-2035?

The market is projected to expand at a CAGR of 6.0% over the forecast period.

Which is the leading vitamin type segment in 2025?

Vitamin B Complex is expected to dominate, holding a 34.0% share in 2025.

Which is the leading source of production in 2025?

Microbial Fermentation is anticipated to lead, accounting for 52.0% of the market in 2025.

Explore Similar Insights

Future Market Insights

Fermented Vitamins Market

Chat With

MaRIA

Hi There, I am MaRIA, Your Market Research Intelligence Assistant. How may I help you?