Global Kale Extract Skincare Market Size and Share Forecast Outlook 2025 to 2035

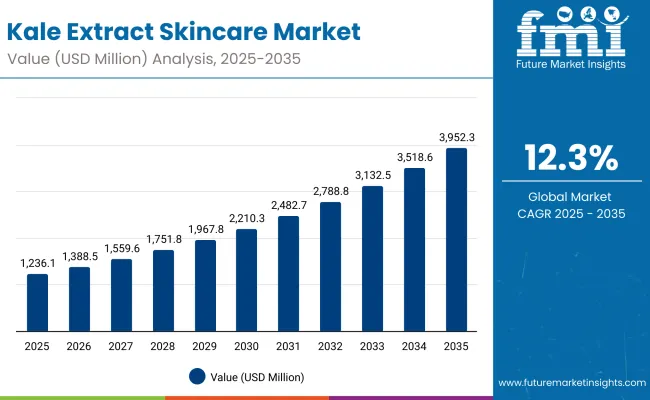
The Global Kale Extract Skincare Market is expected to record a valuation of USD 1,236.1 million in 2025 and USD 3,952.3 million in 2035, with an increase of USD 2,716.2 million, which equals a growth of over 219% across the decade. The overall expansion represents a CAGR of 12.3% and more than a 3X increase in market size.
Quick Stats for Global Kale Extract Skincare Market

  • Global Kale Extract Skincare Market Value (2025): USD 1,236.1 million
  • Global Kale Extract Skincare Market Forecast Value (2035): USD 3,952.3 million
  • Global Kale Extract Skincare Market Forecast CAGR: 12.3%
  • Leading Segment in Global Kale Extract Skincare Market in 2025: Detoxifying/antioxidant (52.5%)
  • Key Growth Regions in Global Kale Extract Skincare Market: China, India, Japan, USA
  • Top Key Players in Global Kale Extract Skincare Market: Youth To The People, The Body Shop, Innisfree, Herbivore Botanicals, L’Oréal, Origins, Murad, Fresh, Juice Beauty, Glow Recipe

Kale Extract Skincare Market

Metric Value
Global Kale Extract Skincare Market Estimated Value in (2025E) USD 1,236.1 million
Global Kale Extract Skincare Market Forecast Value in (2035F) USD 3,952.3 million
Forecast CAGR (2025 to 2035) 12.3%

During the first five-year period from 2025 to 2030, the market increases from USD 1,236.1 million to USD 2,210.3 million, adding USD 974.2 million, which accounts for nearly 36% of the total decade growth. This phase records steady adoption in antioxidant-based detoxifying products such as serums, creams, and masks, driven by consumers’ growing emphasis on natural/organic and vegan formulations. E-commerce dominates this period, catering to nearly half of the global consumer base and emerging as the preferred distribution channel.

The second half from 2030 to 2035 contributes USD 1,742 million, equal to 64% of total growth, as the market jumps from USD 2,210.3 million to USD 3,952.3 million. This acceleration is powered by rapid adoption of dermatologist-tested product lines, innovation in pollution-protection claims, and growing penetration in Asian markets such as China, India, and Japan. China expands at a CAGR of 23.1%, India at 25.1%, and Japan at 18%, making Asia the fastest-growing region. By 2035, premium clean-label products and subscription-based e-commerce bundles further reshape consumer expectations and fuel recurring revenue streams.

From 2020 to 2024, the Global Kale Extract Skincare Market expanded steadily, transitioning from niche clean-beauty adoption into mainstream superfood-based skincare. During this period, indie brands such as Youth To The People and Herbivore Botanicals shaped the competitive landscape, controlling more than half of segment revenues with positioning around natural/organic, vegan, and sustainable product claims. Multinational players like L’Oréal and The Body Shop strengthened their portfolios by incorporating kale extract in premium serums, masks, and creams, highlighting transparency and eco-friendly practices. Competitive differentiation in this early phase relied on storytelling around plant-based efficacy and environmentally responsible sourcing.

Demand for kale extract skincare expands further in 2025, with detoxifying/antioxidant claims capturing consumer attention. Natural/organic remains the leading claim, while e-commerce drives channel transformation. Traditional multinationals face intense competition from niche digital-first brands that specialize in vegan, clean-label, and dermatologist-tested products. The competitive advantage is increasingly shifting away from scale and distribution alone to brand authenticity, digital-first engagement, and consumer trust built on ingredient transparency.

Why the Global Kale Extract Skincare Market is Growing?

The Global Kale Extract Skincare Market is growing due to the dual role of kale extract as both a nutrient powerhouse and a functional skincare ingredient. Its high concentration of antioxidants, vitamins, and minerals supports detoxifying and anti-aging benefits, which resonate strongly with urban consumers exposed to pollution and lifestyle stress. In 2025, detoxifying/antioxidant claims already capture more than 52% of the market, highlighting its role as the dominant function.

The rise of natural/organic and vegan claims adds further momentum, with these categories holding over 50% of value share in 2025. Consumer perception of kale as a “superfood for skin” aligns with broader wellness trends, driving strong adoption across serums, creams, and masks. Expansion of e-commerce and specialty beauty stores as primary channels enhances market accessibility, while dermatology-backed formulations are gaining credibility among professional skincare users.

Growth is also driven by product innovations such as pollution-protection creams in Asia, subscription-based serum packs in North America, and clean-label certifications in Europe. By 2035, the market will reflect a significant structural shift toward digital-first retail, transparency-driven branding, and multifunctional claims.

Segmental Analysis

The market is segmented by function, product type, channel, and claim, reflecting diverse consumer preferences. Functional segmentation includes anti-aging, detoxifying/antioxidant, skin brightening, and pollution protection. Product type spans serums, creams/lotions, masks, and cleansers. Channels include e-commerce, specialty beauty stores, pharmacies, and mass retail. Claims cover natural/organic, vegan, clean-label, and dermatologist-tested.
Insights into the Function Segment with Detoxifying/Antioxidant Leading in Market Share

Kale Extract Skincare Market By Functiuon

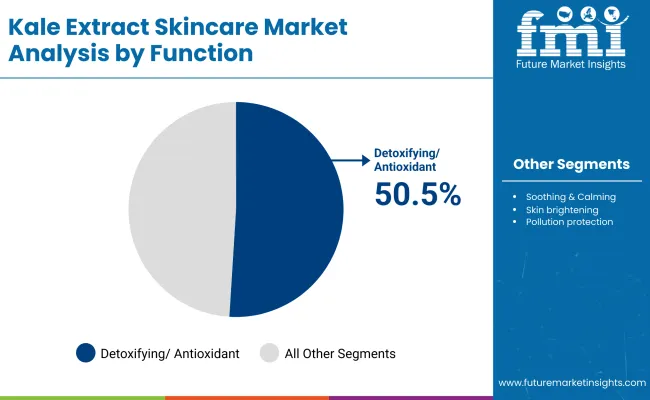
Function Segment Market Value Share, 2025
Detoxifying/antioxidant 50.5%
Others 49.5%

The detoxifying/antioxidant segment is projected to contribute 50.5% of the Global Kale Extract Skincare Market revenue in 2025, making it the leading functional category. Rising consumer concern with urban pollution and lifestyle-induced oxidative stress continues to elevate demand for detoxifying solutions. Kale extract, rich in vitamins A, C, and K, is particularly effective for skin renewal, hydration, and free-radical defense.

Premium brands leverage this function in targeted serums and creams, while mass-market players adapt it into affordable cleansers and lotions. As dermatology-backed marketing grows and anti-pollution skincare becomes mainstream, the detoxifying/antioxidant segment will sustain its leadership role and expand its influence globally.
Insights into the Product Type Segment with Serums Dominating the Demand

Kale Extract Skincare Market By Product

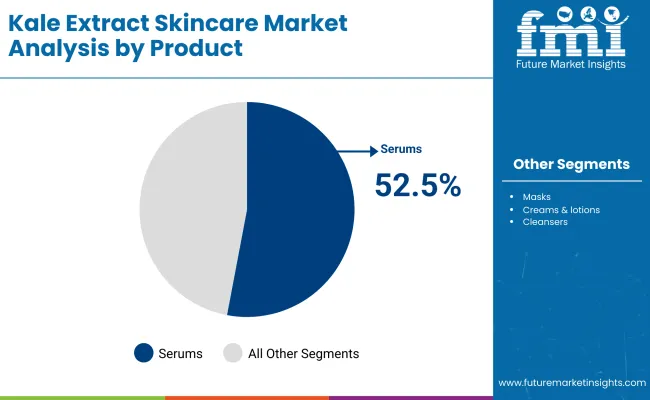
Product Type Segment Market Value Share, 2025
Serums 52.5%
Others 47.5%

The serum segment is forecasted to dominate the Global Kale Extract Skincare Market in 2025 with 52.5% share, reflecting strong consumer preference for concentrated, high-performance products. Kale extract serums deliver potent antioxidant benefits in lightweight, fast-absorbing formats, making them suitable for multi-step skincare routines.

This category benefits from premium positioning in both e-commerce and specialty beauty stores, with subscription models and influencer-driven marketing accelerating adoption. Younger consumers, particularly millennials and Gen Z, prefer serums for their efficacy in brightening, anti-aging, and detoxifying results. As clean-label and natural formulations become mainstream, serums are expected to sustain their dominance as the go-to product format for kale extract skincare globally.
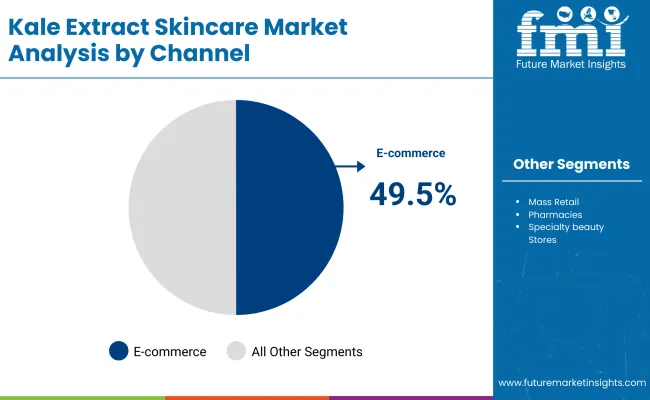
Insights into the Channel Segment with E-commerce Emerging as a Core Growth Driver

Kale Extract Skincare Market By Channel

Channel Segment Market Value Share, 2025
E-commerce 49.5%
Others 50.5%

E-commerce is projected to account for 49.5% of the Global Kale Extract Skincare Market in 2025, equating to USD 593.9 million, nearly on par with offline and other retail formats at USD 624.29 million. This near balance highlights the structural transition of beauty retail, where digital platforms are becoming as critical as traditional specialty and mass retail outlets. Kale extract skincare, being positioned as a clean-label, niche ingredient-led category, aligns strongly with e-commerce discovery, where consumers actively search for vegan, organic, and dermatologist-tested claims.

The segment’s strength lies in its synergy with digital-first indie brands such as Youth To The People, Herbivore Botanicals, and Glow Recipe, which rely heavily on D2C websites, subscription models, and influencer-driven marketing to capture Gen Z and millennial buyers. Social commerce, particularly through Instagram, TikTok, and Douyin, has amplified brand narratives around kale as a “superfood for skin,” making e-commerce a natural fit for education and engagement. By 2035, e-commerce is expected to decisively surpass traditional channels, benefiting from personalization algorithms, subscription-driven product bundles, and virtual try-on tools. The shift toward digital-first retail ecosystems positions e-commerce as the backbone of long-term growth in the Global Kale Extract Skincare Market.

What are the Drivers, Restraints, and Key Trends of the GlobalKale Extract Skincare Market ?

Drivers

Rising Demand for Antioxidant-Rich “Superfood Skincare”

The first major driver for the Global Kale Extract Skincare Market is the increasing consumer adoption of superfood-based skincare products, where kale is positioned as a premium “antioxidant powerhouse.” Kale extract is rich in vitamins A, C, and K, flavonoids, and polyphenols, which deliver proven benefits for detoxification, anti-aging, and skin brightening. In a market where 52.5% of sales in 2025 are already linked to detoxifying/antioxidant functions, kale extract is uniquely positioned as a “functional ingredient” rather than a passing trend. Unlike other botanicals, kale aligns with the wider food-beauty crossover movement, where consumers seek ingredients they already trust in their diet. This positioning boosts product credibility and consumer willingness to pay a premium, particularly in the serum and mask categories. Brands such as Youth To The People and Juice Beauty have built their market success around this very narrative, and their growth has influenced multinationals like L’Oréal to follow suit with clean-label, kale-driven lines.

E-commerce and Digital-First Distribution Channels

Another critical driver is the near 50% share of e-commerce sales in 2025, signaling a structural shift in distribution. The Global Kale Extract Skincare Market benefits from being particularly suited to online-first growth due to its positioning around niche claims (vegan, clean-label, organic). Consumers researching these claims often rely on social media, influencer reviews, and direct-to-consumer (D2C) websites. This makes digital-native brands like Herbivore Botanicals and Glow Recipe extremely competitive, as they can leverage storytelling, subscription models, and influencer-driven campaigns to quickly capture younger demographics. By 2035, subscription-based serum and mask kits, often bundled with personalization algorithms, will drive recurring revenue and long-term customer loyalty. The alignment of kale extract skincare with online discovery and social commerce is not only accelerating sales but also lowering entry barriers for indie brands that otherwise could not compete in traditional retail channels.

Restraints

High Price Sensitivity in Mass-Market Segments

While premium kale extract products thrive in e-commerce and specialty stores, one of the strongest restraints is price sensitivity in mainstream retail. Kale extract skincare, particularly in serums, is often positioned as a premium clean-label solution and carries a price tag significantly higher than conventional products. For example, average kale extract serums in 2025 are priced at 1.5x-2x higher than standard vitamin C or hyaluronic acid serums. In emerging markets such as India, where CAGR is projected at 25.1%, mass consumers remain highly price-sensitive, which restricts adoption beyond urban, affluent segments. Without localized sourcing strategies or affordable formulations, multinational players risk losing growth potential in middle-tier retail and pharmacy chains.

Supply Chain and Ingredient Standardization Challenges

Another market restraint is the lack of standardized extraction and quality protocols for kale extract. Unlike widely regulated actives such as retinol or niacinamide, kale extract is still considered a botanical ingredient with significant variability in potency depending on source, farming practices, and extraction methods. This inconsistency creates challenges for multinational players who need scalable, GMP-compliant supply chains. Small indie brands often emphasize “farm-to-face” sourcing, but this model is not feasible for large-scale expansion. Moreover, kale is perishable and seasonal, making consistent sourcing more complex compared to dried or powdered botanicals. These factors add cost pressure and regulatory risk, particularly in Europe where clean-label certifications are tightly enforced.

Key Trends

Shift Toward Pollution-Protection and Urban Defense Claims

One of the most prominent trends in the Global Kale Extract Skincare Market is the rising demand for pollution-protection products, particularly in Asia-Pacific cities such as Beijing, Shanghai, and Delhi, where urban pollution levels are high. By 2030, formulations combining kale extract with anti-pollution complexes are expected to capture significant share, especially in creams and lotions marketed as “daily defense” skincare. Pollution protection is becoming an anchor claim alongside detoxifying/antioxidant, helping brands diversify beyond anti-aging. Japanese and Korean brands are already leveraging this positioning, which explains Japan’s high projected CAGR of 18%. By 2035, pollution-protection creams enriched with kale extract will become mainstream in both premium and mass retail segments.

Premiumization Through Dermatologist-Tested and Clinical Validation

Another strong trend is the premiumization of kale extract skincare through dermatologist-tested claims. Historically, kale extract products have been marketed under the umbrella of “natural/organic” and “vegan,” but consumers are increasingly skeptical and demand scientific validation. Dermatologist-tested claims, clinical efficacy studies, and third-party certifications are becoming central to brand credibility. This trend has enabled brands like Murad and Fresh to expand their kale extract portfolios with medical-grade positioning, appealing to professional skincare buyers and dermatology clinics. By 2035, dermatologist-tested kale extract skincare is expected to move beyond niche premium lines and become a standard expectation for mid-market consumers as well, reshaping competitive dynamics.
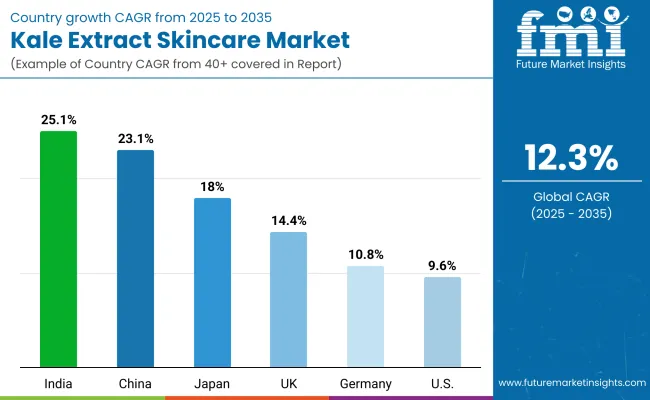
Analysis of Global Kale Extract Skincare Market By Key Countries

Country Wise Analysis Of Kale Extract Skincare Market

Countries Estimated CAGR (2025 to 2035)
China 23.1%
USA 9.6%
India 25.1%
UK 14.4%
Germany 10.8%
Japan 18.0%

Between 2025 and 2035, the Global Kale Extract Skincare Market will witness its fastest growth in India (25.1% CAGR) and China (23.1% CAGR), reflecting the strong pull of wellness-driven and natural skincare trends across Asia. In India, the convergence of ayurveda-inspired clean beauty and the rapid expansion of e-commerce platforms such as Nykaa and Purplle has created a fertile ground for kale extract formulations. Urban millennials and Gen Z consumers are particularly drawn to detoxifying/antioxidant claims, with serums and creams positioned as affordable luxury. Similarly, China benefits from its premiumization of skincare routines, with kale extract integrated into serums, sheet masks, and pollution-protection creams tailored to high urban pollution exposure. The rising influence of K-beauty and C-beauty, coupled with an appetite for natural/organic claims (53.5% share in 2025 for China), ensures kale extract becomes a trusted superfood ingredient in mainstream skincare by 2035. Japan, with an 18% CAGR, is also a significant contributor, leveraging its established dermocosmetics industry to incorporate kale extract into dermatologist-tested products and clinical-grade offerings.

Meanwhile, Western markets demonstrate steady but slower growth, led by the UK at 14.4% CAGR and Germany at 10.8% CAGR, reflecting the maturity of clean-label skincare adoption in Europe. These regions are seeing a shift from novelty to sustained demand, with kale extract becoming a standard ingredient in vegan, sustainable, and dermatologist-tested ranges. Germany’s strict regulatory standards are pushing brands toward greater ingredient standardization and certification, boosting consumer trust. In the USA, the market expands at a 9.6% CAGR, with revenues rising from USD 272.6 million in 2025 to USD 814.7 million by 2035. Growth here is shaped by indie brands like Youth To The People and large-scale players like L’Oréal, who are leveraging e-commerce, influencer-driven marketing, and subscription models. However, compared to Asia, growth in the USA and Europe is tempered by price sensitivity and the broader saturation of natural/organic skincare, leading to a competitive shift toward clinical validation and dermatologist-tested claims as key differentiators.
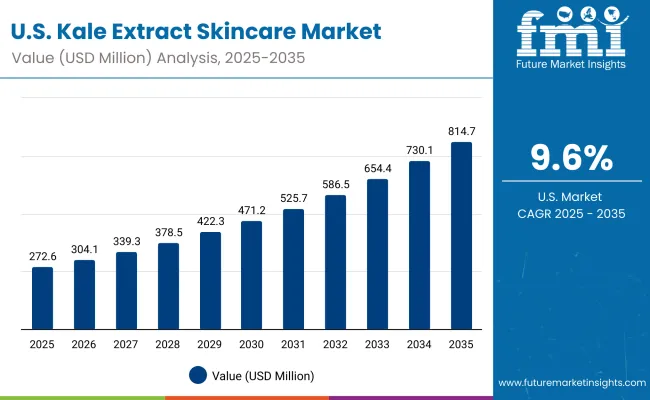
Sales Outlook for Kale Extract Skincare in the United States

Usa Kale Extract Skincare Market

Year USA Kale Extract Skincare Market (USD Million)
2025 272.6
2026 304.1
2027 339.3
2028 378.6
2029 422.4
2030 471.2
2031 525.8
2032 586.6
2033 654.5
2034 730.2
2035 814.7

The Global Kale Extract Skincare Market in the United States is projected to grow at a CAGR of 9.6%, led by premiumization in anti-aging and detoxifying product categories. Consumer adoption is being driven by serums and creams, where indie brands such as Youth To The People dominate, supported by large-scale players like L’Oréal. The USA market demonstrates a strong preference for dermatologist-tested and clinically validated claims, which are increasingly bundled with natural/organic positioning. E-commerce channels are a key enabler, representing nearly half of sales by 2025, with subscription-driven launches adding recurring revenue streams.

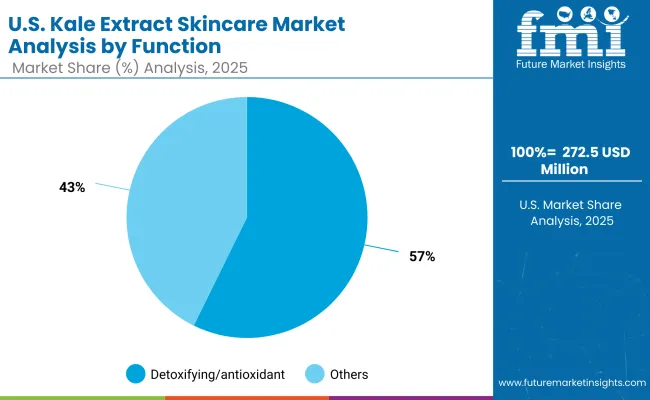
  • Detoxifying/antioxidant claims dominate, capturing 57.3% share of functional sales in 2025.
  • Serums remain the leading product type, appealing to younger, urban demographics.
  • Growth opportunities center on dermatologist-tested, clean-label formulations that differentiate from generic organic offerings.

Growth and Expansion Outlook for Kale Extract Skincare in the United Kingdom

The Global Kale Extract Skincare Market in the United Kingdom is expected to grow at a CAGR of 14.4%, supported by strong demand for natural/organic and vegan-certified products. The UK consumer base is shifting toward clean-label claims, particularly in masks and creams, while e-commerce and specialty beauty stores serve as the main growth channels. Premium players are leveraging sustainability certifications and eco-friendly packaging to appeal to environmentally conscious consumers. Collaborations with dermatology professionals and beauty retailers continue to build credibility, while mid-market chains expand private-label offerings with kale extract as a differentiator.

  • Premium skincare lines highlight kale as a superfood ingredient to appeal to clean beauty enthusiasts.
  • Retailers integrate sustainable packaging formats to align with consumer expectations.
  • Indie brands use vegan and cruelty-free certifications to expand loyalty among Gen Z buyers.

Growth and Expansion Outlook for Kale Extract Skincare in India

India is witnessing rapid growth in the Global Kale Extract Skincare Market, which is forecast to expand at a CAGR of 25.1% through 2035, the fastest globally. Rising urbanization, digital adoption, and ayurveda-inspired beauty preferences are fueling awareness of kale as a detoxifying and skin-brightening ingredient. Affordable launches by both multinational and local players are penetrating tier-2 and tier-3 cities, while premium e-commerce platforms target affluent millennials in metropolitan hubs. Educational campaigns around antioxidants and urban skin defense are helping to build brand trust, while distribution partnerships with pharmacies and specialty beauty retailers are expanding access.

  • Kale extract aligns with ayurveda-inspired clean beauty narratives, driving cultural resonance.
  • Localized product launches at affordable price points are expanding reach beyond metros.
  • Digital-first channels like Nykaa and D2C platforms are accelerating adoption among younger consumers.

Sales Outlook for Kale Extract Skincare in China

The Global Kale Extract Skincare Market in China is expected to grow at a CAGR of 23.1%, among the highest worldwide. Growth momentum is driven by premium skincare adoption, city-level pollution-protection demand, and strong local competition. Kale extract is increasingly integrated into serums, sheet masks, and anti-pollution creams, aligning with Chinese consumers’ desire for multifunctional products. Domestic players leverage competitive pricing, while multinationals differentiate through clean-label and dermatologist-tested positioning. E-commerce and social commerce platforms, including Tmall and Douyin, are central to consumer discovery and loyalty.

  • Natural/organic claims account for 53.5% of market sales in 2025, reflecting consumer trust in clean beauty.
  • Urban demand for pollution-protection creams is accelerating adoption of kale-based skincare.
  • Local brands drive affordability, while multinationals compete on premium claims and sustainability positioning.
Countries 2025 Share (%)
USA 22.1%
China 11.8%
Japan 6.9%
Germany 15.3%
UK 8.4%
India 5.2%
Countries 2035 Share (%)
USA 20.6%
China 12.8%
Japan 9.8%
Germany 13.3%
UK 7.2%
India 5.9%

Opportunity Analysis of USA Kale Extract Skincare Market

Usa Kale Extract Skincare Marketby Function

Function Segment Market Value Share, 2025
Detoxifying/antioxidant 57.3%
Others 42.7%

The Global Kale Extract Skincare Market in the United States is valued at USD 272.59 million in 2025, with detoxifying/antioxidant products leading at 57.3%, followed by other functions at 42.7%. The dominance of detoxifying/antioxidant skincare reflects the country’s consumer demand for superfood-based, antioxidant-rich beauty products that promise visible results against oxidative stress and environmental damage. Urban consumers, especially millennials and Gen Z, are investing in serums and creams positioned as premium clean-label solutions, often bundled with dermatologist-tested validation to enhance trust.

This advantage positions detoxifying/antioxidant formulations as the foundation of growth in the USA market. While anti-aging remains a core demand driver, detoxification-oriented skincare resonates strongly with consumers living in high-stress, urban environments. Specialty beauty stores and e-commerce platforms are accelerating the reach of such products. By 2035, with USA revenues crossing USD 814.66 million, integration of kale extract with AI-powered personalized skincare regimens and subscription delivery models will further strengthen this category.
  • Market size for the USA in 2025 is USD 272.59 million
  • Global market share is approximately 22.1% in 2025
  • Detoxifying/antioxidant leads at 57.3% due to antioxidant and wellness positioning

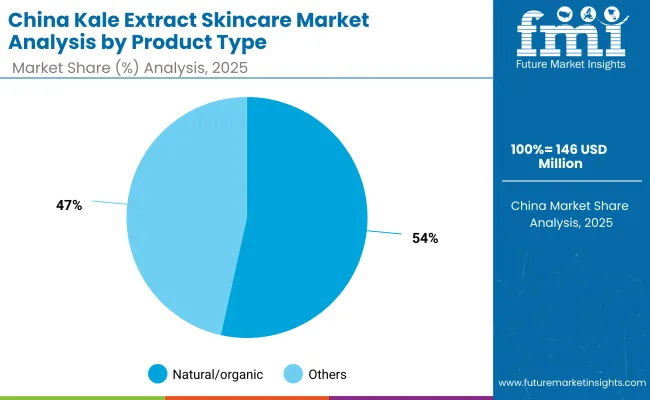
Opportunity Analysis of China Kale Extract Skincare Market

China Kale Extract Skincare Market By Product Type

Claim Segment Market Value Share, 2025
Natural/organic 53.5%
Others 46.5%

The Global Kale Extract Skincare Market in China is valued at USD 146 million in 2025, with natural/organic claims leading at 53.5%, followed by other claims at 46.5%. The dominance of natural/organic positioning is a direct outcome of China’s consumer shift toward clean beauty, plant-based, and premium wellness-inspired skincare. These claims resonate strongly in tier-1 and tier-2 urban centers, where pollution levels and environmental stress drive consumer preference for detoxifying and protective formulations.

This advantage positions natural/organic kale extract skincare as an essential category in China’s beauty ecosystem, particularly in serums, sheet masks, and anti-pollution creams. Local e-commerce giants such as Tmall and JD.com, as well as social platforms like Douyin, are critical to consumer discovery. Domestic brands leverage competitive pricing, while global brands focus on premium certifications and dermatologist-tested claims. With China’s CAGR projected at 23.1%, the market will more than triple in size by 2035, fueled by government support for clean-label standards and the rapid rise of C-beauty innovation.
  • Market size for China in 2025 is USD 146 million
  • Global market share is approximately 11.8% in 2025
  • Natural/organic leads at 53.5% due to trust in clean beauty claims

Competitive Landscape of Global Kale Extract Skincare Market

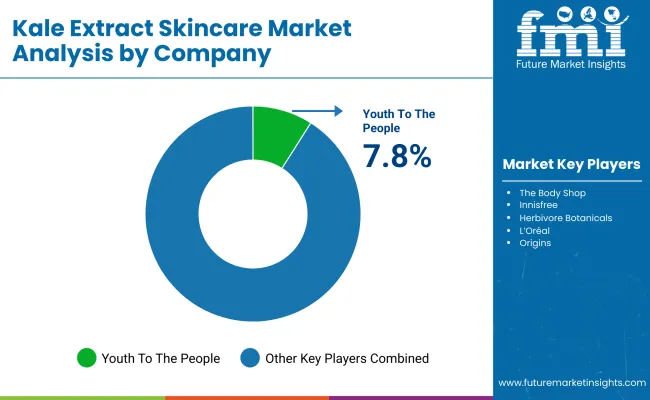
Kale Extract Skincare Market By Company

Company Global Value Share 2025
Youth To The People 7.8%
Others 92.2%

The Global Kale Extract Skincare Market is moderately fragmented, with indie clean-beauty leaders, multinational conglomerates, and niche-focused specialists competing across diverse consumer segments. Youth To The People leads with a 7.8% global share, driven by its strong positioning around superfood-powered, vegan, and eco-friendly skincare lines. Its emphasis on serums and masks has made it a trusted brand among millennial and Gen Z consumers worldwide.

Large multinationals such as L’Oréal, The Body Shop, and Innisfree hold significant presence through diversified portfolios and wide distribution networks. Their strategies emphasize scaling kale extract skincare by combining natural/organic claims with dermatologist-tested credibility. These brands also leverage sustainable packaging, clean-label marketing, and AI-powered personalization to maintain competitive positioning.

Mid-sized players including Herbivore Botanicals, Murad, Fresh, Juice Beauty, and Glow Recipe cater to premium and niche audiences, focusing on vegan-certified, cruelty-free, and influencer-driven product launches. These brands are highly relevant in digital-first channels, particularly in e-commerce and social commerce platforms.

Competitive differentiation is shifting away from ingredient novelty toward ecosystem-driven brand equity. Storytelling around sustainability, clinical validation, and digital engagement has become central to consumer trust. Brands that integrate kale extract into customizable routines, subscription models, and multi-claim formulations are gaining share, highlighting a decisive move toward authenticity, innovation, and recurring consumer engagement.

Key Developments in Global Kale Extract Skincare Market

  • On March 14, 2024, Youth To The People launched its Superfood Firm + Brighten Serum enriched with kale and vitamin C, targeting antioxidant defense and skin brightening. The product was rolled out exclusively via Sephora online before expanding to global retail stores.
  • On July 22, 2024, L’Oréal announced the expansion of its Botanicals Fresh Care line to include a kale-infused anti-pollution cream. The launch was supported by a sustainability campaign emphasizing eco-friendly packaging and transparency in ingredient sourcing

Scope of the Report

Item Value
Quantitative Units USD 1,236.1 million
Function Anti-aging, Detoxifying/antioxidant, Skin brightening, and Pollution protection
Product Type Serums, Creams/lotions, Masks, and Cleansers
Channel E-commerce, Pharmacies, Specialty beauty stores, and Mass retail
Claim Natural/organic, Vegan, Dermatologist-tested, and Clean-label
Regions Covered North America, Europe, Asia-Pacific, Latin America, Middle East & Africa
Country Covered United States, Canada, Germany, France, United Kingdom, China, Japan, India, Brazil, South Africa
Key Companies Profiled Youth To The People, The Body Shop, Innisfree, Herbivore Botanicals, L’Oréal, Origins, Murad, Fresh, Juice Beauty, Glow Recipe
Additional Attributes Dollar sales by function, product type, and channel, adoption trends in detoxifying/antioxidant and skin brightening skincare, rising demand for vegan and natural/organic claims, segment-specific growth in serums and e-commerce, integration of kale extract with other botanicals (vitamin C, niacinamide, and hyaluronic acid), regional trends influenced by K-beauty and clean-label movements, and innovations in upcycled and biotech-derived kale sourcing.

Key Segments

By Function:

  • Anti-aging
  • Detoxifying/antioxidant
  • Skin brightening
  • Pollution protection

By Product Type:

  • Serums
  • Creams/lotions
  • Masks
  • Cleansers

By Channel:

  • E-commerce
  • Pharmacies
  • Mass retail
  • Specialty beauty stores

By Claim:

  • Natural/organic
  • Vegan
  • Dermatologist-tested
  • Clean-label

By Region:

  • North America
  • Latin America
  • Europe
  • East Asia
  • South Asia & Pacific
  • Middle East and Africa

Table of Content

  1. Executive Summary
    • Global Market Outlook
    • Demand-side Trends
    • Supply-side Trends
    • Technology Roadmap Analysis
    • Analysis and Recommendations
  2. Market Overview
    • Market Coverage / Taxonomy
    • Market Definition / Scope / Limitations
  3. Market Background
    • Market Dynamics
      • Drivers
      • Restraints
      • Opportunity
      • Trends
    • Scenario Forecast
      • Demand in Optimistic Scenario
      • Demand in Likely Scenario
      • Demand in Conservative Scenario
    • Opportunity Map Analysis
    • Product Life Cycle Analysis
    • Supply Chain Analysis
      • Supply Side Participants and their Roles
        • Producers
        • Mid-Level Participants (Traders/ Agents/ Brokers)
        • Wholesalers and Distributors
      • Value Added and Value Created at Node in the Supply Chain
      • List of Raw Material Suppliers
      • List of Existing and Potential Buyer’s
    • Investment Feasibility Matrix
    • Value Chain Analysis
      • Profit Margin Analysis
      • Wholesalers and Distributors
      • Retailers
    • PESTLE and Porter’s Analysis
    • Regulatory Landscape
      • By Key Regions
      • By Key Countries
    • Regional Parent Market Outlook
    • Production and Consumption Statistics
    • Import and Export Statistics
  4. Global Market Analysis 2020 to 2024 and Forecast, 2025 to 2035
    • Historical Market Size Value (USD Million) & Volume (Units) Analysis, 2020 to 2024
    • Current and Future Market Size Value (USD Million) & Volume (Units) Projections, 2025 to 2035
      • Y-o-Y Growth Trend Analysis
      • Absolute $ Opportunity Analysis
  5. Global Market Analysis 2020 to 2024 and Forecast 2025 to 2035, By Function
    • Introduction / Key Findings
    • Historical Market Size Value (USD Million) & Volume (Units) Analysis By Function, 2020 to 2024
    • Current and Future Market Size Value (USD Million) & Volume (Units) Analysis and Forecast By Function, 2025 to 2035
      • Anti-aging
      • Detoxifying/antioxidant
      • Skin brightening
      • Pollution protection
    • Y-o-Y Growth Trend Analysis By Function, 2020 to 2024
    • Absolute $ Opportunity Analysis By Function, 2025 to 2035
  6. Global Market Analysis 2020 to 2024 and Forecast 2025 to 2035, By Product Type
    • Introduction / Key Findings
    • Historical Market Size Value (USD Million) & Volume (Units) Analysis By Product Type, 2020 to 2024
    • Current and Future Market Size Value (USD Million) & Volume (Units) Analysis and Forecast By Product Type, 2025 to 2035
      • Serums
      • Creams/lotions
      • Masks
      • Cleansers
    • Y-o-Y Growth Trend Analysis By Product Type, 2020 to 2024
    • Absolute $ Opportunity Analysis By Product Type, 2025 to 2035
  7. Global Market Analysis 2020 to 2024 and Forecast 2025 to 2035, By Channel
    • Introduction / Key Findings
    • Historical Market Size Value (USD Million) & Volume (Units) Analysis By Channel, 2020 to 2024
    • Current and Future Market Size Value (USD Million) & Volume (Units) Analysis and Forecast By Channel, 2025 to 2035
      • E-commerce
      • Pharmacies
      • Mass retail
      • Specialty beauty stores
    • Y-o-Y Growth Trend Analysis By Channel, 2020 to 2024
    • Absolute $ Opportunity Analysis By Channel, 2025 to 2035
  8. Global Market Analysis 2020 to 2024 and Forecast 2025 to 2035, By Claim
    • Introduction / Key Findings
    • Historical Market Size Value (USD Million) & Volume (Units) Analysis By Claim, 2020 to 2024
    • Current and Future Market Size Value (USD Million) & Volume (Units) Analysis and Forecast By Claim, 2025 to 2035
      • Natural/organic
      • Vegan
      • Dermatologist-tested
      • Clean-label
    • Y-o-Y Growth Trend Analysis By Claim, 2020 to 2024
    • Absolute $ Opportunity Analysis By Claim, 2025 to 2035
  9. Global Market Analysis 2020 to 2024 and Forecast 2025 to 2035, By Region
    • Introduction
    • Historical Market Size Value (USD Million) & Volume (Units) Analysis By Region, 2020 to 2024
    • Current Market Size Value (USD Million) & Volume (Units) Analysis and Forecast By Region, 2025 to 2035
      • North America
      • Latin America
      • Europe
      • East Asia
      • South Asia & Pacific
      • Middle East and Africa
    • Market Attractiveness Analysis By Region
  10. North America Market Analysis 2020 to 2024 and Forecast 2025 to 2035, By Country
    • Historical Market Size Value (USD Million) & Volume (Units) Trend Analysis By Market Taxonomy, 2020 to 2024
    • Market Size Value (USD Million) & Volume (Units) Forecast By Market Taxonomy, 2025 to 2035
      • By Country
        • U.S.
        • Canada
      • By Function
      • By Product Type
      • By Channel
      • By Claim
    • Market Attractiveness Analysis
      • By Country
      • By Function
      • By Product Type
      • By Channel
      • By Claim
    • Key Takeaways
  11. Latin America Market Analysis 2020 to 2024 and Forecast 2025 to 2035, By Country
    • Historical Market Size Value (USD Million) & Volume (Units) Trend Analysis By Market Taxonomy, 2020 to 2024
    • Market Size Value (USD Million) & Volume (Units) Forecast By Market Taxonomy, 2025 to 2035
      • By Country
        • Brazil
        • Mexico
        • Colombia
        • Rest of Latin America
      • By Function
      • By Product Type
      • By Channel
      • By Claim
    • Market Attractiveness Analysis
      • By Country
      • By Function
      • By Product Type
      • By Channel
      • By Claim
    • Key Takeaways
  12. Europe Market Analysis 2020 to 2024 and Forecast 2025 to 2035, By Country
    • Historical Market Size Value (USD Million) & Volume (Units) Trend Analysis By Market Taxonomy, 2020 to 2024
    • Market Size Value (USD Million) & Volume (Units) Forecast By Market Taxonomy, 2025 to 2035
      • By Country
        • Germany
        • U.K.
        • France
        • Italy
        • Spain
        • Belgium
        • Netherlands
        • Nordic
        • Switzerland
        • Russia
        • Poland
        • Rest of Europe
      • By Function
      • By Product Type
      • By Channel
      • By Claim
    • Market Attractiveness Analysis
      • By Country
      • By Function
      • By Product Type
      • By Channel
      • By Claim
    • Key Takeaways
  13. East Asia Market Analysis 2020 to 2024 and Forecast 2025 to 2035, By Country
    • Historical Market Size Value (USD Million) & Volume (Units) Trend Analysis By Market Taxonomy, 2020 to 2024
    • Market Size Value (USD Million) & Volume (Units) Forecast By Market Taxonomy, 2025 to 2035
      • By Country
        • China
        • Japan
        • South Korea
      • By Function
      • By Product Type
      • By Channel
      • By Claim
    • Market Attractiveness Analysis
      • By Country
      • By Function
      • By Product Type
      • By Channel
      • By Claim
    • Key Takeaways
  14. South Asia & Pacific Market Analysis 2020 to 2024 and Forecast 2025 to 2035, By Country
    • Historical Market Size Value (USD Million) & Volume (Units) Trend Analysis By Market Taxonomy, 2020 to 2024
    • Market Size Value (USD Million) & Volume (Units) Forecast By Market Taxonomy, 2025 to 2035
      • By Country
        • India
        • Thailand
        • Malaysia
        • Indonesia
        • Singapore
        • Vietnam
        • Australia
        • New Zealand
        • Rest of South Asia
      • By Function
      • By Product Type
      • By Channel
      • By Claim
    • Market Attractiveness Analysis
      • By Country
      • By Function
      • By Product Type
      • By Channel
      • By Claim
    • Key Takeaways
  15. Middle East and Africa Market Analysis 2020 to 2024 and Forecast 2025 to 2035, By Country
    • Historical Market Size Value (USD Million) & Volume (Units) Trend Analysis By Market Taxonomy, 2020 to 2024
    • Market Size Value (USD Million) & Volume (Units) Forecast By Market Taxonomy, 2025 to 2035
      • By Country
        • Turkey
        • UAE
        • Saudi Arabia
        • Israel
        • Other GCC Countries
        • North Africa
        • South Africa
      • By Function
      • By Product Type
      • By Channel
      • By Claim
    • Market Attractiveness Analysis
      • By Country
      • By Function
      • By Product Type
      • By Channel
      • By Claim
    • Key Takeaways
  16. Key Countries Market Analysis
    • U.S.
      • Pricing Analysis
      • Market Share Analysis, 2024
        • By Function
        • By Product Type
        • By Channel
        • By Claim
    • Canada
      • Pricing Analysis
      • Market Share Analysis, 2024
        • By Function
        • By Product Type
        • By Channel
        • By Claim
    • Brazil
      • Pricing Analysis
      • Market Share Analysis, 2024
        • By Function
        • By Product Type
        • By Channel
        • By Claim
    • Mexico
      • Pricing Analysis
      • Market Share Analysis, 2024
        • By Function
        • By Product Type
        • By Channel
        • By Claim
    • Colombia
      • Pricing Analysis
      • Market Share Analysis, 2024
        • By Function
        • By Product Type
        • By Channel
        • By Claim
    • Germany
      • Pricing Analysis
      • Market Share Analysis, 2024
        • By Function
        • By Product Type
        • By Channel
        • By Claim
    • U.K.
      • Pricing Analysis
      • Market Share Analysis, 2024
        • By Function
        • By Product Type
        • By Channel
        • By Claim
    • France
      • Pricing Analysis
      • Market Share Analysis, 2024
        • By Function
        • By Product Type
        • By Channel
        • By Claim
    • Italy
      • Pricing Analysis
      • Market Share Analysis, 2024
        • By Function
        • By Product Type
        • By Channel
        • By Claim
    • Spain
      • Pricing Analysis
      • Market Share Analysis, 2024
        • By Function
        • By Product Type
        • By Channel
        • By Claim
    • Belgium
      • Pricing Analysis
      • Market Share Analysis, 2024
        • By Function
        • By Product Type
        • By Channel
        • By Claim
    • Netherlands
      • Pricing Analysis
      • Market Share Analysis, 2024
        • By Function
        • By Product Type
        • By Channel
        • By Claim
    • Nordic
      • Pricing Analysis
      • Market Share Analysis, 2024
        • By Function
        • By Product Type
        • By Channel
        • By Claim
    • Switzerland
      • Pricing Analysis
      • Market Share Analysis, 2024
        • By Function
        • By Product Type
        • By Channel
        • By Claim
    • Russia
      • Pricing Analysis
      • Market Share Analysis, 2024
        • By Function
        • By Product Type
        • By Channel
        • By Claim
    • Poland
      • Pricing Analysis
      • Market Share Analysis, 2024
        • By Function
        • By Product Type
        • By Channel
        • By Claim
    • China
      • Pricing Analysis
      • Market Share Analysis, 2024
        • By Function
        • By Product Type
        • By Channel
        • By Claim
    • Japan
      • Pricing Analysis
      • Market Share Analysis, 2024
        • By Function
        • By Product Type
        • By Channel
        • By Claim
    • South Korea
      • Pricing Analysis
      • Market Share Analysis, 2024
        • By Function
        • By Product Type
        • By Channel
        • By Claim
    • India
      • Pricing Analysis
      • Market Share Analysis, 2024
        • By Function
        • By Product Type
        • By Channel
        • By Claim
    • Thailand
      • Pricing Analysis
      • Market Share Analysis, 2024
        • By Function
        • By Product Type
        • By Channel
        • By Claim
    • Indonesia
      • Pricing Analysis
      • Market Share Analysis, 2024
        • By Function
        • By Product Type
        • By Channel
        • By Claim
    • Australia
      • Pricing Analysis
      • Market Share Analysis, 2024
        • By Function
        • By Product Type
        • By Channel
        • By Claim
    • New Zealand
      • Pricing Analysis
      • Market Share Analysis, 2024
        • By Function
        • By Product Type
        • By Channel
        • By Claim
    • Turkey
      • Pricing Analysis
      • Market Share Analysis, 2024
        • By Function
        • By Product Type
        • By Channel
        • By Claim
    • UAE
      • Pricing Analysis
      • Market Share Analysis, 2024
        • By Function
        • By Product Type
        • By Channel
        • By Claim
    • Saudi Arabia
      • Pricing Analysis
      • Market Share Analysis, 2024
        • By Function
        • By Product Type
        • By Channel
        • By Claim
    • Israel
      • Pricing Analysis
      • Market Share Analysis, 2024
        • By Function
        • By Product Type
        • By Channel
        • By Claim
    • North Africa
      • Pricing Analysis
      • Market Share Analysis, 2024
        • By Function
        • By Product Type
        • By Channel
        • By Claim
    • South Africa
      • Pricing Analysis
      • Market Share Analysis, 2024
        • By Function
        • By Product Type
        • By Channel
        • By Claim
  17. Market Structure Analysis
    • Competition Dashboard
    • Competition Benchmarking
    • Market Share Analysis of Top Players
      • By Regional
      • By Function
      • By Product Type
      • By Channel
      • By Claim
  18. Competition Analysis
    • Competition Deep Dive
      • Youth To The People
        • Overview
        • Product Portfolio
        • Profitability by Market Segments (Product/Age /Sales Channel/Region)
        • Sales Footprint
        • Strategy Overview
          • Marketing Strategy
          • Product Strategy
          • Channel Strategy
      • The Body Shop
        • Overview
        • Product Portfolio
        • Profitability by Market Segments (Product/Age /Sales Channel/Region)
        • Sales Footprint
        • Strategy Overview
          • Marketing Strategy
          • Product Strategy
          • Channel Strategy
      • Innisfree
        • Overview
        • Product Portfolio
        • Profitability by Market Segments (Product/Age /Sales Channel/Region)
        • Sales Footprint
        • Strategy Overview
          • Marketing Strategy
          • Product Strategy
          • Channel Strategy
      • Herbivore Botanicals
        • Overview
        • Product Portfolio
        • Profitability by Market Segments (Product/Age /Sales Channel/Region)
        • Sales Footprint
        • Strategy Overview
          • Marketing Strategy
          • Product Strategy
          • Channel Strategy
      • L’Oréal
        • Overview
        • Product Portfolio
        • Profitability by Market Segments (Product/Age /Sales Channel/Region)
        • Sales Footprint
        • Strategy Overview
          • Marketing Strategy
          • Product Strategy
          • Channel Strategy
      • Origins
        • Overview
        • Product Portfolio
        • Profitability by Market Segments (Product/Age /Sales Channel/Region)
        • Sales Footprint
        • Strategy Overview
          • Marketing Strategy
          • Product Strategy
          • Channel Strategy
      • Murad
        • Overview
        • Product Portfolio
        • Profitability by Market Segments (Product/Age /Sales Channel/Region)
        • Sales Footprint
        • Strategy Overview
          • Marketing Strategy
          • Product Strategy
          • Channel Strategy
      • Fresh
        • Overview
        • Product Portfolio
        • Profitability by Market Segments (Product/Age /Sales Channel/Region)
        • Sales Footprint
        • Strategy Overview
          • Marketing Strategy
          • Product Strategy
          • Channel Strategy
      • Juice Beauty
        • Overview
        • Product Portfolio
        • Profitability by Market Segments (Product/Age /Sales Channel/Region)
        • Sales Footprint
        • Strategy Overview
          • Marketing Strategy
          • Product Strategy
          • Channel Strategy
      • Glow Recipe
        • Overview
        • Product Portfolio
        • Profitability by Market Segments (Product/Age /Sales Channel/Region)
        • Sales Footprint
        • Strategy Overview
          • Marketing Strategy
          • Product Strategy
          • Channel Strategy
  19. Assumptions & Acronyms Used
  20. Research Methodology

List of Tables

  • Table 1: Global Market Value (USD Million) Forecast by Region, 2020-2035
  • Table 2: Global Market Volume (Units) Forecast by Region, 2020-2035
  • Table 3: Global Market Value (USD Million) Forecast by Function, 2020-2035
  • Table 4: Global Market Volume (Units) Forecast by Function, 2020-2035
  • Table 5: Global Market Value (USD Million) Forecast by Product Type, 2020-2035
  • Table 6: Global Market Volume (Units) Forecast by Product Type, 2020-2035
  • Table 7: Global Market Value (USD Million) Forecast by Channel, 2020-2035
  • Table 8: Global Market Volume (Units) Forecast by Channel, 2020-2035
  • Table 9: Global Market Value (USD Million) Forecast by Claim, 2020-2035
  • Table 10: Global Market Volume (Units) Forecast by Claim, 2020-2035
  • Table 11: North America Market Value (USD Million) Forecast by Country, 2020-2035
  • Table 12: North America Market Volume (Units) Forecast by Country, 2020-2035
  • Table 13: North America Market Value (USD Million) Forecast by Function, 2020-2035
  • Table 14: North America Market Volume (Units) Forecast by Function, 2020-2035
  • Table 15: North America Market Value (USD Million) Forecast by Product Type, 2020-2035
  • Table 16: North America Market Volume (Units) Forecast by Product Type, 2020-2035
  • Table 17: North America Market Value (USD Million) Forecast by Channel, 2020-2035
  • Table 18: North America Market Volume (Units) Forecast by Channel, 2020-2035
  • Table 19: North America Market Value (USD Million) Forecast by Claim, 2020-2035
  • Table 20: North America Market Volume (Units) Forecast by Claim, 2020-2035
  • Table 21: Latin America Market Value (USD Million) Forecast by Country, 2020-2035
  • Table 22: Latin America Market Volume (Units) Forecast by Country, 2020-2035
  • Table 23: Latin America Market Value (USD Million) Forecast by Function, 2020-2035
  • Table 24: Latin America Market Volume (Units) Forecast by Function, 2020-2035
  • Table 25: Latin America Market Value (USD Million) Forecast by Product Type, 2020-2035
  • Table 26: Latin America Market Volume (Units) Forecast by Product Type, 2020-2035
  • Table 27: Latin America Market Value (USD Million) Forecast by Channel, 2020-2035
  • Table 28: Latin America Market Volume (Units) Forecast by Channel, 2020-2035
  • Table 29: Latin America Market Value (USD Million) Forecast by Claim, 2020-2035
  • Table 30: Latin America Market Volume (Units) Forecast by Claim, 2020-2035
  • Table 31: Europe Market Value (USD Million) Forecast by Country, 2020-2035
  • Table 32: Europe Market Volume (Units) Forecast by Country, 2020-2035
  • Table 33: Europe Market Value (USD Million) Forecast by Function, 2020-2035
  • Table 34: Europe Market Volume (Units) Forecast by Function, 2020-2035
  • Table 35: Europe Market Value (USD Million) Forecast by Product Type, 2020-2035
  • Table 36: Europe Market Volume (Units) Forecast by Product Type, 2020-2035
  • Table 37: Europe Market Value (USD Million) Forecast by Channel, 2020-2035
  • Table 38: Europe Market Volume (Units) Forecast by Channel, 2020-2035
  • Table 39: Europe Market Value (USD Million) Forecast by Claim, 2020-2035
  • Table 40: Europe Market Volume (Units) Forecast by Claim, 2020-2035
  • Table 41: East Asia Market Value (USD Million) Forecast by Country, 2020-2035
  • Table 42: East Asia Market Volume (Units) Forecast by Country, 2020-2035
  • Table 43: East Asia Market Value (USD Million) Forecast by Function, 2020-2035
  • Table 44: East Asia Market Volume (Units) Forecast by Function, 2020-2035
  • Table 45: East Asia Market Value (USD Million) Forecast by Product Type, 2020-2035
  • Table 46: East Asia Market Volume (Units) Forecast by Product Type, 2020-2035
  • Table 47: East Asia Market Value (USD Million) Forecast by Channel, 2020-2035
  • Table 48: East Asia Market Volume (Units) Forecast by Channel, 2020-2035
  • Table 49: East Asia Market Value (USD Million) Forecast by Claim, 2020-2035
  • Table 50: East Asia Market Volume (Units) Forecast by Claim, 2020-2035
  • Table 51: South Asia & Pacific Market Value (USD Million) Forecast by Country, 2020-2035
  • Table 52: South Asia & Pacific Market Volume (Units) Forecast by Country, 2020-2035
  • Table 53: South Asia & Pacific Market Value (USD Million) Forecast by Function, 2020-2035
  • Table 54: South Asia & Pacific Market Volume (Units) Forecast by Function, 2020-2035
  • Table 55: South Asia & Pacific Market Value (USD Million) Forecast by Product Type, 2020-2035
  • Table 56: South Asia & Pacific Market Volume (Units) Forecast by Product Type, 2020-2035
  • Table 57: South Asia & Pacific Market Value (USD Million) Forecast by Channel, 2020-2035
  • Table 58: South Asia & Pacific Market Volume (Units) Forecast by Channel, 2020-2035
  • Table 59: South Asia & Pacific Market Value (USD Million) Forecast by Claim, 2020-2035
  • Table 60: South Asia & Pacific Market Volume (Units) Forecast by Claim, 2020-2035
  • Table 61: Middle East and Africa Market Value (USD Million) Forecast by Country, 2020-2035
  • Table 62: Middle East and Africa Market Volume (Units) Forecast by Country, 2020-2035
  • Table 63: Middle East and Africa Market Value (USD Million) Forecast by Function, 2020-2035
  • Table 64: Middle East and Africa Market Volume (Units) Forecast by Function, 2020-2035
  • Table 65: Middle East and Africa Market Value (USD Million) Forecast by Product Type, 2020-2035
  • Table 66: Middle East and Africa Market Volume (Units) Forecast by Product Type, 2020-2035
  • Table 67: Middle East and Africa Market Value (USD Million) Forecast by Channel, 2020-2035
  • Table 68: Middle East and Africa Market Volume (Units) Forecast by Channel, 2020-2035
  • Table 69: Middle East and Africa Market Value (USD Million) Forecast by Claim, 2020-2035
  • Table 70: Middle East and Africa Market Volume (Units) Forecast by Claim, 2020-2035

List of Figures

  • Figure 1: Global Market Value (USD Million) by Function, 2025-2035
  • Figure 2: Global Market Value (USD Million) by Product Type, 2025-2035
  • Figure 3: Global Market Value (USD Million) by Channel, 2025-2035
  • Figure 4: Global Market Value (USD Million) by Claim, 2025-2035
  • Figure 5: Global Market Value (USD Million) by Region, 2025-2035
  • Figure 6: Global Market Value (USD Million) Analysis by Region, 2020-2035
  • Figure 7: Global Market Volume (Units) Analysis by Region, 2020-2035
  • Figure 8: Global Market Value Share (%) and BPS Analysis by Region, 2025-2035
  • Figure 9: Global Market Y-o-Y Growth (%) Projections by Region, 2025-2035
  • Figure 10: Global Market Value (USD Million) Analysis by Function, 2020-2035
  • Figure 11: Global Market Volume (Units) Analysis by Function, 2020-2035
  • Figure 12: Global Market Value Share (%) and BPS Analysis by Function, 2025-2035
  • Figure 13: Global Market Y-o-Y Growth (%) Projections by Function, 2025-2035
  • Figure 14: Global Market Value (USD Million) Analysis by Product Type, 2020-2035
  • Figure 15: Global Market Volume (Units) Analysis by Product Type, 2020-2035
  • Figure 16: Global Market Value Share (%) and BPS Analysis by Product Type, 2025-2035
  • Figure 17: Global Market Y-o-Y Growth (%) Projections by Product Type, 2025-2035
  • Figure 18: Global Market Value (USD Million) Analysis by Channel, 2020-2035
  • Figure 19: Global Market Volume (Units) Analysis by Channel, 2020-2035
  • Figure 20: Global Market Value Share (%) and BPS Analysis by Channel, 2025-2035
  • Figure 21: Global Market Y-o-Y Growth (%) Projections by Channel, 2025-2035
  • Figure 22: Global Market Value (USD Million) Analysis by Claim, 2020-2035
  • Figure 23: Global Market Volume (Units) Analysis by Claim, 2020-2035
  • Figure 24: Global Market Value Share (%) and BPS Analysis by Claim, 2025-2035
  • Figure 25: Global Market Y-o-Y Growth (%) Projections by Claim, 2025-2035
  • Figure 26: Global Market Attractiveness by Function, 2025-2035
  • Figure 27: Global Market Attractiveness by Product Type, 2025-2035
  • Figure 28: Global Market Attractiveness by Channel, 2025-2035
  • Figure 29: Global Market Attractiveness by Claim, 2025-2035
  • Figure 30: Global Market Attractiveness by Region, 2025-2035
  • Figure 31: North America Market Value (USD Million) by Function, 2025-2035
  • Figure 32: North America Market Value (USD Million) by Product Type, 2025-2035
  • Figure 33: North America Market Value (USD Million) by Channel, 2025-2035
  • Figure 34: North America Market Value (USD Million) by Claim, 2025-2035
  • Figure 35: North America Market Value (USD Million) by Country, 2025-2035
  • Figure 36: North America Market Value (USD Million) Analysis by Country, 2020-2035
  • Figure 37: North America Market Volume (Units) Analysis by Country, 2020-2035
  • Figure 38: North America Market Value Share (%) and BPS Analysis by Country, 2025-2035
  • Figure 39: North America Market Y-o-Y Growth (%) Projections by Country, 2025-2035
  • Figure 40: North America Market Value (USD Million) Analysis by Function, 2020-2035
  • Figure 41: North America Market Volume (Units) Analysis by Function, 2020-2035
  • Figure 42: North America Market Value Share (%) and BPS Analysis by Function, 2025-2035
  • Figure 43: North America Market Y-o-Y Growth (%) Projections by Function, 2025-2035
  • Figure 44: North America Market Value (USD Million) Analysis by Product Type, 2020-2035
  • Figure 45: North America Market Volume (Units) Analysis by Product Type, 2020-2035
  • Figure 46: North America Market Value Share (%) and BPS Analysis by Product Type, 2025-2035
  • Figure 47: North America Market Y-o-Y Growth (%) Projections by Product Type, 2025-2035
  • Figure 48: North America Market Value (USD Million) Analysis by Channel, 2020-2035
  • Figure 49: North America Market Volume (Units) Analysis by Channel, 2020-2035
  • Figure 50: North America Market Value Share (%) and BPS Analysis by Channel, 2025-2035
  • Figure 51: North America Market Y-o-Y Growth (%) Projections by Channel, 2025-2035
  • Figure 52: North America Market Value (USD Million) Analysis by Claim, 2020-2035
  • Figure 53: North America Market Volume (Units) Analysis by Claim, 2020-2035
  • Figure 54: North America Market Value Share (%) and BPS Analysis by Claim, 2025-2035
  • Figure 55: North America Market Y-o-Y Growth (%) Projections by Claim, 2025-2035
  • Figure 56: North America Market Attractiveness by Function, 2025-2035
  • Figure 57: North America Market Attractiveness by Product Type, 2025-2035
  • Figure 58: North America Market Attractiveness by Channel, 2025-2035
  • Figure 59: North America Market Attractiveness by Claim, 2025-2035
  • Figure 60: North America Market Attractiveness by Country, 2025-2035
  • Figure 61: Latin America Market Value (USD Million) by Function, 2025-2035
  • Figure 62: Latin America Market Value (USD Million) by Product Type, 2025-2035
  • Figure 63: Latin America Market Value (USD Million) by Channel, 2025-2035
  • Figure 64: Latin America Market Value (USD Million) by Claim, 2025-2035
  • Figure 65: Latin America Market Value (USD Million) by Country, 2025-2035
  • Figure 66: Latin America Market Value (USD Million) Analysis by Country, 2020-2035
  • Figure 67: Latin America Market Volume (Units) Analysis by Country, 2020-2035
  • Figure 68: Latin America Market Value Share (%) and BPS Analysis by Country, 2025-2035
  • Figure 69: Latin America Market Y-o-Y Growth (%) Projections by Country, 2025-2035
  • Figure 70: Latin America Market Value (USD Million) Analysis by Function, 2020-2035
  • Figure 71: Latin America Market Volume (Units) Analysis by Function, 2020-2035
  • Figure 72: Latin America Market Value Share (%) and BPS Analysis by Function, 2025-2035
  • Figure 73: Latin America Market Y-o-Y Growth (%) Projections by Function, 2025-2035
  • Figure 74: Latin America Market Value (USD Million) Analysis by Product Type, 2020-2035
  • Figure 75: Latin America Market Volume (Units) Analysis by Product Type, 2020-2035
  • Figure 76: Latin America Market Value Share (%) and BPS Analysis by Product Type, 2025-2035
  • Figure 77: Latin America Market Y-o-Y Growth (%) Projections by Product Type, 2025-2035
  • Figure 78: Latin America Market Value (USD Million) Analysis by Channel, 2020-2035
  • Figure 79: Latin America Market Volume (Units) Analysis by Channel, 2020-2035
  • Figure 80: Latin America Market Value Share (%) and BPS Analysis by Channel, 2025-2035
  • Figure 81: Latin America Market Y-o-Y Growth (%) Projections by Channel, 2025-2035
  • Figure 82: Latin America Market Value (USD Million) Analysis by Claim, 2020-2035
  • Figure 83: Latin America Market Volume (Units) Analysis by Claim, 2020-2035
  • Figure 84: Latin America Market Value Share (%) and BPS Analysis by Claim, 2025-2035
  • Figure 85: Latin America Market Y-o-Y Growth (%) Projections by Claim, 2025-2035
  • Figure 86: Latin America Market Attractiveness by Function, 2025-2035
  • Figure 87: Latin America Market Attractiveness by Product Type, 2025-2035
  • Figure 88: Latin America Market Attractiveness by Channel, 2025-2035
  • Figure 89: Latin America Market Attractiveness by Claim, 2025-2035
  • Figure 90: Latin America Market Attractiveness by Country, 2025-2035
  • Figure 91: Europe Market Value (USD Million) by Function, 2025-2035
  • Figure 92: Europe Market Value (USD Million) by Product Type, 2025-2035
  • Figure 93: Europe Market Value (USD Million) by Channel, 2025-2035
  • Figure 94: Europe Market Value (USD Million) by Claim, 2025-2035
  • Figure 95: Europe Market Value (USD Million) by Country, 2025-2035
  • Figure 96: Europe Market Value (USD Million) Analysis by Country, 2020-2035
  • Figure 97: Europe Market Volume (Units) Analysis by Country, 2020-2035
  • Figure 98: Europe Market Value Share (%) and BPS Analysis by Country, 2025-2035
  • Figure 99: Europe Market Y-o-Y Growth (%) Projections by Country, 2025-2035
  • Figure 100: Europe Market Value (USD Million) Analysis by Function, 2020-2035
  • Figure 101: Europe Market Volume (Units) Analysis by Function, 2020-2035
  • Figure 102: Europe Market Value Share (%) and BPS Analysis by Function, 2025-2035
  • Figure 103: Europe Market Y-o-Y Growth (%) Projections by Function, 2025-2035
  • Figure 104: Europe Market Value (USD Million) Analysis by Product Type, 2020-2035
  • Figure 105: Europe Market Volume (Units) Analysis by Product Type, 2020-2035
  • Figure 106: Europe Market Value Share (%) and BPS Analysis by Product Type, 2025-2035
  • Figure 107: Europe Market Y-o-Y Growth (%) Projections by Product Type, 2025-2035
  • Figure 108: Europe Market Value (USD Million) Analysis by Channel, 2020-2035
  • Figure 109: Europe Market Volume (Units) Analysis by Channel, 2020-2035
  • Figure 110: Europe Market Value Share (%) and BPS Analysis by Channel, 2025-2035
  • Figure 111: Europe Market Y-o-Y Growth (%) Projections by Channel, 2025-2035
  • Figure 112: Europe Market Value (USD Million) Analysis by Claim, 2020-2035
  • Figure 113: Europe Market Volume (Units) Analysis by Claim, 2020-2035
  • Figure 114: Europe Market Value Share (%) and BPS Analysis by Claim, 2025-2035
  • Figure 115: Europe Market Y-o-Y Growth (%) Projections by Claim, 2025-2035
  • Figure 116: Europe Market Attractiveness by Function, 2025-2035
  • Figure 117: Europe Market Attractiveness by Product Type, 2025-2035
  • Figure 118: Europe Market Attractiveness by Channel, 2025-2035
  • Figure 119: Europe Market Attractiveness by Claim, 2025-2035
  • Figure 120: Europe Market Attractiveness by Country, 2025-2035
  • Figure 121: East Asia Market Value (USD Million) by Function, 2025-2035
  • Figure 122: East Asia Market Value (USD Million) by Product Type, 2025-2035
  • Figure 123: East Asia Market Value (USD Million) by Channel, 2025-2035
  • Figure 124: East Asia Market Value (USD Million) by Claim, 2025-2035
  • Figure 125: East Asia Market Value (USD Million) by Country, 2025-2035
  • Figure 126: East Asia Market Value (USD Million) Analysis by Country, 2020-2035
  • Figure 127: East Asia Market Volume (Units) Analysis by Country, 2020-2035
  • Figure 128: East Asia Market Value Share (%) and BPS Analysis by Country, 2025-2035
  • Figure 129: East Asia Market Y-o-Y Growth (%) Projections by Country, 2025-2035
  • Figure 130: East Asia Market Value (USD Million) Analysis by Function, 2020-2035
  • Figure 131: East Asia Market Volume (Units) Analysis by Function, 2020-2035
  • Figure 132: East Asia Market Value Share (%) and BPS Analysis by Function, 2025-2035
  • Figure 133: East Asia Market Y-o-Y Growth (%) Projections by Function, 2025-2035
  • Figure 134: East Asia Market Value (USD Million) Analysis by Product Type, 2020-2035
  • Figure 135: East Asia Market Volume (Units) Analysis by Product Type, 2020-2035
  • Figure 136: East Asia Market Value Share (%) and BPS Analysis by Product Type, 2025-2035
  • Figure 137: East Asia Market Y-o-Y Growth (%) Projections by Product Type, 2025-2035
  • Figure 138: East Asia Market Value (USD Million) Analysis by Channel, 2020-2035
  • Figure 139: East Asia Market Volume (Units) Analysis by Channel, 2020-2035
  • Figure 140: East Asia Market Value Share (%) and BPS Analysis by Channel, 2025-2035
  • Figure 141: East Asia Market Y-o-Y Growth (%) Projections by Channel, 2025-2035
  • Figure 142: East Asia Market Value (USD Million) Analysis by Claim, 2020-2035
  • Figure 143: East Asia Market Volume (Units) Analysis by Claim, 2020-2035
  • Figure 144: East Asia Market Value Share (%) and BPS Analysis by Claim, 2025-2035
  • Figure 145: East Asia Market Y-o-Y Growth (%) Projections by Claim, 2025-2035
  • Figure 146: East Asia Market Attractiveness by Function, 2025-2035
  • Figure 147: East Asia Market Attractiveness by Product Type, 2025-2035
  • Figure 148: East Asia Market Attractiveness by Channel, 2025-2035
  • Figure 149: East Asia Market Attractiveness by Claim, 2025-2035
  • Figure 150: East Asia Market Attractiveness by Country, 2025-2035
  • Figure 151: South Asia & Pacific Market Value (USD Million) by Function, 2025-2035
  • Figure 152: South Asia & Pacific Market Value (USD Million) by Product Type, 2025-2035
  • Figure 153: South Asia & Pacific Market Value (USD Million) by Channel, 2025-2035
  • Figure 154: South Asia & Pacific Market Value (USD Million) by Claim, 2025-2035
  • Figure 155: South Asia & Pacific Market Value (USD Million) by Country, 2025-2035
  • Figure 156: South Asia & Pacific Market Value (USD Million) Analysis by Country, 2020-2035
  • Figure 157: South Asia & Pacific Market Volume (Units) Analysis by Country, 2020-2035
  • Figure 158: South Asia & Pacific Market Value Share (%) and BPS Analysis by Country, 2025-2035
  • Figure 159: South Asia & Pacific Market Y-o-Y Growth (%) Projections by Country, 2025-2035
  • Figure 160: South Asia & Pacific Market Value (USD Million) Analysis by Function, 2020-2035
  • Figure 161: South Asia & Pacific Market Volume (Units) Analysis by Function, 2020-2035
  • Figure 162: South Asia & Pacific Market Value Share (%) and BPS Analysis by Function, 2025-2035
  • Figure 163: South Asia & Pacific Market Y-o-Y Growth (%) Projections by Function, 2025-2035
  • Figure 164: South Asia & Pacific Market Value (USD Million) Analysis by Product Type, 2020-2035
  • Figure 165: South Asia & Pacific Market Volume (Units) Analysis by Product Type, 2020-2035
  • Figure 166: South Asia & Pacific Market Value Share (%) and BPS Analysis by Product Type, 2025-2035
  • Figure 167: South Asia & Pacific Market Y-o-Y Growth (%) Projections by Product Type, 2025-2035
  • Figure 168: South Asia & Pacific Market Value (USD Million) Analysis by Channel, 2020-2035
  • Figure 169: South Asia & Pacific Market Volume (Units) Analysis by Channel, 2020-2035
  • Figure 170: South Asia & Pacific Market Value Share (%) and BPS Analysis by Channel, 2025-2035
  • Figure 171: South Asia & Pacific Market Y-o-Y Growth (%) Projections by Channel, 2025-2035
  • Figure 172: South Asia & Pacific Market Value (USD Million) Analysis by Claim, 2020-2035
  • Figure 173: South Asia & Pacific Market Volume (Units) Analysis by Claim, 2020-2035
  • Figure 174: South Asia & Pacific Market Value Share (%) and BPS Analysis by Claim, 2025-2035
  • Figure 175: South Asia & Pacific Market Y-o-Y Growth (%) Projections by Claim, 2025-2035
  • Figure 176: South Asia & Pacific Market Attractiveness by Function, 2025-2035
  • Figure 177: South Asia & Pacific Market Attractiveness by Product Type, 2025-2035
  • Figure 178: South Asia & Pacific Market Attractiveness by Channel, 2025-2035
  • Figure 179: South Asia & Pacific Market Attractiveness by Claim, 2025-2035
  • Figure 180: South Asia & Pacific Market Attractiveness by Country, 2025-2035
  • Figure 181: Middle East and Africa Market Value (USD Million) by Function, 2025-2035
  • Figure 182: Middle East and Africa Market Value (USD Million) by Product Type, 2025-2035
  • Figure 183: Middle East and Africa Market Value (USD Million) by Channel, 2025-2035
  • Figure 184: Middle East and Africa Market Value (USD Million) by Claim, 2025-2035
  • Figure 185: Middle East and Africa Market Value (USD Million) by Country, 2025-2035
  • Figure 186: Middle East and Africa Market Value (USD Million) Analysis by Country, 2020-2035
  • Figure 187: Middle East and Africa Market Volume (Units) Analysis by Country, 2020-2035
  • Figure 188: Middle East and Africa Market Value Share (%) and BPS Analysis by Country, 2025-2035
  • Figure 189: Middle East and Africa Market Y-o-Y Growth (%) Projections by Country, 2025-2035
  • Figure 190: Middle East and Africa Market Value (USD Million) Analysis by Function, 2020-2035
  • Figure 191: Middle East and Africa Market Volume (Units) Analysis by Function, 2020-2035
  • Figure 192: Middle East and Africa Market Value Share (%) and BPS Analysis by Function, 2025-2035
  • Figure 193: Middle East and Africa Market Y-o-Y Growth (%) Projections by Function, 2025-2035
  • Figure 194: Middle East and Africa Market Value (USD Million) Analysis by Product Type, 2020-2035
  • Figure 195: Middle East and Africa Market Volume (Units) Analysis by Product Type, 2020-2035
  • Figure 196: Middle East and Africa Market Value Share (%) and BPS Analysis by Product Type, 2025-2035
  • Figure 197: Middle East and Africa Market Y-o-Y Growth (%) Projections by Product Type, 2025-2035
  • Figure 198: Middle East and Africa Market Value (USD Million) Analysis by Channel, 2020-2035
  • Figure 199: Middle East and Africa Market Volume (Units) Analysis by Channel, 2020-2035
  • Figure 200: Middle East and Africa Market Value Share (%) and BPS Analysis by Channel, 2025-2035
  • Figure 201: Middle East and Africa Market Y-o-Y Growth (%) Projections by Channel, 2025-2035
  • Figure 202: Middle East and Africa Market Value (USD Million) Analysis by Claim, 2020-2035
  • Figure 203: Middle East and Africa Market Volume (Units) Analysis by Claim, 2020-2035
  • Figure 204: Middle East and Africa Market Value Share (%) and BPS Analysis by Claim, 2025-2035
  • Figure 205: Middle East and Africa Market Y-o-Y Growth (%) Projections by Claim, 2025-2035
  • Figure 206: Middle East and Africa Market Attractiveness by Function, 2025-2035
  • Figure 207: Middle East and Africa Market Attractiveness by Product Type, 2025-2035
  • Figure 208: Middle East and Africa Market Attractiveness by Channel, 2025-2035
  • Figure 209: Middle East and Africa Market Attractiveness by Claim, 2025-2035
  • Figure 210: Middle East and Africa Market Attractiveness by Country, 2025-2035

Frequently Asked Questions

How big is the Global Kale Extract Skincare Market in 2025?

The Global Kale Extract Skincare Market is estimated to be valued at USD 1,236.1 million in 2025.

What will be the size of the Global Kale Extract Skincare Market in 2035?

The market size for the Global Kale Extract Skincare Market is projected to reach USD 3,952.3 million by 2035.

How much will be the Global Kale Extract Skincare Market growth between 2025 and 2035?

The Global Kale Extract Skincare Market is expected to grow at a 12.3% CAGR between 2025 and 2035.

What are the key product types in the Global Kale Extract Skincare Market?

The key product types in the Global Kale Extract Skincare Market are serums, creams/lotions, masks, and cleansers.

Which function segment will contribute significant share in the Global Kale Extract Skincare Market in 2025?

In terms of function, the detoxifying/antioxidant segment is projected to command 52.5% share in the Global Kale Extract Skincare Market in 2025.

Explore Similar Insights

Future Market Insights

Kale Extract Skincare Market

Chat With

MaRIA

Hi There, I am MaRIA, Your Market Research Intelligence Assistant. How may I help you?