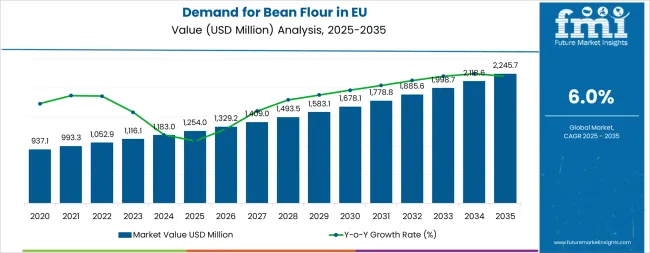
European Union bean flour sales are projected to grow from USD 1,254 million in 2025 to approximately USD 2,245.7 million by 2035, recording an absolute increase of USD 990 million over the forecast period. This translates into total growth of 78.9%, with demand forecast to expand at a compound annual growth rate (CAGR) of 6% between 2025 and 2035. The overall industry size is expected to grow by nearly 1.79X during the same period, supported by the rising adoption of plant-based protein alternatives, increasing consumer demand for gluten-free products, and developing applications across the bakery, snacks, and functional food industries throughout European operations.
| Metric | Value |
|---|---|
| Market Value (2025) | USD 1,254 million |
| Market Forecast Value (2035) | USD 2,245.7 million |
| Forecast CAGR (2025-2035) | 6% |
Between 2025 and 2030, EU bean flour demand is projected to expand from USD 1,254 million to USD 1,678 million, resulting in a value increase of USD 424 million, which represents 42.8% of the total forecast growth for the decade. This phase of development will be shaped by rising consumer demand for plant-based protein sources, increasing awareness of gluten-free alternatives, and growing adoption in bakery and snack applications. Manufacturers are expanding their product portfolios to address the evolving preferences for organic and sustainably sourced bean flour ingredients.
From 2030 to 2035, sales are forecast to grow from USD 1,678 million to USD 2,245.7 million, adding another USD 566 million, which constitutes 57.2% of the overall ten-year expansion. This period is expected to be characterized by the expansion of e-commerce channels, the integration of advanced milling technologies, and the development of specialized formulations for targeted food applications. The growing emphasis on sustainable agriculture and increasing disposable income across European countries will drive demand for premium bean flour products.
Between 2020 and 2025, EU bean flour sales experienced steady expansion at a CAGR of 3%, driven by increasing health consciousness among European consumers and growing recognition of legume-based nutrition benefits. The industry developed as food manufacturers and bakery companies recognized the commercial potential of bean flour as a nutritious, functional ingredient. Regulatory approvals and quality certifications began establishing standardized production processes and consumer confidence in bean-based products.
Industry expansion is being supported by the rapid increase in health-conscious consumers across European countries and the corresponding demand for plant-based protein sources with proven nutritional benefits. Modern consumers rely on natural alternatives to refined wheat flour and animal proteins, driving demand for bean flour rich in protein, fiber, and essential nutrients. Even minor dietary concerns or nutritional deficiencies can drive comprehensive adoption of bean-based products to maintain optimal wellness and support sustainable food choices.
The growing complexity of dietary restrictions and increasing awareness of environmental sustainability are driving demand for legume-based ingredients from certified organic producers with appropriate quality standards and expertise. Regulatory authorities are increasingly establishing clear guidelines for bean flour production and labeling to maintain consumer safety and ensure product quality. Food research studies and nutritional analyses are providing scientific evidence supporting bean flour's health benefits, requiring specialized milling methods and standardized protein concentration levels.
Sales are segmented by product type, application, nature, distribution channel, and country. By product type, demand is divided into black bean flour and white bean flour. Based on application, sales are categorized into bakery, snacks, functional foods, and other applications. In terms of nature, demand is segmented into organic and conventional bean flour. By distribution channel, sales are classified into retail (including grocery), e-commerce, and foodservice. Regionally, demand covers Germany, France, Italy, Spain, the Netherlands, and the Rest of Europe.
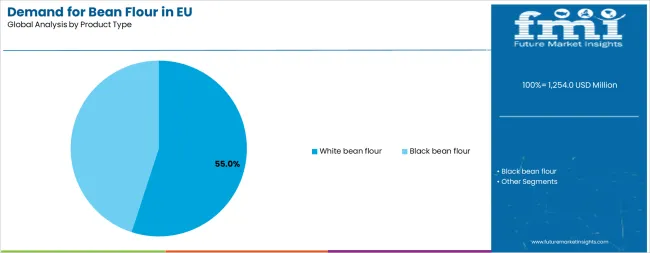
The white bean flour segment is projected to account for 55% of EU bean flour sales in 2025, establishing itself as the dominant product format across European operations. This commanding position is fundamentally supported by white bean flour's widespread adoption for bakery applications and functional food formulations, superior versatility in product development, and exceptional ease of incorporation into diverse food matrices, including bread, cakes, cookies, pasta products, and protein-enriched formulations. The white bean flour format delivers exceptional functionality, providing manufacturers with consistent performance and precise nutritional enhancement capabilities across multiple application categories.
This segment benefits from well-established milling processes, comprehensive economies of scale, and extensive availability from multiple certified European suppliers who maintain rigorous quality standards and organic certifications. Additionally, white bean flour offers superior color properties for light-colored baked goods, mild flavor profile, and enhanced consumer acceptance compared to darker bean varieties that may impart stronger flavors or coloration affecting product appearance.
The white bean flour segment is expected to maintain its 55.0% share through 2035, demonstrating stable positioning as the preferred choice for bakery manufacturers, food processors, and private label companies across European operations throughout the forecast period.
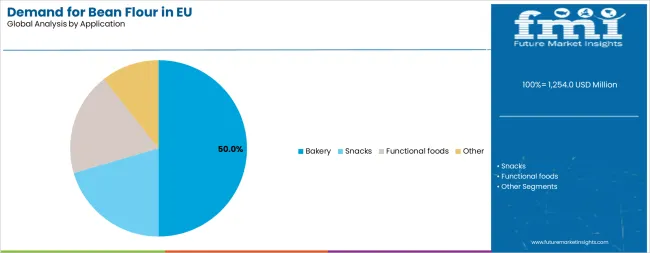
Bakery applications are positioned to represent 50% of total bean flour demand across European operations in 2025, reflecting the segment's dominance within the overall industry ecosystem. This substantial share directly demonstrates the high adoption rates of bean flour in bread, cakes, cookies, and pastries among health-conscious European consumers actively seeking nutritional enhancement solutions in baked goods. Modern bakery products increasingly feature bean flour formulations that deliver comprehensive nutritional profiles specifically designed to align with contemporary consumer wellness trends, gluten-free dietary requirements, and protein enrichment strategies.
The segment benefits from rapidly growing consumer awareness regarding plant-based protein benefits, increasing demand for gluten-free alternatives driving ingredient innovation, and expanding regulatory support for clean-label ingredients and evidence-based nutritional claims. European regulatory frameworks are becoming increasingly supportive of functional ingredient innovation, with streamlined approval processes for health claims and enhanced consumer protection measures that build confidence.
The bakery segment is expected to maintain its 50% share through 2035, demonstrating stable positioning as the primary application category throughout the forecast period.
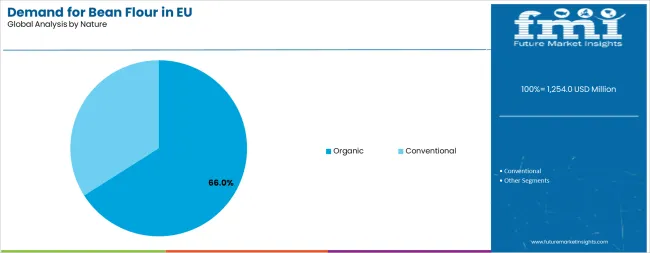
Organic bean flour is strategically positioned to contribute 66% of total European sales in 2025, representing products sourced through certified organic cultivation methodologies that comply with stringent EU organic production standards and regulations. These organic products successfully deliver premium nutrition solutions that maintain exceptionally high quality standards while ensuring complete supply chain transparency across diverse European consumer demographics. Organic production serves environmentally conscious consumer demographics, premium retail applications, and health-focused commercial operations that prioritize sustainability certifications and verified organic sourcing over conventional alternatives.
The organic segment derives significant competitive advantages from well-established European organic supply chains, sophisticated certification processes, and enhanced ability to meet substantial consumer requirements from major food manufacturers, bakery companies, and health food retailers. This segment benefits from premium pricing opportunities, strong consumer loyalty, and established relationships with major European organic distributors and specialty retail chains.
The organic segment is expected to maintain its 66% share through 2035, demonstrating stable positioning as environmental consciousness and organic certification preferences continue throughout the forecast period.
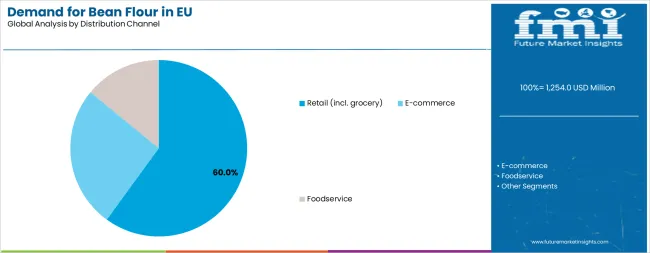
Retail channels (including grocery stores and supermarkets) are strategically estimated to control 60.0% of total European bean flour sales in 2025, a dominant position that reflects the critical importance of mainstream accessibility, product visibility, and convenient purchasing options in bean flour distribution strategies. European consumers consistently demonstrate strong preferences for traditional grocery stores, major supermarket chains, and established retail outlets that provide extensive product selection, competitive pricing, and reliable availability across urban, suburban, and rural locations.
Individual health-conscious consumers and family-oriented shoppers typically gravitate toward retail channels that offer comprehensive product ranges, recognizable brands, and convenient one-stop shopping experiences that enhance purchase efficiency and household grocery planning. These traditional channels provide essential reach and consumer accessibility while supporting diverse product ranges, competitive pricing strategies, and promotional initiatives that effectively communicate bean flour's nutritional benefits and versatile applications.
The retail segment is expected to decline slightly from 60% in 2025 to 55% by 2035, as e-commerce channels capture incremental share, reflecting changing consumer purchasing behaviors and digital platform expansion throughout the forecast period.
EU bean flour sales are advancing steadily due to increasing demand for plant-based proteins and growing recognition of gluten-free nutrition benefits. However, the industry faces challenges, including processing complexity, the need for consistent quality control across different bean varieties, and varying taste profiles that require recipe modifications. Sustainability initiatives and organic certification programs continue to influence production methods and industry development patterns.
The rapidly accelerating deployment of sophisticated e-commerce platforms and streamlined direct-to-consumer sales channels is fundamentally enabling broader reach, enhanced purchasing convenience, and significantly reduced distribution costs for bean flour products across European operations. Advanced online platforms equipped with comprehensive product information, detailed nutritional data, and interactive recipe tools provide extensive consumer education resources while dramatically expanding brand visibility across diverse European demographic segments. These digital channels prove particularly valuable for premium organic bean flour products and highly specialized formulations that require detailed technical descriptions, usage instructions, and targeted marketing approaches to communicate complex nutritional benefits effectively.
Online retail platforms also enable personalized marketing campaigns, subscription-based purchasing models, and direct customer feedback collection that enhances product development and customer satisfaction initiatives. Major bean flour manufacturers invest in proprietary e-commerce capabilities, third-party marketplace partnerships, and digital marketing strategies targeting health-conscious consumers seeking convenient access to specialty ingredients supporting wellness objectives and dietary requirements.
Modern bean flour producers systematically incorporate cutting-edge milling methodologies and highly standardized processing systems that significantly improve product fineness levels, enhance protein retention profiles, and extend shelf stability characteristics. Strategic integration of precision milling technologies, advanced heat treatment systems, and comprehensive quality testing protocols enables manufacturers to achieve more precise particle size distributions and maintain comprehensive product documentation throughout production cycles. These advanced processing capabilities also support the successful development of specialized formulations, including ultra-fine flour variants, standardized protein concentrates with enhanced functionality, and targeted bakery applications designed for specific product outcomes.
Technology investments enable manufacturers to meet increasingly sophisticated consumer expectations while maintaining competitive positioning in premium segments. Companies collaborate with equipment suppliers, food scientists, and processing technology providers to optimize production efficiency, reduce waste, and enhance nutritional value retention supporting superior product quality and manufacturer differentiation in competitive European operations.
European consumers increasingly prioritize sustainability credentials and complete supply chain transparency when selecting bean flour products, driving fundamental changes in sourcing and production strategies across the industry. Companies are implementing comprehensive traceability systems that document every step from cultivation through final milling, enabling consumers to verify organic certifications, environmental impact measurements, and ethical farming practices. This trend is particularly pronounced among premium segments where consumers demonstrate willingness to pay higher prices for products with verified sustainability credentials.
Manufacturers are responding by developing direct relationships with certified organic farmers, implementing carbon footprint reduction programs, and obtaining multiple sustainability certifications that differentiate their products in increasingly competitive European operations. The development of blockchain verification, sustainability reporting frameworks, and transparent communication strategies expands manufacturer value propositions addressing consumer demands for environmental responsibility and ethical sourcing supporting brand loyalty and premium positioning.
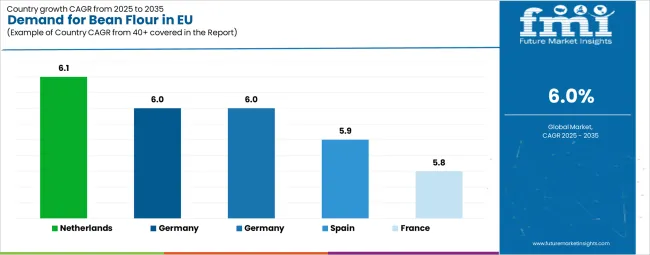
| Country | CAGR % |
|---|---|
| Netherlands | 6.2% |
| Germany | 6.1% |
| Italy | 6.0% |
| Spain | 5.9% |
| France | 5.8% |
EU bean flour sales demonstrate varied growth rates across major European economies, with Germany recording a 6.1% CAGR, France at 5.8%, Italy at 6.0%, Spain at 5.9%, and the Netherlands leading with 6.2% CAGR through 2035, driven by synchronized consumer trends toward plant-based nutrition and gluten-free alternatives. Germany maintains leadership through strong organic retail infrastructure and established health food culture. France benefits from premium positioning and integration of artisanal bakeries. Italy leverages traditional legume consumption patterns and Mediterranean diet alignment. Spain focuses on functional food innovation and export opportunities. The Netherlands emphasizes sustainability credentials and premium organic positioning, achieving the highest regional growth rate. Overall, sales show differentiated regional development reflecting varying levels of health consciousness and plant-based adoption across EU member states.
The report covers an in-depth analysis of top-performing countries are highlighted below.
Revenue from bean flour in Germany is projected to exhibit steady growth with a CAGR of 6.1% through 2035, driven by exceptionally strong consumer awareness of plant-based proteins and comprehensively well-established distribution networks for health foods throughout the country. Germany's sophisticated regulatory framework and internationally recognized quality standards are creating substantial demand for certified organic bean flour products across diverse consumer segments.
Major health food retailers, including dm-drogerie markt, Reformhaus, and specialized organic chains, systematically establish extensive product portfolios supporting the rapidly growing population of health-conscious consumers across urban centers, suburban areas, and rural communities. German demand benefits from high consumer education levels, substantial disposable income, and cultural emphasis on sustainable nutrition approaches that naturally support bean flour adoption.
Revenue from bean flour in France is expanding at a robust CAGR of 5.8%, substantially supported by increasing consumer preference for organic and natural food ingredients and rapidly growing awareness of plant-based protein benefits throughout French society. France's exceptionally well-established organic food operations and sophisticated premium positioning strategies are systematically driving demand for high-quality bean flour across diverse demographic segments.
Specialized health food stores, including Naturalia, Biocoop, and traditional boulangeries, gradually establish comprehensive product ranges serving the continuously growing population of wellness-focused consumers effectively. French sales particularly benefit from strong cultural emphasis on food quality, natural ingredients, and artisanal preparation methods that align perfectly with bean flour's positioning as a premium functional ingredient. Consumer education initiatives and endorsements from professional bakers are significantly enhancing penetration rates.
Revenue from bean flour in Italy is growing at a consistent CAGR of 6.0%, fundamentally driven by increasing integration of bean flour into traditional Mediterranean diet patterns and growing recognition of legume nutrition benefits following contemporary functional food trends. Italy's deeply established food culture is gradually incorporating bean flour to enhance traditional recipes, improve nutritional profiles, and modernize classic Italian culinary approaches.
Health food retailers, specialized nutrition stores, and traditional bakeries strategically invest in comprehensive education programs and interactive product demonstrations to address growing consumer interest in plant-based protein solutions effectively. Italian sales particularly benefit from strong cultural appreciation for legume-based ingredients, traditional pasta-making heritage, and family-oriented meal preparation approaches that naturally support bean flour adoption. Tourism industry growth and international culinary influence are also contributing to expansion through restaurant applications and gourmet food product development.
Demand for bean flour in Spain is projected to grow at a CAGR of 5.9%, substantially supported by the country's strategic emphasis on functional food development and rapidly expanding health-conscious consumer base that actively promotes wellness-focused nutrition approaches. Spanish food manufacturers systematically implement comprehensive bean flour integration strategies that effectively meet evolving consumer demands for enhanced nutrition and natural ingredients across diverse product categories.
Spanish operations are increasingly characterized by innovation in bakery applications, sophisticated premium product positioning, and strict compliance with European organic standards and quality certifications. Major food companies, including regional bakery producers and snack manufacturers, are developing bean flour-enhanced products for both domestic consumption and export activities. Spain's growing agricultural sector is driving local bean cultivation initiatives that support domestic processing and reduce import dependency.
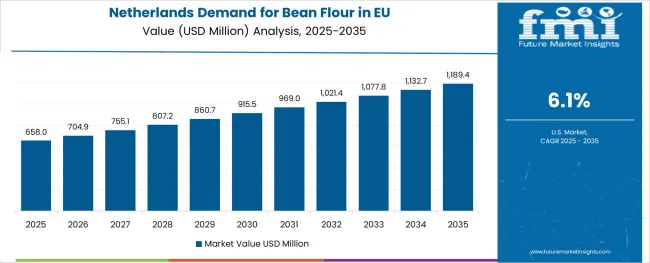
Demand for bean flour in the Netherlands is expanding at a CAGR of 6.2%, fundamentally driven by exceptionally strong consumer commitment to sustainable nutrition and premium organic food products that perfectly align with Dutch environmental consciousness and progressive sustainability values. Dutch consumers increasingly select bean flour products based on comprehensive sustainability credentials, verified organic certification, and complete supply chain transparency that documents environmental impact and ethical farming practices.
Netherlands sales significantly benefit from exceptionally well-developed organic retail channels, including Ekoplaza, Natuurwinkel, and Albert Heijn organic sections, combined with demonstrated consumer willingness to invest substantially in premium nutrition products with verified quality standards and environmental certifications. The Dutch regulatory environment actively supports organic agriculture, sustainable food production, and transparent labeling requirements that enhance consumer confidence. The country's strategic position as a major European distribution hub also facilitates efficient import and distribution of high-quality bean flour products from global suppliers.
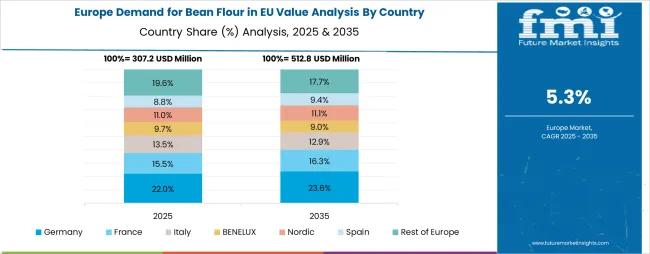
EU bean flour sales are projected to grow from USD 1,254.0 million in 2025 to USD 2,245.7 million by 2035, registering varying CAGRs across major European operations over the forecast period. Germany is expected to maintain leadership with a 25% share in 2025, growing at 6.1% CAGR, supported by its expansive health food retail network and strong consumer awareness of plant-based proteins. France follows with an 18% share and 5.8% CAGR, attributed to growing demand for organic and natural food ingredients.
Italy contributes 15% of sales with a 6% CAGR, driven by increasing adoption in bakery and pasta applications. Spain accounts for 10% of sales with 5.9% CAGR, while the Netherlands represents 7% with the highest growth rate of 6.2% CAGR. The Rest of Europe region holds 25% share, encompassing Nordic countries, Eastern Europe, and other EU member states with emerging demand for plant-based ingredients.
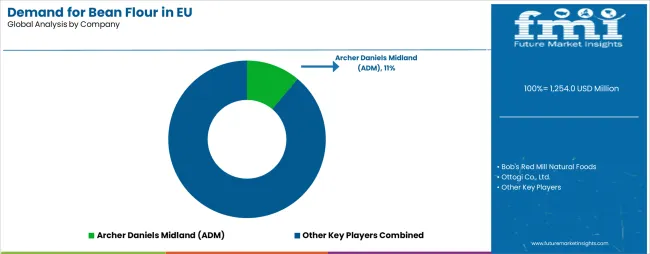
EU bean flour sales are defined by competition among specialized pulse processors, ingredient suppliers, and organic food manufacturers. Companies are investing in advanced milling technologies, organic certification processes, standardized processing methods, and supply chain optimization to deliver high-quality, consistent, and cost-effective bean flour solutions. Strategic partnerships, sustainability initiatives, and geographic expansion are central to strengthening product portfolios and presence.
Major participants include Archer Daniels Midland (ADM) with an estimated 12.0% share, focusing on large-scale processing capabilities and diversified ingredient applications across food and beverage sectors. Bob's Red Mill Natural Foods holds 8.0% share, emphasizing premium organic positioning and extensive retail distribution through specialty and mainstream channels. Ottogi Co., Ltd. accounts for 6% share, specializing in Asian bean varieties and export-focused production strategies for European operations. Damin Foodstuff (Zhangzhou) represents 5% share, leveraging cost-competitive production and high-volume manufacturing capabilities.
Regional producers and local suppliers collectively represent 69.0% share, establishing significant presence through organic certification, localized supply chains, and specialized product formulations. European milling facilities are developing advanced production capabilities that meet EU organic standards and provide complete traceability throughout the supply chain. Contract manufacturers and private label producers are expanding their bean flour capabilities to serve growing demand from bakery brands, snack manufacturers, and functional food companies.
| Item | Value |
|---|---|
| Quantitative Units | USD 2,245.7 million |
| Product Type | Black Bean Flour, White Bean Flour |
| Application | Bakery, Snacks, Functional Foods, Other |
| Nature | Organic, Conventional |
| Distribution Channel | Retail (incl. grocery), E-commerce, Foodservice |
| Forecast Period | 2025-2035 |
| Base Year | 2025 |
| Historical Data | 2020-2024 |
| Countries Covered | Germany, France, Italy, Spain, the Netherlands, the Rest of Europe |
| Key Companies Profiled | Archer Daniels Midland (ADM), Bob's Red Mill Natural Foods, Ottogi Co., Ltd., Damin Foodstuff (Zhangzhou), Regional suppliers |
| Report Pages | 180+ Pages |
| Data Tables | 50+ Tables and Figures |
| Additional Attributes | Dollar sales by product type, application, nature, and distribution channel; regional demand trends across major European operations; competitive landscape analysis with established players and emerging organic producers; consumer preferences for organic versus conventional bean flour products; integration with sustainable agriculture practices and environmental certification programs; innovations in milling technologies and protein retention methods; adoption in bakery and snack applications with enhanced nutritional profiles; regulatory framework analysis and compliance requirements; supply chain optimization strategies; and penetration analysis for health-conscious European consumers. |
The global demand for bean flour in EU is estimated to be valued at USD 1,254.0 million in 2025.
The market size for the demand for bean flour in EU is projected to reach USD 2,245.7 million by 2035.
The demand for bean flour in EU is expected to grow at a 6.0% CAGR between 2025 and 2035.
The key product types in demand for bean flour in EU are white bean flour and black bean flour.
In terms of application, bakery segment to command 50.0% share in the demand for bean flour in EU in 2025.


Our Research Products

The "Full Research Suite" delivers actionable market intel, deep dives on markets or technologies, so clients act faster, cut risk, and unlock growth.

The Leaderboard benchmarks and ranks top vendors, classifying them as Established Leaders, Leading Challengers, or Disruptors & Challengers.

Locates where complements amplify value and substitutes erode it, forecasting net impact by horizon

We deliver granular, decision-grade intel: market sizing, 5-year forecasts, pricing, adoption, usage, revenue, and operational KPIs—plus competitor tracking, regulation, and value chains—across 60 countries broadly.

Spot the shifts before they hit your P&L. We track inflection points, adoption curves, pricing moves, and ecosystem plays to show where demand is heading, why it is changing, and what to do next across high-growth markets and disruptive tech

Real-time reads of user behavior. We track shifting priorities, perceptions of today’s and next-gen services, and provider experience, then pace how fast tech moves from trial to adoption, blending buyer, consumer, and channel inputs with social signals (#WhySwitch, #UX).

Partner with our analyst team to build a custom report designed around your business priorities. From analysing market trends to assessing competitors or crafting bespoke datasets, we tailor insights to your needs.
Supplier Intelligence
Discovery & Profiling
Capacity & Footprint
Performance & Risk
Compliance & Governance
Commercial Readiness
Who Supplies Whom
Scorecards & Shortlists
Playbooks & Docs
Category Intelligence
Definition & Scope
Demand & Use Cases
Cost Drivers
Market Structure
Supply Chain Map
Trade & Policy
Operating Norms
Deliverables
Buyer Intelligence
Account Basics
Spend & Scope
Procurement Model
Vendor Requirements
Terms & Policies
Entry Strategy
Pain Points & Triggers
Outputs
Pricing Analysis
Benchmarks
Trends
Should-Cost
Indexation
Landed Cost
Commercial Terms
Deliverables
Brand Analysis
Positioning & Value Prop
Share & Presence
Customer Evidence
Go-to-Market
Digital & Reputation
Compliance & Trust
KPIs & Gaps
Outputs
Full Research Suite comprises of:
Market outlook & trends analysis
Interviews & case studies
Strategic recommendations
Vendor profiles & capabilities analysis
5-year forecasts
8 regions and 60+ country-level data splits
Market segment data splits
12 months of continuous data updates
DELIVERED AS:
PDF EXCEL ONLINE
Bean Flour Market Size and Share Forecast Outlook 2025 to 2035
Market Share Breakdown of Bean Flour Manufacturers
Western Europe Banana Flour Market Analysis by Source, Application, Distribution Channel, and Country Through 2025 to 2035
Western Europe Vanilla Bean Market Analysis by Distribution Channel, Form, Nature, Product Variety, and Country Through 2035
Western Europe Whole Wheat Flour Market Analysis – Trends, Demand & Forecast 2025–2035
Demand for Banana Flour in EU Size and Share Forecast Outlook 2025 to 2035
Demand for Vanilla Bean in EU Size and Share Forecast Outlook 2025 to 2035
Demand for Chickpea Flour in EU Size and Share Forecast Outlook 2025 to 2035
Demand for Whole-Wheat Flour in EU Size and Share Forecast Outlook 2025 to 2035
Europe Radiotherapy Patient Positioning Market Size and Share Forecast Outlook 2025 to 2035
Europe Polyvinyl Alcohol Industry Analysis Size and Share Forecast Outlook 2025 to 2035
Europe Cruise Market Forecast and Outlook 2025 to 2035
Europium Market Forecast and Outlook 2025 to 2035
Eucommia Leaf Extract Market Size and Share Forecast Outlook 2025 to 2035
Europe Massage Therapy Service Market Size and Share Forecast Outlook 2025 to 2035
Europe Cement Market Analysis Size and Share Forecast Outlook 2025 to 2035
European Union Tourism Industry Size and Share Forecast Outlook 2025 to 2035
Europe Injection Molding Machines Market Size and Share Forecast Outlook 2025 to 2035
Europe Injection Moulders Market Size and Share Forecast Outlook 2025 to 2035
Europe and MENA Generic Oncology Drug Market Size and Share Forecast Outlook 2025 to 2035

Thank you!
You will receive an email from our Business Development Manager. Please be sure to check your SPAM/JUNK folder too.
Chat With
MaRIA