Fig Ingredient Market Size and Share Forecast Outlook 2025 to 2035

The Fig Ingredient Market is estimated to be valued at USD 714.1 million in 2025 and is projected to reach USD 1141.2 million by 2035, registering a compound annual growth rate (CAGR) of 4.8% over the forecast period.

Quick Stats for Fig Ingredient Market

  • Fig Ingredient Market Value (2025): USD 714.1 million
  • Fig Ingredient Market Forecast Value (2035): USD 1141.2 million
  • Fig Ingredient Market Forecast CAGR: 4.8%
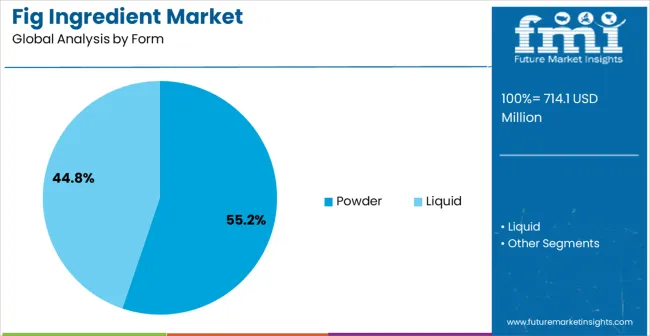
  • Leading Segment in Fig Ingredient Market in 2025: Powder (55.2%)
  • Key Growth Regions in Fig Ingredient Market: North America, Asia-Pacific, Europe
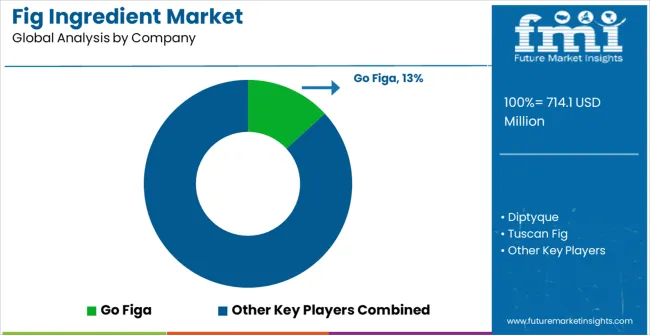
  • Top Key Players in Fig Ingredient Market: Go Figa, Diptyque, Tuscan Fig, Pixi Beauty, The Body Shop, Marc Jacobs, TABLE TOP GARDEN, Rutherford Meyer, Stonewall Kitchen, Newmans Own, Dairy Farmers, Rosebud Preserves Ltd, Gippsland Dairy

Fig Ingredient Market Key Takeaways

Metric Value
Fig Ingredient Market Estimated Value in (2025 E) USD 714.1 million
Fig Ingredient Market Forecast Value in (2035 F) USD 1141.2 million
Forecast CAGR (2025 to 2035) 4.8%

Why is the Fig Ingredient Market Growing?

The Fig Ingredient market is experiencing steady growth, driven by increasing demand for natural and functional ingredients in food, nutraceutical, and pharmaceutical applications. Rising consumer preference for health-promoting components, such as antioxidants, dietary fiber, and bioactive compounds found in figs, is supporting adoption across multiple sectors. The market is further fueled by the expanding use of fig ingredients in dietary supplements, fortified foods, and pharmaceutical formulations due to their therapeutic and nutritional benefits.

Continuous research and development efforts are enabling extraction of high-quality fig powders and concentrates, improving functional efficacy and shelf stability. Regulatory approvals and growing awareness regarding plant-based and natural ingredients are also contributing to market expansion. Additionally, the rising focus on preventive healthcare and nutritional supplementation is driving demand from both established and emerging markets.

Investments in production capacity, processing technologies, and distribution networks are strengthening availability and accessibility As consumer health consciousness increases, the Fig Ingredient market is expected to witness sustained growth, supported by innovations in processing and formulation techniques.

Segmental Analysis

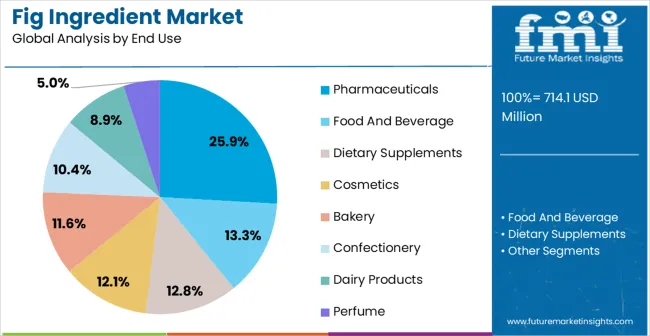
The fig ingredient market is segmented by form, end use, and geographic regions. By form, fig ingredient market is divided into Powder and Liquid. In terms of end use, fig ingredient market is classified into Pharmaceuticals, Food And Beverage, Dietary Supplements, Cosmetics, Bakery, Confectionery, Dairy Products, and Perfume. Regionally, the fig ingredient industry is classified into North America, Latin America, Western Europe, Eastern Europe, Balkan & Baltic Countries, Russia & Belarus, Central Asia, East Asia, South Asia & Pacific, and the Middle East & Africa.
Insights into the Powder Form Segment

Fig Ingredient Market Analysis By Form

The powder form segment is projected to hold 55.2% of the Fig Ingredient market revenue in 2025, establishing it as the leading form. Its dominance is being driven by the ease of incorporation into various food, nutraceutical, and pharmaceutical products. Powdered fig ingredients offer extended shelf life, convenient handling, and consistent functional properties, which improve formulation efficiency for manufacturers.

The ability to standardize bioactive compounds during processing enhances quality and therapeutic efficacy, making it highly suitable for health-focused products. Powder forms are also compatible with capsules, tablets, beverages, and bakery applications, expanding their versatility. The growing demand for functional foods and plant-based supplements reinforces the adoption of fig powders.

Processing advancements, including freeze-drying and micronization, have further improved solubility and bioavailability, enhancing their performance in end products As companies focus on scalable, versatile, and high-quality natural ingredients, the powder segment is expected to maintain its market leadership, driven by convenience, functionality, and broad applicability.
Insights into the Pharmaceuticals End Use Segment

Fig Ingredient Market Analysis By End Use

The pharmaceuticals end-use segment is anticipated to account for 25.9% of the Fig Ingredient market revenue in 2025, making it the leading application area. Growth in this segment is being driven by the increasing incorporation of fig-derived compounds in nutraceuticals, dietary supplements, and therapeutic formulations. Bioactive components such as polyphenols, flavonoids, and dietary fiber are utilized for their antioxidant, anti-inflammatory, and gastrointestinal health benefits, making fig ingredients highly valued in pharmaceutical applications.

The ability to standardize active compounds and ensure consistency in quality enhances the efficacy of formulations. Rising awareness among healthcare professionals and consumers about preventive healthcare and plant-based remedies is supporting adoption.

Regulatory approvals and scientific validation of health benefits further strengthen confidence in using fig ingredients in pharmaceutical products As the focus on natural, functional, and health-promoting ingredients increases globally, the pharmaceuticals segment is expected to remain a key driver of market growth, supported by innovation in extraction, processing, and formulation methods.

Market Overview

Fig Ingredient Market Outlook from 2025 to 2035

The fig ingredient industry is experiencing robust growth driven by several key factors. Firstly, the rising consumer preference for natural and healthy food products is a significant driver.

Figs are recognized for their high nutritional content, including fiber, vitamins, and antioxidants, making them a popular choice among health-conscious consumers. This trend is further amplified by the increasing awareness of the health benefits associated with figs, such as improved digestion and heart health.

Secondly, the expanding application of fig ingredients in various food and beverage products is propelling industry growth. Figs are being increasingly used in a wide range of products, including bakery items, dairy products, snacks, and beverages.

The natural sweetness and unique flavor profile of figs make them an ideal ingredient for enhancing the taste and nutritional value of food and beverages. Additionally, the versatility of fig ingredients allows for innovation in product formulations, catering to diverse consumer preferences.

The growing demand for clean-label and organic products is another crucial driver. Consumers are becoming more attentive to the ingredients in their food, favoring products that are free from artificial additives and preservatives. Figs, often marketed as a natural and organic ingredient, align well with this demand, thereby boosting their market appeal.

The rise of plant-based diets is contributing to the increased use of fig ingredients. As more consumers adopt vegetarian and vegan lifestyles, the demand for plant-based ingredients, including figs, is on the rise.

The veganism trend is encouraging manufacturers to incorporate figs into plant-based and vegan products, further driving industry expansion. Overall, the fig ingredient market is poised for significant growth, fueled by health trends, versatile applications, clean-label demand, and the rise of plant-based diets.
Analysis of Fig Ingredient Market By Key Countries

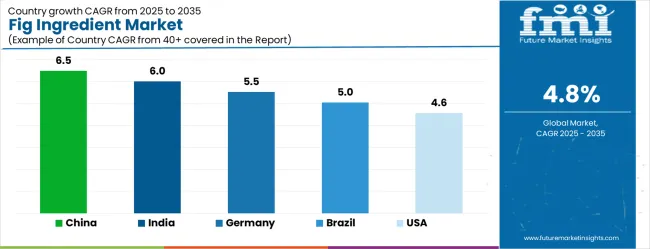
Fig Ingredient Market Cagr Analysis By Country

Country CAGR
China 6.5%
India 6.0%
Germany 5.5%
Brazil 5.0%
USA 4.6%
UK 4.1%
Japan 3.6%

Country-wise Analysis

The Fig Ingredient Market is expected to register a CAGR of 4.8% during the forecast period, exhibiting varied country level momentum. China leads with the highest CAGR of 6.5%, followed by India at 6.0%. Developed markets such as Germany, France, and the UK continue to expand steadily, while the USA is likely to grow at consistent rates. Japan posts the lowest CAGR at 3.6%, yet still underscores a broadly positive trajectory for the global Fig Ingredient Market. In 2024, Germany held a dominant revenue in the Western Europe market and is expected to grow with a CAGR of 5.5%. The USA Fig Ingredient Market is estimated to be valued at USD 247.4 million in 2025 and is anticipated to reach a valuation of USD 247.4 million by 2035. Sales are projected to rise at a CAGR of 0.0% over the forecast period between 2025 and 2035. While Japan and South Korea markets are estimated to be valued at USD 37.0 million and USD 21.6 million respectively in 2025.
Key Players in the Fig Ingredient Market

Fig Ingredient Market Analysis By Company

  • Go Figa
  • Diptyque
  • Tuscan Fig
  • Pixi Beauty
  • The Body Shop
  • Marc Jacobs
  • TABLE TOP GARDEN
  • Rutherford Meyer
  • Stonewall Kitchen
  • Newmans Own
  • Dairy Farmers
  • Rosebud Preserves Ltd
  • Gippsland Dairy

Scope of the Report

Item Value
Quantitative Units USD 714.1 Million
Form Powder and Liquid
End Use Pharmaceuticals, Food And Beverage, Dietary Supplements, Cosmetics, Bakery, Confectionery, Dairy Products, and Perfume
Regions Covered North America, Europe, Asia-Pacific, Latin America, Middle East & Africa
Country Covered United States, Canada, Germany, France, United Kingdom, China, Japan, India, Brazil, South Africa
Key Companies Profiled Go Figa, Diptyque, Tuscan Fig, Pixi Beauty, The Body Shop, Marc Jacobs, TABLE TOP GARDEN, Rutherford Meyer, Stonewall Kitchen, Newmans Own, Dairy Farmers, Rosebud Preserves Ltd, and Gippsland Dairy

Fig Ingredient Market by Segments

Form:

  • Powder
  • Liquid

End Use:

  • Pharmaceuticals
  • Food And Beverage
  • Dietary Supplements
  • Cosmetics
  • Bakery
  • Confectionery
  • Dairy Products
  • Perfume

Region:

  • North America
    • USA
    • Canada
    • Mexico
  • Latin America
    • Brazil
    • Chile
    • Rest of Latin America
  • Western Europe
    • Germany
    • UK
    • Italy
    • Spain
    • France
    • Nordic
    • BENELUX
    • Rest of Western Europe
  • Eastern Europe
    • Russia
    • Poland
    • Hungary
    • Balkan & Baltic
    • Rest of Eastern Europe
  • East Asia
    • China
    • Japan
    • South Korea
  • South Asia and Pacific
    • India
    • ASEAN
    • Australia & New Zealand
    • Rest of South Asia and Pacific
  • Middle East & Africa
    • Kingdom of Saudi Arabia
    • Other GCC Countries
    • Turkiye
    • South Africa
    • Other African Union
    • Rest of Middle East & Africa

Table of Content

  1. Executive Summary
    • Global Market Outlook
    • Demand-side Trends
    • Supply-side Trends
    • Technology Roadmap Analysis
    • Analysis and Recommendations
  2. Market Overview
    • Market Coverage / Taxonomy
    • Market Definition / Scope / Limitations
  3. Market Background
    • Market Dynamics
      • Drivers
      • Restraints
      • Opportunity
      • Trends
    • Scenario Forecast
      • Demand in Optimistic Scenario
      • Demand in Likely Scenario
      • Demand in Conservative Scenario
    • Opportunity Map Analysis
    • Product Life Cycle Analysis
    • Supply Chain Analysis
    • Investment Feasibility Matrix
    • Value Chain Analysis
    • PESTLE and Porter’s Analysis
    • Regulatory Landscape
    • Regional Parent Market Outlook
    • Production and Consumption Statistics
    • Import and Export Statistics
  4. Global Market Analysis 2020 to 2024 and Forecast, 2025 to 2035
    • Historical Market Size Value (USD Million) Analysis, 2020 to 2024
    • Current and Future Market Size Value (USD Million) Projections, 2025 to 2035
      • Y-o-Y Growth Trend Analysis
      • Absolute $ Opportunity Analysis
  5. Global Market Pricing Analysis 2020 to 2024 and Forecast 2025 to 2035
  6. Global Market Analysis 2020 to 2024 and Forecast 2025 to 2035, By Form
    • Introduction / Key Findings
    • Historical Market Size Value (USD Million) Analysis By Form , 2020 to 2024
    • Current and Future Market Size Value (USD Million) Analysis and Forecast By Form , 2025 to 2035
      • Powder
      • Liquid
    • Y-o-Y Growth Trend Analysis By Form , 2020 to 2024
    • Absolute $ Opportunity Analysis By Form , 2025 to 2035
  7. Global Market Analysis 2020 to 2024 and Forecast 2025 to 2035, By End Use
    • Introduction / Key Findings
    • Historical Market Size Value (USD Million) Analysis By End Use, 2020 to 2024
    • Current and Future Market Size Value (USD Million) Analysis and Forecast By End Use, 2025 to 2035
      • Pharmaceuticals
      • Food And Beverage
      • Dietary Supplements
      • Cosmetics
      • Bakery
      • Confectionery
      • Dairy Products
      • Perfume
    • Y-o-Y Growth Trend Analysis By End Use, 2020 to 2024
    • Absolute $ Opportunity Analysis By End Use, 2025 to 2035
  8. Global Market Analysis 2020 to 2024 and Forecast 2025 to 2035, By Region
    • Introduction
    • Historical Market Size Value (USD Million) Analysis By Region, 2020 to 2024
    • Current Market Size Value (USD Million) Analysis and Forecast By Region, 2025 to 2035
      • North America
      • Latin America
      • Western Europe
      • Eastern Europe
      • East Asia
      • South Asia and Pacific
      • Middle East & Africa
    • Market Attractiveness Analysis By Region
  9. North America Market Analysis 2020 to 2024 and Forecast 2025 to 2035, By Country
    • Historical Market Size Value (USD Million) Trend Analysis By Market Taxonomy, 2020 to 2024
    • Market Size Value (USD Million) Forecast By Market Taxonomy, 2025 to 2035
      • By Country
        • USA
        • Canada
        • Mexico
      • By Form
      • By End Use
    • Market Attractiveness Analysis
      • By Country
      • By Form
      • By End Use
    • Key Takeaways
  10. Latin America Market Analysis 2020 to 2024 and Forecast 2025 to 2035, By Country
    • Historical Market Size Value (USD Million) Trend Analysis By Market Taxonomy, 2020 to 2024
    • Market Size Value (USD Million) Forecast By Market Taxonomy, 2025 to 2035
      • By Country
        • Brazil
        • Chile
        • Rest of Latin America
      • By Form
      • By End Use
    • Market Attractiveness Analysis
      • By Country
      • By Form
      • By End Use
    • Key Takeaways
  11. Western Europe Market Analysis 2020 to 2024 and Forecast 2025 to 2035, By Country
    • Historical Market Size Value (USD Million) Trend Analysis By Market Taxonomy, 2020 to 2024
    • Market Size Value (USD Million) Forecast By Market Taxonomy, 2025 to 2035
      • By Country
        • Germany
        • UK
        • Italy
        • Spain
        • France
        • Nordic
        • BENELUX
        • Rest of Western Europe
      • By Form
      • By End Use
    • Market Attractiveness Analysis
      • By Country
      • By Form
      • By End Use
    • Key Takeaways
  12. Eastern Europe Market Analysis 2020 to 2024 and Forecast 2025 to 2035, By Country
    • Historical Market Size Value (USD Million) Trend Analysis By Market Taxonomy, 2020 to 2024
    • Market Size Value (USD Million) Forecast By Market Taxonomy, 2025 to 2035
      • By Country
        • Russia
        • Poland
        • Hungary
        • Balkan & Baltic
        • Rest of Eastern Europe
      • By Form
      • By End Use
    • Market Attractiveness Analysis
      • By Country
      • By Form
      • By End Use
    • Key Takeaways
  13. East Asia Market Analysis 2020 to 2024 and Forecast 2025 to 2035, By Country
    • Historical Market Size Value (USD Million) Trend Analysis By Market Taxonomy, 2020 to 2024
    • Market Size Value (USD Million) Forecast By Market Taxonomy, 2025 to 2035
      • By Country
        • China
        • Japan
        • South Korea
      • By Form
      • By End Use
    • Market Attractiveness Analysis
      • By Country
      • By Form
      • By End Use
    • Key Takeaways
  14. South Asia and Pacific Market Analysis 2020 to 2024 and Forecast 2025 to 2035, By Country
    • Historical Market Size Value (USD Million) Trend Analysis By Market Taxonomy, 2020 to 2024
    • Market Size Value (USD Million) Forecast By Market Taxonomy, 2025 to 2035
      • By Country
        • India
        • ASEAN
        • Australia & New Zealand
        • Rest of South Asia and Pacific
      • By Form
      • By End Use
    • Market Attractiveness Analysis
      • By Country
      • By Form
      • By End Use
    • Key Takeaways
  15. Middle East & Africa Market Analysis 2020 to 2024 and Forecast 2025 to 2035, By Country
    • Historical Market Size Value (USD Million) Trend Analysis By Market Taxonomy, 2020 to 2024
    • Market Size Value (USD Million) Forecast By Market Taxonomy, 2025 to 2035
      • By Country
        • Kingdom of Saudi Arabia
        • Other GCC Countries
        • Turkiye
        • South Africa
        • Other African Union
        • Rest of Middle East & Africa
      • By Form
      • By End Use
    • Market Attractiveness Analysis
      • By Country
      • By Form
      • By End Use
    • Key Takeaways
  16. Key Countries Market Analysis
    • USA
      • Pricing Analysis
      • Market Share Analysis, 2024
        • By Form
        • By End Use
    • Canada
      • Pricing Analysis
      • Market Share Analysis, 2024
        • By Form
        • By End Use
    • Mexico
      • Pricing Analysis
      • Market Share Analysis, 2024
        • By Form
        • By End Use
    • Brazil
      • Pricing Analysis
      • Market Share Analysis, 2024
        • By Form
        • By End Use
    • Chile
      • Pricing Analysis
      • Market Share Analysis, 2024
        • By Form
        • By End Use
    • Germany
      • Pricing Analysis
      • Market Share Analysis, 2024
        • By Form
        • By End Use
    • UK
      • Pricing Analysis
      • Market Share Analysis, 2024
        • By Form
        • By End Use
    • Italy
      • Pricing Analysis
      • Market Share Analysis, 2024
        • By Form
        • By End Use
    • Spain
      • Pricing Analysis
      • Market Share Analysis, 2024
        • By Form
        • By End Use
    • France
      • Pricing Analysis
      • Market Share Analysis, 2024
        • By Form
        • By End Use
    • India
      • Pricing Analysis
      • Market Share Analysis, 2024
        • By Form
        • By End Use
    • ASEAN
      • Pricing Analysis
      • Market Share Analysis, 2024
        • By Form
        • By End Use
    • Australia & New Zealand
      • Pricing Analysis
      • Market Share Analysis, 2024
        • By Form
        • By End Use
    • China
      • Pricing Analysis
      • Market Share Analysis, 2024
        • By Form
        • By End Use
    • Japan
      • Pricing Analysis
      • Market Share Analysis, 2024
        • By Form
        • By End Use
    • South Korea
      • Pricing Analysis
      • Market Share Analysis, 2024
        • By Form
        • By End Use
    • Russia
      • Pricing Analysis
      • Market Share Analysis, 2024
        • By Form
        • By End Use
    • Poland
      • Pricing Analysis
      • Market Share Analysis, 2024
        • By Form
        • By End Use
    • Hungary
      • Pricing Analysis
      • Market Share Analysis, 2024
        • By Form
        • By End Use
    • Kingdom of Saudi Arabia
      • Pricing Analysis
      • Market Share Analysis, 2024
        • By Form
        • By End Use
    • Turkiye
      • Pricing Analysis
      • Market Share Analysis, 2024
        • By Form
        • By End Use
    • South Africa
      • Pricing Analysis
      • Market Share Analysis, 2024
        • By Form
        • By End Use
  17. Market Structure Analysis
    • Competition Dashboard
    • Competition Benchmarking
    • Market Share Analysis of Top Players
      • By Regional
      • By Form
      • By End Use
  18. Competition Analysis
    • Competition Deep Dive
      • Go Figa
        • Overview
        • Product Portfolio
        • Profitability by Market Segments (Product/Age /Sales Channel/Region)
        • Sales Footprint
        • Strategy Overview
          • Marketing Strategy
          • Product Strategy
          • Channel Strategy
      • Diptyque
      • Tuscan Fig
      • Pixi Beauty
      • The Body Shop
      • Marc Jacobs
      • TABLE TOP GARDEN
      • Rutherford Meyer
      • Stonewall Kitchen
      • Newmans Own
      • Dairy Farmers
      • Rosebud Preserves Ltd
      • Gippsland Dairy
  19. Assumptions & Acronyms Used
  20. Research Methodology

List of Tables

  • Table 1: Global Market Value (USD Million) Forecast by Region, 2020-2035
  • Table 2: Global Market Value (USD Million) Forecast by Form , 2020-2035
  • Table 3: Global Market Value (USD Million) Forecast by End Use, 2020-2035
  • Table 4: North America Market Value (USD Million) Forecast by Country, 2020-2035
  • Table 5: North America Market Value (USD Million) Forecast by Form , 2020-2035
  • Table 6: North America Market Value (USD Million) Forecast by End Use, 2020-2035
  • Table 7: Latin America Market Value (USD Million) Forecast by Country, 2020-2035
  • Table 8: Latin America Market Value (USD Million) Forecast by Form , 2020-2035
  • Table 9: Latin America Market Value (USD Million) Forecast by End Use, 2020-2035
  • Table 10: Western Europe Market Value (USD Million) Forecast by Country, 2020-2035
  • Table 11: Western Europe Market Value (USD Million) Forecast by Form , 2020-2035
  • Table 12: Western Europe Market Value (USD Million) Forecast by End Use, 2020-2035
  • Table 13: Eastern Europe Market Value (USD Million) Forecast by Country, 2020-2035
  • Table 14: Eastern Europe Market Value (USD Million) Forecast by Form , 2020-2035
  • Table 15: Eastern Europe Market Value (USD Million) Forecast by End Use, 2020-2035
  • Table 16: East Asia Market Value (USD Million) Forecast by Country, 2020-2035
  • Table 17: East Asia Market Value (USD Million) Forecast by Form , 2020-2035
  • Table 18: East Asia Market Value (USD Million) Forecast by End Use, 2020-2035
  • Table 19: South Asia and Pacific Market Value (USD Million) Forecast by Country, 2020-2035
  • Table 20: South Asia and Pacific Market Value (USD Million) Forecast by Form , 2020-2035
  • Table 21: South Asia and Pacific Market Value (USD Million) Forecast by End Use, 2020-2035
  • Table 22: Middle East & Africa Market Value (USD Million) Forecast by Country, 2020-2035
  • Table 23: Middle East & Africa Market Value (USD Million) Forecast by Form , 2020-2035
  • Table 24: Middle East & Africa Market Value (USD Million) Forecast by End Use, 2020-2035

List of Figures

  • Figure 1: Global Market Pricing Analysis
  • Figure 2: Global Market Value (USD Million) Forecast 2020-2035
  • Figure 3: Global Market Value Share and BPS Analysis by Form , 2025 and 2035
  • Figure 4: Global Market Y-o-Y Growth Comparison by Form , 2025-2035
  • Figure 5: Global Market Attractiveness Analysis by Form
  • Figure 6: Global Market Value Share and BPS Analysis by End Use, 2025 and 2035
  • Figure 7: Global Market Y-o-Y Growth Comparison by End Use, 2025-2035
  • Figure 8: Global Market Attractiveness Analysis by End Use
  • Figure 9: Global Market Value (USD Million) Share and BPS Analysis by Region, 2025 and 2035
  • Figure 10: Global Market Y-o-Y Growth Comparison by Region, 2025-2035
  • Figure 11: Global Market Attractiveness Analysis by Region
  • Figure 12: North America Market Incremental Dollar Opportunity, 2025-2035
  • Figure 13: Latin America Market Incremental Dollar Opportunity, 2025-2035
  • Figure 14: Western Europe Market Incremental Dollar Opportunity, 2025-2035
  • Figure 15: Eastern Europe Market Incremental Dollar Opportunity, 2025-2035
  • Figure 16: East Asia Market Incremental Dollar Opportunity, 2025-2035
  • Figure 17: South Asia and Pacific Market Incremental Dollar Opportunity, 2025-2035
  • Figure 18: Middle East & Africa Market Incremental Dollar Opportunity, 2025-2035
  • Figure 19: North America Market Value Share and BPS Analysis by Country, 2025 and 2035
  • Figure 20: North America Market Value Share and BPS Analysis by Form , 2025 and 2035
  • Figure 21: North America Market Y-o-Y Growth Comparison by Form , 2025-2035
  • Figure 22: North America Market Attractiveness Analysis by Form
  • Figure 23: North America Market Value Share and BPS Analysis by End Use, 2025 and 2035
  • Figure 24: North America Market Y-o-Y Growth Comparison by End Use, 2025-2035
  • Figure 25: North America Market Attractiveness Analysis by End Use
  • Figure 26: Latin America Market Value Share and BPS Analysis by Country, 2025 and 2035
  • Figure 27: Latin America Market Value Share and BPS Analysis by Form , 2025 and 2035
  • Figure 28: Latin America Market Y-o-Y Growth Comparison by Form , 2025-2035
  • Figure 29: Latin America Market Attractiveness Analysis by Form
  • Figure 30: Latin America Market Value Share and BPS Analysis by End Use, 2025 and 2035
  • Figure 31: Latin America Market Y-o-Y Growth Comparison by End Use, 2025-2035
  • Figure 32: Latin America Market Attractiveness Analysis by End Use
  • Figure 33: Western Europe Market Value Share and BPS Analysis by Country, 2025 and 2035
  • Figure 34: Western Europe Market Value Share and BPS Analysis by Form , 2025 and 2035
  • Figure 35: Western Europe Market Y-o-Y Growth Comparison by Form , 2025-2035
  • Figure 36: Western Europe Market Attractiveness Analysis by Form
  • Figure 37: Western Europe Market Value Share and BPS Analysis by End Use, 2025 and 2035
  • Figure 38: Western Europe Market Y-o-Y Growth Comparison by End Use, 2025-2035
  • Figure 39: Western Europe Market Attractiveness Analysis by End Use
  • Figure 40: Eastern Europe Market Value Share and BPS Analysis by Country, 2025 and 2035
  • Figure 41: Eastern Europe Market Value Share and BPS Analysis by Form , 2025 and 2035
  • Figure 42: Eastern Europe Market Y-o-Y Growth Comparison by Form , 2025-2035
  • Figure 43: Eastern Europe Market Attractiveness Analysis by Form
  • Figure 44: Eastern Europe Market Value Share and BPS Analysis by End Use, 2025 and 2035
  • Figure 45: Eastern Europe Market Y-o-Y Growth Comparison by End Use, 2025-2035
  • Figure 46: Eastern Europe Market Attractiveness Analysis by End Use
  • Figure 47: East Asia Market Value Share and BPS Analysis by Country, 2025 and 2035
  • Figure 48: East Asia Market Value Share and BPS Analysis by Form , 2025 and 2035
  • Figure 49: East Asia Market Y-o-Y Growth Comparison by Form , 2025-2035
  • Figure 50: East Asia Market Attractiveness Analysis by Form
  • Figure 51: East Asia Market Value Share and BPS Analysis by End Use, 2025 and 2035
  • Figure 52: East Asia Market Y-o-Y Growth Comparison by End Use, 2025-2035
  • Figure 53: East Asia Market Attractiveness Analysis by End Use
  • Figure 54: South Asia and Pacific Market Value Share and BPS Analysis by Country, 2025 and 2035
  • Figure 55: South Asia and Pacific Market Value Share and BPS Analysis by Form , 2025 and 2035
  • Figure 56: South Asia and Pacific Market Y-o-Y Growth Comparison by Form , 2025-2035
  • Figure 57: South Asia and Pacific Market Attractiveness Analysis by Form
  • Figure 58: South Asia and Pacific Market Value Share and BPS Analysis by End Use, 2025 and 2035
  • Figure 59: South Asia and Pacific Market Y-o-Y Growth Comparison by End Use, 2025-2035
  • Figure 60: South Asia and Pacific Market Attractiveness Analysis by End Use
  • Figure 61: Middle East & Africa Market Value Share and BPS Analysis by Country, 2025 and 2035
  • Figure 62: Middle East & Africa Market Value Share and BPS Analysis by Form , 2025 and 2035
  • Figure 63: Middle East & Africa Market Y-o-Y Growth Comparison by Form , 2025-2035
  • Figure 64: Middle East & Africa Market Attractiveness Analysis by Form
  • Figure 65: Middle East & Africa Market Value Share and BPS Analysis by End Use, 2025 and 2035
  • Figure 66: Middle East & Africa Market Y-o-Y Growth Comparison by End Use, 2025-2035
  • Figure 67: Middle East & Africa Market Attractiveness Analysis by End Use
  • Figure 68: Global Market - Tier Structure Analysis
  • Figure 69: Global Market - Company Share Analysis

Frequently Asked Questions

How big is the fig ingredient market in 2025?

The global fig ingredient market is estimated to be valued at USD 714.1 million in 2025.

What will be the size of fig ingredient market in 2035?

The market size for the fig ingredient market is projected to reach USD 1,141.2 million by 2035.

How much will be the fig ingredient market growth between 2025 and 2035?

The fig ingredient market is expected to grow at a 4.8% CAGR between 2025 and 2035.

What are the key product types in the fig ingredient market?

The key product types in fig ingredient market are powder and liquid.

Which end use segment to contribute significant share in the fig ingredient market in 2025?

In terms of end use, pharmaceuticals segment to command 25.9% share in the fig ingredient market in 2025.

Explore Similar Insights

Future Market Insights

Fig Ingredient Market

Chat With MaRIA

Chat With

MaRIA

Hi There, I am MaRIA, Your Market Research Intelligence Assistant. How may I help you?