Fresh Figs Market Size and Share Forecast Outlook 2025 to 2035

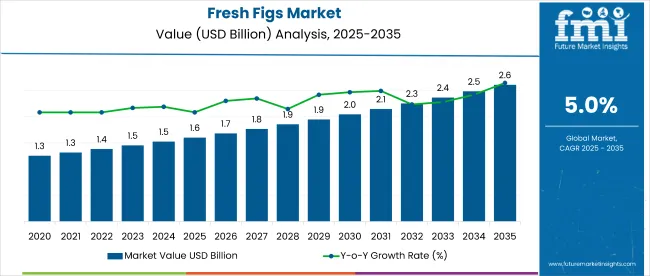
The global fresh figs market is projected to grow from USD 1.6 billion in 2025 to USD 2.6 billion by 2035, registering a CAGR of 5%. The market expansion is being driven by rising health consciousness, increasing demand for organic fruits, and the growing popularity of functional food.
Quick Stats for Fresh Figs Market

  • Value of Fresh Figs Market (2025): USD 1.6 billion
  • Projected Value of Fresh Figs Market (2035): USD 2.6 billion
  • Forecast CAGR of Fresh Figs Market (2025 to 2035): 5%
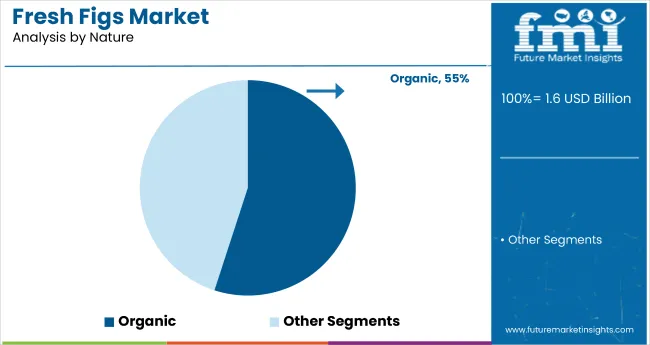
  • Leading Segment by Nature of Fresh Figs Market (2025): Organic Fresh Figs (55% Market Share)
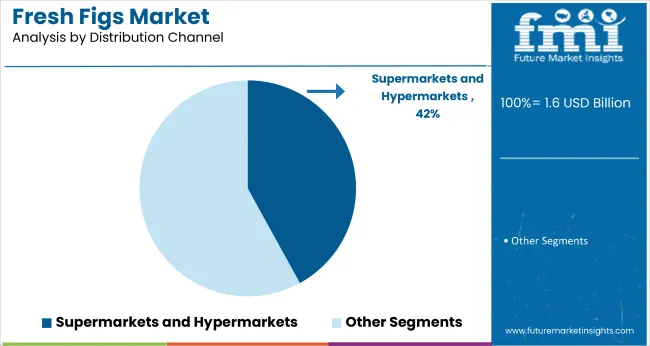
  • Leading Segment by Distribution Channel in Fresh Figs Market (2025): Supermarkets and Hypermarkets (42% Share)
  • Fastest Growing Country in Fresh Figs Market (2025): United States (4.8% CAGR)
  • Top Key Players in Fresh Figs Market: Hadley Fruit Orchards, Inc., Roland Foods LLC, Meurens Natural S.A., FruitLips, Jiaherb, Inc., Athos Agricola S.A.

Fresh Figs Market

Metric Value
Industry Size (2025E) USD 1.6 billion
Industry Value (2035F) USD 2.6 billion
CAGR (2025 to 2035) 5%

Consumers are seeking nutrient-dense fruits rich in fiber, antioxidants, potassium, and other essential minerals, with figs emerging as a preferred choice due to their versatility in fresh and processed applications. Their usage in health-oriented food products such as protein bars, shakes, desserts, and salads is fueling consistent demand across households and the food processing industry.

The fresh figs market holds approximately 1.8% share of the global fresh fruits market and about 4.5% within the organic fruits segment, driven by rising consumer preference for clean-label produce. In the functional food ingredients market, fresh figs contribute nearly 0.5%, primarily through use in protein bars, desserts, and health snacks.

They account for around 3% of the Mediterranean fruits market, reflecting their cultural and regional significance. Within the health and wellness food market, their share is estimated at 1.2%, while in the specialty crops market and natural sweeteners segment, their respective shares are approximately 1.5% and 0.8%.

Government policies impacting the market include food safety standards, organic certification regulations, and agricultural export incentives. Agencies such as the USDA (United States Department of Agriculture), FSSAI (Food Safety and Standards Authority of India), and EFSA (European Food Safety Authority) promote the production and distribution of organic and minimally processed fruits. Supportive frameworks like India’s National Horticulture Mission and global sustainable agriculture guidelines encourage the cultivation and export of fresh figs, enabling farmers and producers to adopt organic farming methods and strengthen global supply chains.

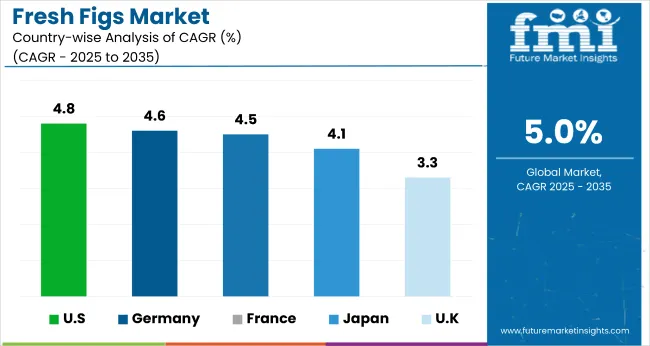
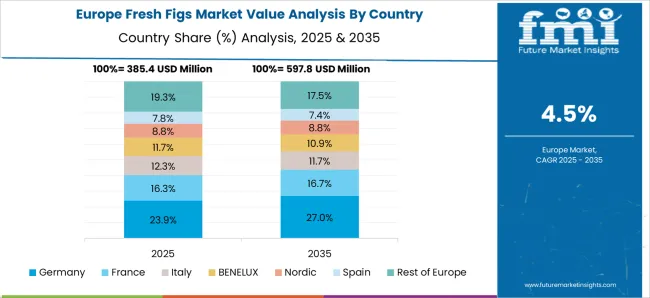
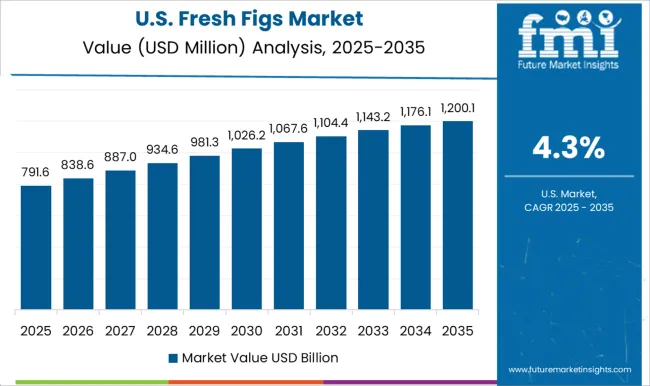
The USA is projected to be the fastest-growing market, expanding at a CAGR of 4.8% from 2025 to 2035. Organic fresh figs will lead the nature segment with a 55% share, while supermarkets and hypermarkets will dominate the distribution channel segment with a 42% share. The Germany and France markets are also expected to grow steadily at CAGRs of 4.6% and 4.5%, respectively, while Japan is projected to grow at 4.1% and the UK at 3.3%.

Fresh Figs Market Analysis by Top Investment Segments

The global market is segmented by nature, type, distribution channel, and region. By nature, the market is divided into organic and conventional. In terms of type, the market includes smyrna figs, black figs, sari lop figs, mission figs, kadota figs, and others (calimyrna figs, adriatic figs, brown turkey figs, desert king figs).

Based on distribution channel, the market is categorized into supermarkets and hypermarkets, specialty stores, and online retail. Regionally, the market is classified into North America, Latin America, Western Europe, South Asia, East Asia, Eastern Europe, and the Middle East & Africa.
Organic Fresh Figs to Lead the Nature Segment with 55% Market Share

Fresh Figs Market Analysis By Nature

Organic fresh figs are expected to lead the nature segment with a 55% market share in 2025. Rising consumer demand for clean-label, chemical-free fruits is driving this growth, supported by health trends, organic certifications, and premium positioning. Increased awareness of natural food benefits further boosts market preference for organic figs.
  • Growing health consciousness among consumers supports demand for organically farmed fruits.
  • Government support and certification standards promote organic fig farming, especially in Europe and the USA
  • Higher price realization and premium product positioning strengthen organic fig sales.

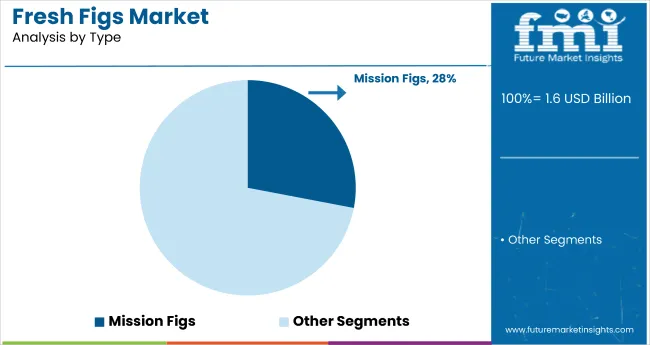
Mission Figs to Dominate the Type Segment with 28% Market Share in 2025

Fresh Figs Market Analysis By Type

Mission figs are projected to dominate the type segment with a 28% market share in 2025. Their popularity stems from rich flavor, soft texture, and high nutritional value. Widely used in fresh consumption and food applications, Mission figs are favored for their availability, health benefits, and familiarity among global consumers.
  • Their soft texture and rich flavor make them a preferred choice for direct consumption and culinary applications.
  • High antioxidant and fiber content support their adoption in functional foods.
  • Consumer familiarity and year-round availability enhance their global market presence.

Supermarkets and Hypermarkets to Lead the Distribution Channel Segment with 42% Market Share

Fresh Figs Market Analysis By Distribution Channel

Supermarkets and hypermarkets are projected to lead the distribution channel segment with a 42% market share in 2025. Their dominance is driven by wide product availability, convenient access, and increased consumer preference for one-stop grocery shopping, making them key outlets for both fresh and packaged fig products across urban markets.

  • These stores offer wide product visibility and access to both fresh and packaged fig products.
  • Urban consumers prefer one-stop retail chains for grocery shopping, including fresh produce.
  • Promotional strategies and in-store sampling drive impulse purchases of figs.

Top Fresh Figs Market Dynamics

The global fresh figs market is experiencing consistent growth, fueled by rising health awareness and increased demand for organic and functional foods. Fresh figs are valued for their nutritional benefits, including high fiber, antioxidants, and essential minerals, making them popular among health-conscious consumers and food manufacturers.

Recent Trends in the Fresh Figs Market

  • Organic and sustainably farmed fresh figs are witnessing heightened demand, especially in North America and Europe, driven by clean-label trends and premium pricing.
  • Fig-based innovations in health foods, such as protein bars, natural sweeteners, and gourmet spreads, are expanding the fruit’s application scope.

Challenges in the Fresh Figs Market

  • Limited shelf life and perishability of fresh figs pose logistical challenges, especially for export markets and long-distance distribution.
  • Climate sensitivity and fluctuating weather conditions affect fig cultivation, leading to inconsistent supply and vulnerability in seasonal yield.

Top Countries Producing, Regulating, and Driving Demand in the Fresh Figs

Country Wise Analysis Of Fresh Figs Market

The USA demand is driven by rising interest in healthy snacking, expanding online retail, and strong domestic production, especially in California. Germany and France continue to maintain stable consumption, supported by EU organic farming subsidies and health food regulations. Developed markets such as the USA (4.8% CAGR), UK (3.3%), and Japan (4.1%) are growing at a steady 0.66-0.96x of the global average. Japan’s demand is shaped by high-end consumer preferences, culinary innovation, and a growing shift toward natural sweeteners and organic products.

The USA shows the highest growth in the fresh figs market among leading OECD nations, driven by demand for healthy snacking and strong retail distribution. Germany follows with consistent expansion supported by organic food trends and intra-EU imports. France maintains stable growth due to local cultivation and culinary usage. Japan sees rising demand for high-quality imported figs linked to health and diet trends.

The United Kingdom records the slowest pace, limited by high import dependence and low domestic production. While all five countries show positive momentum, their growth remains moderate compared to the global average, reflecting their mature market dynamics.

The report includes a comprehensive analysis of over 40+ countries; below are five top-performing OECD nations.
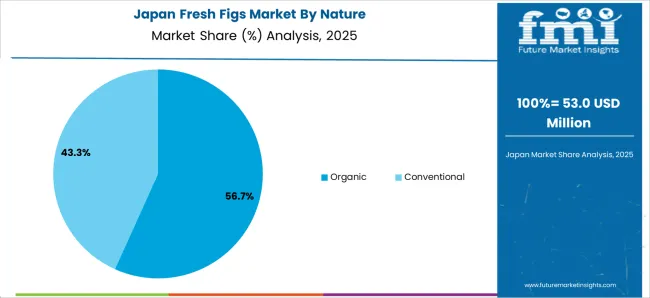
In-depth Analysis of Fresh Figs Demand in Japan

The Japan fresh figs market is projected to grow at a CAGR of 4.1% from 2025 to 2035. Growth is influenced by premium consumption trends, high awareness of Mediterranean diets, and the popularity of natural fruit-based products. Figs are used in desserts, artisanal jams, and functional snacks. Japan favors high-grade imported figs due to its limited domestic cultivation and demand for visual and nutritional quality.
  • High demand for premium imported varieties.
  • Growth led by natural sweeteners and health-centric diets.

Growth Outlook for Fresh Figs in Germany

The fresh figs market in Germany is projected to expand at a CAGR of 4.6% during the forecast period. The demand is largely driven by strong consumer focus on organic, plant-based, and nutrient-rich foods. Figs are increasingly used in gourmet applications, vegan products, and wellness diets. Germany benefits from both domestic and intra-EU imports under relaxed trade tariffs.

  • EU-backed organic farming fuels supply and demand.
  • Wide use in health foods, bakery, and vegan alternatives.

Fresh Figs Consumption Trends in France

The French fresh figs market is projected to register a CAGR of 4.5% from 2025 to 2035. The country’s Mediterranean climate supports regional production, especially in Provence. Figs are a staple in traditional cuisine, and their growing use in processed health foods further boosts consumption. Government initiatives to support organic farming and regional supply chains enhance market growth.
  • Regional production supports self-sufficiency.
  • High inclusion in local culinary and healthy snack products.

Demand Trajectory for Fresh Figs in the USA

The USA fresh figs market is expected to grow at a CAGR of 4.8% between 2025 and 2035, slightly below the global average. Growth is being fueled by expanding retail distribution, the rise of functional snacking, and consumer interest in whole, unprocessed fruits. California remains the central production hub, while organic imports support demand across major cities.

  • Strong demand through online grocery and health-focused brands.
  • Expansion led by West Coast fig farming and organic imports.

Fresh Figs Outlook in the UK

The UK fresh figs market is forecast to grow at a CAGR of 3.3% from 2025 to 2035, representing the slowest growth among leading OECD countries at 0.66 times the global rate. Demand is supported by baking, premium foodservice, and health foods. However, high import dependency and limited local production restrain volume expansion.
  • Increasing use in baking and breakfast products.
  • Import-driven market with slow but steady retail demand.

Leading Fresh Figs Suppliers and Producers

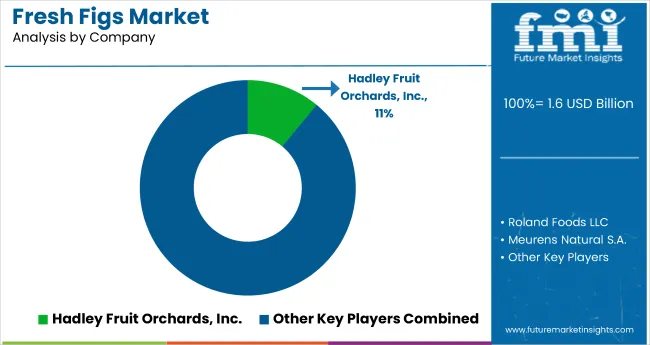
Fresh Figs Market Analysis By Company

The global market is moderately fragmented, with several established players such as Hadley Fruit Orchards, Inc., Roland Foods LLC, Meurens Natural S.A., FruitLips, and Jiaherb, Inc. leading global supply and innovation. These companies offer premium-grade fresh figs for retail, foodservice, and processing applications. Hadley Fruit Orchards, Inc. focuses on sun-ripened California figs, while Roland Foods LLC distributes specialty fig-based culinary products worldwide.

Meurens Natural S.A. emphasizes clean-label fig ingredients for functional foods. FruitLips is known for its artisanal and preservative-free fig offerings, and Jiaherb, Inc. provides high-purity fig extracts for nutraceuticals. Other prominent contributors like Athos Agricola S.A., Earl's Organic Produce, Alara Agri, Isik Tarim A.S., and Valley Fig Growers, Inc. continue to support market diversity with organic, regional, and export-oriented products.

Recent Fresh Figs Industry News

  • In October 2024, Meurens Natural S.A. announced the development of fig-based sweetener concentrates for use in bakery and dairy applications. The new products are part of the company’s move to replace refined sugars with natural, fruit-derived alternatives.

Fresh Figs Market Report Scope

Report Attributes Details
Market Size (2025) USD 1.6 billion
Projected Market Size (2035) USD 2.6 billion
CAGR (2025 to 2035) 5%
Base Year for Estimation 2024
Historical Period 2020 to 2024
Projections Period 2025 to 2035
Report Parameter USD billion for value / volume in Metric Tons
Nature Analyzed Organic and Conventional
Type Analyzed Smyrna Figs, Black Figs, Sari Lop Figs, Mission Figs, Kadota Figs, others (Calimyrna Figs, Adriatic Figs, Brown Turkey Figs, Desert King Figs)
Distribution Channel Analyzed Supermarket and Hypermarkets, Specialty Stores, Online Retail
Regions Covered North America, Latin America, Western Europe, South Asia, East Asia, Eastern Europe, Middle East & Africa
Countries Covered United States, United Kingdom, Germany, France, Japan, China, India, Brazil, South Korea, Australia and 40+ countries
Key Players Influencing the Market Hadley Fruit Orchards, Inc., Roland Foods LLC, Meurens Natural S.A., FruitLips , Jiaherb , Inc., Athos Agricola S.A., Earl's Organic Produce, Alara Agri, Isik Tarim A.S., Valley Fig Growers, Inc., Kirlioglu Figs, Yabanfood , National Raisin Company, Torres Tropical Fresh B.V.
Additional Attributes Market share by fig type, sales by nature, regional trade trends, import-export analysis, organic certification impact, competitive profiling

Key Segments

By Nature:

  • Organic
  • Conventional

By Variety:

  • Smyrna Figs
  • Black Figs
  • Sari Lop Figs
  • Mission Figs
  • Kadota Figs
  • Others

By Sales Channel:

  • Modern Trade
  • Specialty Stores
  • e-Retailers
  • Grocery Stores
  • Wholesale Stores
  • Industrial
  • Foodservice/HoReCa

By Region:

  • North America
    • United States
    • Canada
  • Latin America
    • Brazil
    • Mexico
    • Rest of Latin America
  • Europe
    • Germany
    • United Kingdom
    • France
    • Spain
    • Russia
    • Rest of Europe
  • Japan
  • Asia Pacific Excluding Japan
    • China
    • India
    • Malaysia
    • Singapore
    • Australia
    • Rest of APEJ
  • The Middle East and Africa
    • GCC Countries
    • Israel
    • South Africa
    • Rest of MEA

Table of Content

  1. Executive Summary
    • Global Market Outlook
    • Demand-side Trends
    • Supply-side Trends
    • Technology Roadmap Analysis
    • Analysis and Recommendations
  2. Market Overview
    • Market Coverage / Taxonomy
    • Market Definition / Scope / Limitations
  3. Market Background
    • Market Dynamics
      • Drivers
      • Restraints
      • Opportunity
      • Trends
    • Scenario Forecast
      • Demand in Optimistic Scenario
      • Demand in Likely Scenario
      • Demand in Conservative Scenario
    • Opportunity Map Analysis
    • Product Life Cycle Analysis
    • Supply Chain Analysis
      • Supply Side Participants and their Roles
        • Producers
        • Mid-Level Participants (Traders/ Agents/ Brokers)
        • Wholesalers and Distributors
      • Value Added and Value Created at Node in the Supply Chain
      • List of Raw Material Suppliers
      • List of Existing and Potential Buyer’s
    • Investment Feasibility Matrix
    • Value Chain Analysis
      • Profit Margin Analysis
      • Wholesalers and Distributors
      • Retailers
    • PESTLE and Porter’s Analysis
    • Regulatory Landscape
      • By Key Regions
      • By Key Countries
    • Regional Parent Market Outlook
    • Production and Consumption Statistics
    • Import and Export Statistics
  4. Global Market Analysis 2020 to 2024 and Forecast, 2025 to 2035
    • Historical Market Size Value (USD Billion) & Volume (Metric Tons) Analysis, 2020 to 2024
    • Current and Future Market Size Value (USD Billion) & Volume (Metric Tons) Projections, 2025 to 2035
      • Y-o-Y Growth Trend Analysis
      • Absolute $ Opportunity Analysis
  5. Global Market Pricing Analysis 2020 to 2024 and Forecast 2025 to 2035
  6. Global Market Analysis 2020 to 2024 and Forecast 2025 to 2035, By Nature
    • Introduction / Key Findings
    • Historical Market Size Value (USD Billion) & Volume (Metric Tons) Analysis By Nature, 2020 to 2024
    • Current and Future Market Size Value (USD Billion) & Volume (Metric Tons) Analysis and Forecast By Nature, 2025 to 2035
      • Organic
      • Conventional
    • Y-o-Y Growth Trend Analysis By Nature, 2020 to 2024
    • Absolute $ Opportunity Analysis By Nature, 2025 to 2035
  7. Global Market Analysis 2020 to 2024 and Forecast 2025 to 2035, By Type
    • Introduction / Key Findings
    • Historical Market Size Value (USD Billion) & Volume (Metric Tons) Analysis By Type, 2020 to 2024
    • Current and Future Market Size Value (USD Billion) & Volume (Metric Tons) Analysis and Forecast By Type, 2025 to 2035
      • Smyrna Figs
      • Black Figs
      • Sari Lop Figs
      • Mission Figs
      • Kadota Figs
      • Others (Calimyrna Figs, Adriatic Figs, Brown Turkey Figs, Desert King Figs)
    • Y-o-Y Growth Trend Analysis By Type, 2020 to 2024
    • Absolute $ Opportunity Analysis By Type, 2025 to 2035
  8. Global Market Analysis 2020 to 2024 and Forecast 2025 to 2035, By Distribution Channel
    • Introduction / Key Findings
    • Historical Market Size Value (USD Billion) & Volume (Metric Tons) Analysis By Distribution Channel, 2020 to 2024
    • Current and Future Market Size Value (USD Billion) & Volume (Metric Tons) Analysis and Forecast By Distribution Channel, 2025 to 2035
      • Supermarket and Hypermarkets
      • Specialty Stores
      • Online Retail
    • Y-o-Y Growth Trend Analysis By Distribution Channel, 2020 to 2024
    • Absolute $ Opportunity Analysis By Distribution Channel, 2025 to 2035
  9. Global Market Analysis 2020 to 2024 and Forecast 2025 to 2035, By Region
    • Introduction
    • Historical Market Size Value (USD Billion) & Volume (Metric Tons) Analysis By Region, 2020 to 2024
    • Current Market Size Value (USD Billion) & Volume (Metric Tons) Analysis and Forecast By Region, 2025 to 2035
      • North America
      • Latin America
      • Western Europe
      • Eastern Europe
      • East Asia
      • South Asia & Pacific
      • Middle East and Africa
    • Market Attractiveness Analysis By Region
  10. North America Market Analysis 2020 to 2024 and Forecast 2025 to 2035, By Country
    • Historical Market Size Value (USD Billion) & Volume (Metric Tons) Trend Analysis By Market Taxonomy, 2020 to 2024
    • Market Size Value (USD Billion) & Volume (Metric Tons) Forecast By Market Taxonomy, 2025 to 2035
      • By Country
        • USA
        • Canada
        • Mexico
      • By Nature
      • By Type
      • By Distribution Channel
    • Market Attractiveness Analysis
      • By Country
      • By Nature
      • By Type
      • By Distribution Channel
    • Key Takeaways
  11. Latin America Market Analysis 2020 to 2024 and Forecast 2025 to 2035, By Country
    • Historical Market Size Value (USD Billion) & Volume (Metric Tons) Trend Analysis By Market Taxonomy, 2020 to 2024
    • Market Size Value (USD Billion) & Volume (Metric Tons) Forecast By Market Taxonomy, 2025 to 2035
      • By Country
        • Brazil
        • Argentina
        • Rest of LATAM
      • By Nature
      • By Type
      • By Distribution Channel
    • Market Attractiveness Analysis
      • By Country
      • By Nature
      • By Type
      • By Distribution Channel
    • Key Takeaways
  12. Western Europe Market Analysis 2020 to 2024 and Forecast 2025 to 2035, By Country
    • Historical Market Size Value (USD Billion) & Volume (Metric Tons) Trend Analysis By Market Taxonomy, 2020 to 2024
    • Market Size Value (USD Billion) & Volume (Metric Tons) Forecast By Market Taxonomy, 2025 to 2035
      • By Country
        • Germany
        • Italy
        • France
        • UK
        • Spain
        • BENELUX
        • Nordic
        • Rest of W.Europe
      • By Nature
      • By Type
      • By Distribution Channel
    • Market Attractiveness Analysis
      • By Country
      • By Nature
      • By Type
      • By Distribution Channel
    • Key Takeaways
  13. Eastern Europe Market Analysis 2020 to 2024 and Forecast 2025 to 2035, By Country
    • Historical Market Size Value (USD Billion) & Volume (Metric Tons) Trend Analysis By Market Taxonomy, 2020 to 2024
    • Market Size Value (USD Billion) & Volume (Metric Tons) Forecast By Market Taxonomy, 2025 to 2035
      • By Country
        • Russia
        • Hungary
        • Poland
        • Balkan & Baltics
        • Rest of E. Europe
      • By Nature
      • By Type
      • By Distribution Channel
    • Market Attractiveness Analysis
      • By Country
      • By Nature
      • By Type
      • By Distribution Channel
    • Key Takeaways
  14. East Asia Market Analysis 2020 to 2024 and Forecast 2025 to 2035, By Country
    • Historical Market Size Value (USD Billion) & Volume (Metric Tons) Trend Analysis By Market Taxonomy, 2020 to 2024
    • Market Size Value (USD Billion) & Volume (Metric Tons) Forecast By Market Taxonomy, 2025 to 2035
      • By Country
        • China
        • Japan
        • South Korea
      • By Nature
      • By Type
      • By Distribution Channel
    • Market Attractiveness Analysis
      • By Country
      • By Nature
      • By Type
      • By Distribution Channel
    • Key Takeaways
  15. South Asia & Pacific Market Analysis 2020 to 2024 and Forecast 2025 to 2035, By Country
    • Historical Market Size Value (USD Billion) & Volume (Metric Tons) Trend Analysis By Market Taxonomy, 2020 to 2024
    • Market Size Value (USD Billion) & Volume (Metric Tons) Forecast By Market Taxonomy, 2025 to 2035
      • By Country
        • India
        • Australia & New Zealand
        • ASEAN
        • Rest of SAP
      • By Nature
      • By Type
      • By Distribution Channel
    • Market Attractiveness Analysis
      • By Country
      • By Nature
      • By Type
      • By Distribution Channel
    • Key Takeaways
  16. Middle East and Africa Market Analysis 2020 to 2024 and Forecast 2025 to 2035, By Country
    • Historical Market Size Value (USD Billion) & Volume (Metric Tons) Trend Analysis By Market Taxonomy, 2020 to 2024
    • Market Size Value (USD Billion) & Volume (Metric Tons) Forecast By Market Taxonomy, 2025 to 2035
      • By Country
        • GCC Countries
        • Northern Africa
        • South Africa
        • Turkiye
        • Rest of MEA
      • By Nature
      • By Type
      • By Distribution Channel
    • Market Attractiveness Analysis
      • By Country
      • By Nature
      • By Type
      • By Distribution Channel
    • Key Takeaways
  17. Key Countries Market Analysis
    • USA
      • Pricing Analysis
      • Market Share Analysis, 2024
        • By Nature
        • By Type
        • By Distribution Channel
    • Canada
      • Pricing Analysis
      • Market Share Analysis, 2024
        • By Nature
        • By Type
        • By Distribution Channel
    • Brazil
      • Pricing Analysis
      • Market Share Analysis, 2024
        • By Nature
        • By Type
        • By Distribution Channel
    • Mexico
      • Pricing Analysis
      • Market Share Analysis, 2024
        • By Nature
        • By Type
        • By Distribution Channel
    • Argentina
      • Pricing Analysis
      • Market Share Analysis, 2024
        • By Nature
        • By Type
        • By Distribution Channel
  18. Market Structure Analysis
    • Competition Dashboard
    • Competition Benchmarking
    • Market Share Analysis of Top Players
      • By Regional
      • By Nature
      • By Type
      • By Distribution Channel
  19. Competition Analysis
    • Competition Deep Dive
      • Hadley Fruit Orchards, Inc.
        • Overview
        • Product Portfolio
        • Profitability by Market Segments (Product/Age /Sales Channel/Region)
        • Sales Footprint
        • Strategy Overview
          • Marketing Strategy
          • Product Strategy
          • Channel Strategy
      • Roland Foods LLC
        • Overview
        • Product Portfolio
        • Profitability by Market Segments (Product/Age /Sales Channel/Region)
        • Sales Footprint
        • Strategy Overview
          • Marketing Strategy
          • Product Strategy
          • Channel Strategy
      • Meurens Natural S.A.
        • Overview
        • Product Portfolio
        • Profitability by Market Segments (Product/Age /Sales Channel/Region)
        • Sales Footprint
        • Strategy Overview
          • Marketing Strategy
          • Product Strategy
          • Channel Strategy
      • FruitLips
        • Overview
        • Product Portfolio
        • Profitability by Market Segments (Product/Age /Sales Channel/Region)
        • Sales Footprint
        • Strategy Overview
          • Marketing Strategy
          • Product Strategy
          • Channel Strategy
      • Jiaherb, Inc.
        • Overview
        • Product Portfolio
        • Profitability by Market Segments (Product/Age /Sales Channel/Region)
        • Sales Footprint
        • Strategy Overview
          • Marketing Strategy
          • Product Strategy
          • Channel Strategy
      • Athos Agricola S.A.
        • Overview
        • Product Portfolio
        • Profitability by Market Segments (Product/Age /Sales Channel/Region)
        • Sales Footprint
        • Strategy Overview
          • Marketing Strategy
          • Product Strategy
          • Channel Strategy
      • Earl's Organic Produce
        • Overview
        • Product Portfolio
        • Profitability by Market Segments (Product/Age /Sales Channel/Region)
        • Sales Footprint
        • Strategy Overview
          • Marketing Strategy
          • Product Strategy
          • Channel Strategy
      • Alara Agri
        • Overview
        • Product Portfolio
        • Profitability by Market Segments (Product/Age /Sales Channel/Region)
        • Sales Footprint
        • Strategy Overview
          • Marketing Strategy
          • Product Strategy
          • Channel Strategy
      • Isik Tarim A.S.
        • Overview
        • Product Portfolio
        • Profitability by Market Segments (Product/Age /Sales Channel/Region)
        • Sales Footprint
        • Strategy Overview
          • Marketing Strategy
          • Product Strategy
          • Channel Strategy
      • Valley Fig Growers, Inc.
        • Overview
        • Product Portfolio
        • Profitability by Market Segments (Product/Age /Sales Channel/Region)
        • Sales Footprint
        • Strategy Overview
          • Marketing Strategy
          • Product Strategy
          • Channel Strategy
      • Kirlioglu Figs
        • Overview
        • Product Portfolio
        • Profitability by Market Segments (Product/Age /Sales Channel/Region)
        • Sales Footprint
        • Strategy Overview
          • Marketing Strategy
          • Product Strategy
          • Channel Strategy
      • Yabanfood
        • Overview
        • Product Portfolio
        • Profitability by Market Segments (Product/Age /Sales Channel/Region)
        • Sales Footprint
        • Strategy Overview
          • Marketing Strategy
          • Product Strategy
          • Channel Strategy
      • National Raisin Company
        • Overview
        • Product Portfolio
        • Profitability by Market Segments (Product/Age /Sales Channel/Region)
        • Sales Footprint
        • Strategy Overview
          • Marketing Strategy
          • Product Strategy
          • Channel Strategy
      • Torres Tropical Fresh B.V.
        • Overview
        • Product Portfolio
        • Profitability by Market Segments (Product/Age /Sales Channel/Region)
        • Sales Footprint
        • Strategy Overview
          • Marketing Strategy
          • Product Strategy
          • Channel Strategy
  20. Assumptions & Acronyms Used
  21. Research Methodology

List of Tables

  • Table 1: Global Market Value (USD Billion) Forecast by Region, 2020-2035
  • Table 2: Global Market Volume (Metric Tons) Forecast by Region, 2020-2035
  • Table 3: Global Market Value (USD Billion) Forecast by Nature, 2020-2035
  • Table 4: Global Market Volume (Metric Tons) Forecast by Nature, 2020-2035
  • Table 5: Global Market Value (USD Billion) Forecast by Type, 2020-2035
  • Table 6: Global Market Volume (Metric Tons) Forecast by Type, 2020-2035
  • Table 7: Global Market Value (USD Billion) Forecast by Distribution Channel, 2020-2035
  • Table 8: Global Market Volume (Metric Tons) Forecast by Distribution Channel, 2020-2035
  • Table 9: North America Market Value (USD Billion) Forecast by Country, 2020-2035
  • Table 10: North America Market Volume (Metric Tons) Forecast by Country, 2020-2035
  • Table 11: North America Market Value (USD Billion) Forecast by Nature, 2020-2035
  • Table 12: North America Market Volume (Metric Tons) Forecast by Nature, 2020-2035
  • Table 13: North America Market Value (USD Billion) Forecast by Type, 2020-2035
  • Table 14: North America Market Volume (Metric Tons) Forecast by Type, 2020-2035
  • Table 15: North America Market Value (USD Billion) Forecast by Distribution Channel, 2020-2035
  • Table 16: North America Market Volume (Metric Tons) Forecast by Distribution Channel, 2020-2035
  • Table 17: Latin America Market Value (USD Billion) Forecast by Country, 2020-2035
  • Table 18: Latin America Market Volume (Metric Tons) Forecast by Country, 2020-2035
  • Table 19: Latin America Market Value (USD Billion) Forecast by Nature, 2020-2035
  • Table 20: Latin America Market Volume (Metric Tons) Forecast by Nature, 2020-2035
  • Table 21: Latin America Market Value (USD Billion) Forecast by Type, 2020-2035
  • Table 22: Latin America Market Volume (Metric Tons) Forecast by Type, 2020-2035
  • Table 23: Latin America Market Value (USD Billion) Forecast by Distribution Channel, 2020-2035
  • Table 24: Latin America Market Volume (Metric Tons) Forecast by Distribution Channel, 2020-2035
  • Table 25: Western Europe Market Value (USD Billion) Forecast by Country, 2020-2035
  • Table 26: Western Europe Market Volume (Metric Tons) Forecast by Country, 2020-2035
  • Table 27: Western Europe Market Value (USD Billion) Forecast by Nature, 2020-2035
  • Table 28: Western Europe Market Volume (Metric Tons) Forecast by Nature, 2020-2035
  • Table 29: Western Europe Market Value (USD Billion) Forecast by Type, 2020-2035
  • Table 30: Western Europe Market Volume (Metric Tons) Forecast by Type, 2020-2035
  • Table 31: Western Europe Market Value (USD Billion) Forecast by Distribution Channel, 2020-2035
  • Table 32: Western Europe Market Volume (Metric Tons) Forecast by Distribution Channel, 2020-2035
  • Table 33: Eastern Europe Market Value (USD Billion) Forecast by Country, 2020-2035
  • Table 34: Eastern Europe Market Volume (Metric Tons) Forecast by Country, 2020-2035
  • Table 35: Eastern Europe Market Value (USD Billion) Forecast by Nature, 2020-2035
  • Table 36: Eastern Europe Market Volume (Metric Tons) Forecast by Nature, 2020-2035
  • Table 37: Eastern Europe Market Value (USD Billion) Forecast by Type, 2020-2035
  • Table 38: Eastern Europe Market Volume (Metric Tons) Forecast by Type, 2020-2035
  • Table 39: Eastern Europe Market Value (USD Billion) Forecast by Distribution Channel, 2020-2035
  • Table 40: Eastern Europe Market Volume (Metric Tons) Forecast by Distribution Channel, 2020-2035
  • Table 41: East Asia Market Value (USD Billion) Forecast by Country, 2020-2035
  • Table 42: East Asia Market Volume (Metric Tons) Forecast by Country, 2020-2035
  • Table 43: East Asia Market Value (USD Billion) Forecast by Nature, 2020-2035
  • Table 44: East Asia Market Volume (Metric Tons) Forecast by Nature, 2020-2035
  • Table 45: East Asia Market Value (USD Billion) Forecast by Type, 2020-2035
  • Table 46: East Asia Market Volume (Metric Tons) Forecast by Type, 2020-2035
  • Table 47: East Asia Market Value (USD Billion) Forecast by Distribution Channel, 2020-2035
  • Table 48: East Asia Market Volume (Metric Tons) Forecast by Distribution Channel, 2020-2035
  • Table 49: South Asia & Pacific Market Value (USD Billion) Forecast by Country, 2020-2035
  • Table 50: South Asia & Pacific Market Volume (Metric Tons) Forecast by Country, 2020-2035
  • Table 51: South Asia & Pacific Market Value (USD Billion) Forecast by Nature, 2020-2035
  • Table 52: South Asia & Pacific Market Volume (Metric Tons) Forecast by Nature, 2020-2035
  • Table 53: South Asia & Pacific Market Value (USD Billion) Forecast by Type, 2020-2035
  • Table 54: South Asia & Pacific Market Volume (Metric Tons) Forecast by Type, 2020-2035
  • Table 55: South Asia & Pacific Market Value (USD Billion) Forecast by Distribution Channel, 2020-2035
  • Table 56: South Asia & Pacific Market Volume (Metric Tons) Forecast by Distribution Channel, 2020-2035
  • Table 57: Middle East and Africa Market Value (USD Billion) Forecast by Country, 2020-2035
  • Table 58: Middle East and Africa Market Volume (Metric Tons) Forecast by Country, 2020-2035
  • Table 59: Middle East and Africa Market Value (USD Billion) Forecast by Nature, 2020-2035
  • Table 60: Middle East and Africa Market Volume (Metric Tons) Forecast by Nature, 2020-2035
  • Table 61: Middle East and Africa Market Value (USD Billion) Forecast by Type, 2020-2035
  • Table 62: Middle East and Africa Market Volume (Metric Tons) Forecast by Type, 2020-2035
  • Table 63: Middle East and Africa Market Value (USD Billion) Forecast by Distribution Channel, 2020-2035
  • Table 64: Middle East and Africa Market Volume (Metric Tons) Forecast by Distribution Channel, 2020-2035


List of Figures

  • Figure 1: Global Market Volume (Metric Tons) Forecast 2020-2035
  • Figure 2: Global Market Pricing Analysis
  • Figure 3: Global Market Value (USD Billion) Forecast 2020-2035
  • Figure 4: Global Market Value Share and BPS Analysis by Nature, 2025 and 2035
  • Figure 5: Global Market Y-o-Y Growth Comparison by Nature, 2025-2035
  • Figure 6: Global Market Attractiveness Analysis by Nature
  • Figure 7: Global Market Value Share and BPS Analysis by Type, 2025 and 2035
  • Figure 8: Global Market Y-o-Y Growth Comparison by Type, 2025-2035
  • Figure 9: Global Market Attractiveness Analysis by Type
  • Figure 10: Global Market Value Share and BPS Analysis by Distribution Channel, 2025 and 2035
  • Figure 11: Global Market Y-o-Y Growth Comparison by Distribution Channel, 2025-2035
  • Figure 12: Global Market Attractiveness Analysis by Distribution Channel
  • Figure 13: Global Market Value (USD Billion) Share and BPS Analysis by Region, 2025 and 2035
  • Figure 14: Global Market Y-o-Y Growth Comparison by Region, 2025-2035
  • Figure 15: Global Market Attractiveness Analysis by Region
  • Figure 16: North America Market Incremental $ Opportunity, 2025-2035
  • Figure 17: Latin America Market Incremental $ Opportunity, 2025-2035
  • Figure 18: Western Europe Market Incremental $ Opportunity, 2025-2035
  • Figure 19: Eastern Europe Market Incremental $ Opportunity, 2025-2035
  • Figure 20: East Asia Market Incremental $ Opportunity, 2025-2035
  • Figure 21: South Asia & Pacific Market Incremental $ Opportunity, 2025-2035
  • Figure 22: Middle East and Africa Market Incremental $ Opportunity, 2025-2035
  • Figure 23: North America Market Value Share and BPS Analysis by Country, 2025 and 2035
  • Figure 24: North America Market Value Share and BPS Analysis by Nature, 2025 and 2035
  • Figure 25: North America Market Y-o-Y Growth Comparison by Nature, 2025-2035
  • Figure 26: North America Market Attractiveness Analysis by Nature
  • Figure 27: North America Market Value Share and BPS Analysis by Type, 2025 and 2035
  • Figure 28: North America Market Y-o-Y Growth Comparison by Type, 2025-2035
  • Figure 29: North America Market Attractiveness Analysis by Type
  • Figure 30: North America Market Value Share and BPS Analysis by Distribution Channel, 2025 and 2035
  • Figure 31: North America Market Y-o-Y Growth Comparison by Distribution Channel, 2025-2035
  • Figure 32: North America Market Attractiveness Analysis by Distribution Channel
  • Figure 33: Latin America Market Value Share and BPS Analysis by Country, 2025 and 2035
  • Figure 34: Latin America Market Value Share and BPS Analysis by Nature, 2025 and 2035
  • Figure 35: Latin America Market Y-o-Y Growth Comparison by Nature, 2025-2035
  • Figure 36: Latin America Market Attractiveness Analysis by Nature
  • Figure 37: Latin America Market Value Share and BPS Analysis by Type, 2025 and 2035
  • Figure 38: Latin America Market Y-o-Y Growth Comparison by Type, 2025-2035
  • Figure 39: Latin America Market Attractiveness Analysis by Type
  • Figure 40: Latin America Market Value Share and BPS Analysis by Distribution Channel, 2025 and 2035
  • Figure 41: Latin America Market Y-o-Y Growth Comparison by Distribution Channel, 2025-2035
  • Figure 42: Latin America Market Attractiveness Analysis by Distribution Channel
  • Figure 43: Western Europe Market Value Share and BPS Analysis by Country, 2025 and 2035
  • Figure 44: Western Europe Market Value Share and BPS Analysis by Nature, 2025 and 2035
  • Figure 45: Western Europe Market Y-o-Y Growth Comparison by Nature, 2025-2035
  • Figure 46: Western Europe Market Attractiveness Analysis by Nature
  • Figure 47: Western Europe Market Value Share and BPS Analysis by Type, 2025 and 2035
  • Figure 48: Western Europe Market Y-o-Y Growth Comparison by Type, 2025-2035
  • Figure 49: Western Europe Market Attractiveness Analysis by Type
  • Figure 50: Western Europe Market Value Share and BPS Analysis by Distribution Channel, 2025 and 2035
  • Figure 51: Western Europe Market Y-o-Y Growth Comparison by Distribution Channel, 2025-2035
  • Figure 52: Western Europe Market Attractiveness Analysis by Distribution Channel
  • Figure 53: Eastern Europe Market Value Share and BPS Analysis by Country, 2025 and 2035
  • Figure 54: Eastern Europe Market Value Share and BPS Analysis by Nature, 2025 and 2035
  • Figure 55: Eastern Europe Market Y-o-Y Growth Comparison by Nature, 2025-2035
  • Figure 56: Eastern Europe Market Attractiveness Analysis by Nature
  • Figure 57: Eastern Europe Market Value Share and BPS Analysis by Type, 2025 and 2035
  • Figure 58: Eastern Europe Market Y-o-Y Growth Comparison by Type, 2025-2035
  • Figure 59: Eastern Europe Market Attractiveness Analysis by Type
  • Figure 60: Eastern Europe Market Value Share and BPS Analysis by Distribution Channel, 2025 and 2035
  • Figure 61: Eastern Europe Market Y-o-Y Growth Comparison by Distribution Channel, 2025-2035
  • Figure 62: Eastern Europe Market Attractiveness Analysis by Distribution Channel
  • Figure 63: East Asia Market Value Share and BPS Analysis by Country, 2025 and 2035
  • Figure 64: East Asia Market Value Share and BPS Analysis by Nature, 2025 and 2035
  • Figure 65: East Asia Market Y-o-Y Growth Comparison by Nature, 2025-2035
  • Figure 66: East Asia Market Attractiveness Analysis by Nature
  • Figure 67: East Asia Market Value Share and BPS Analysis by Type, 2025 and 2035
  • Figure 68: East Asia Market Y-o-Y Growth Comparison by Type, 2025-2035
  • Figure 69: East Asia Market Attractiveness Analysis by Type
  • Figure 70: East Asia Market Value Share and BPS Analysis by Distribution Channel, 2025 and 2035
  • Figure 71: East Asia Market Y-o-Y Growth Comparison by Distribution Channel, 2025-2035
  • Figure 72: East Asia Market Attractiveness Analysis by Distribution Channel
  • Figure 73: South Asia & Pacific Market Value Share and BPS Analysis by Country, 2025 and 2035
  • Figure 74: South Asia & Pacific Market Value Share and BPS Analysis by Nature, 2025 and 2035
  • Figure 75: South Asia & Pacific Market Y-o-Y Growth Comparison by Nature, 2025-2035
  • Figure 76: South Asia & Pacific Market Attractiveness Analysis by Nature
  • Figure 77: South Asia & Pacific Market Value Share and BPS Analysis by Type, 2025 and 2035
  • Figure 78: South Asia & Pacific Market Y-o-Y Growth Comparison by Type, 2025-2035
  • Figure 79: South Asia & Pacific Market Attractiveness Analysis by Type
  • Figure 80: South Asia & Pacific Market Value Share and BPS Analysis by Distribution Channel, 2025 and 2035
  • Figure 81: South Asia & Pacific Market Y-o-Y Growth Comparison by Distribution Channel, 2025-2035
  • Figure 82: South Asia & Pacific Market Attractiveness Analysis by Distribution Channel
  • Figure 83: Middle East and Africa Market Value Share and BPS Analysis by Country, 2025 and 2035
  • Figure 84: Middle East and Africa Market Value Share and BPS Analysis by Nature, 2025 and 2035
  • Figure 85: Middle East and Africa Market Y-o-Y Growth Comparison by Nature, 2025-2035
  • Figure 86: Middle East and Africa Market Attractiveness Analysis by Nature
  • Figure 87: Middle East and Africa Market Value Share and BPS Analysis by Type, 2025 and 2035
  • Figure 88: Middle East and Africa Market Y-o-Y Growth Comparison by Type, 2025-2035
  • Figure 89: Middle East and Africa Market Attractiveness Analysis by Type
  • Figure 90: Middle East and Africa Market Value Share and BPS Analysis by Distribution Channel, 2025 and 2035
  • Figure 91: Middle East and Africa Market Y-o-Y Growth Comparison by Distribution Channel, 2025-2035
  • Figure 92: Middle East and Africa Market Attractiveness Analysis by Distribution Channel
  • Figure 93: Global Market - Tier Structure Analysis
  • Figure 94: Global Market - Company Share Analysis

Frequently Asked Questions

What is the projected size of the fresh figs market in 2025?

The market is valued at USD 1.6 billion in 2025.

What is the outlook on fresh figs demand by 2035?

The market is forecasted to reach USD 2.6 billion by 2035, reflecting a CAGR of 5%.

Which segment leads the fresh figs market by nature in 2025?

Organic fresh figs will lead the nature segment, accounting for 55% of the global market share in 2025.

What is the top distribution channel for the fresh figs market in 2025?

Supermarkets and hypermarkets will dominate the distribution channel segment with a 42% share in 2025.

Which country is projected to have the fastest-growing fresh figs market?

The United States is projected to grow at the fastest rate, with a CAGR of 4.8% from 2025 to 2035.

Explore Similar Insights

Future Market Insights

Fresh Figs Market