Car Air Freshener Market Analysis – Size, Share, and Forecast 2022 to 2032

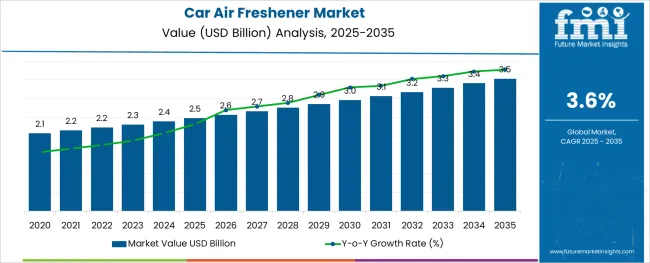
The global Car Air Freshener Market is estimated to be valued at ~USD 2,233.7 million in 2022. It is projected to reach ~USD 3,178.2 million by 2032. The market is likely to exhibit moderate growth at a CAGR of ~3.6% during the evaluation period from 2022 to 2032.

The rising need for quality air indoor and changing lifestyle of consumers are anticipated to drive sales of car air fresheners in the next ten years. Growing levels of pollution are expected to result in the surging demand for air care products that can be utilized in vehicles.

Apart from that, high demand for eco-friendly and sustainable air products with aromatic compounds, odor eliminators, and neutralizing odors would promulgate growth in the global market.

Demand for car air fresheners in the form of gels and cans is anticipated to rise in the evaluation period. Growth is mainly attributed to the ability of gels and cans to provide a consistent scent and last longer than paper or sprays.

In November 2022, for instance, EKAM, a handcrafted fragrance organization, introduced a new range of air fresheners such as scented sachets, car sprays, and room sprays.

The company is aiming to target certain concerns and areas that can be solved with its new fresheners. Thus, the introduction of innovative air fresheners for vehicles by key companies is expected to push sales in the global market.

Similarly, in May 2022, Febreze, an American brand of household odor eliminators, unveiled its latest Febreze CARstrology Collection. It includes 12 car fragrances that can be perfectly paired to match each zodiac sign. The company aims to help users match their car’s fragrance with their personality by moving over the new-car smell.

To launch its new collection, the company joined hands with Aliza Kelly, celebrity astrologer, host, bestselling author, and columillionist. Kelly reviewed dozens of available car fresheners and considered the needs & preferences of every astrological sign. Such unique concepts introduced by renowned companies are projected to bolster sales in the market.

Attributes Key Insights
Car Air Freshener Market Estimated Size (2022E) ~USD 2,233.7 million
Projected Market Valuation (2032) ~USD 3,178.2 million
Value-based CAGR (2022 to 2032) ~3.6%
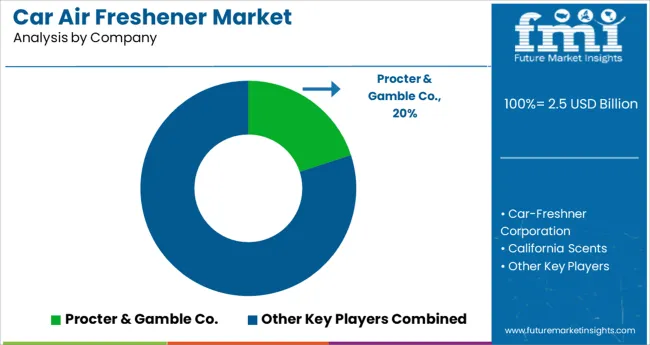
Collective Value Share: Top Players (2021A) ~10-15%

2017 to 2021 Global Car Air Freshener Sales Outlook Compared to Forecast from 2022 to 2032

In the last few years, companies have made significant progress in terms of the development of new environmentally sustainable products. They have also adapted new ways of manufacturing that are set to boost the market. In the car accessories market, air fresheners are nowadays considered to be the current trend.

Increasing innovation from manufacturers in the market has boosted it to new heights. Key players in the market are investing large amounts of their resources in research & development (R&D) practices and are coming up with various strategies to attract an increasing number of consumers.

Besides, as air fresheners can be used in different circumstances such as on a vent, on the mirror, as a pendant, or on a key chain, their demand is likely to surge in the global market.

Moreover, the increasing trend for car maintenance among consumers is expected to subsequently boost the demand for car air fresheners in the next ten years. The availability of car air fresheners at numerous locations such as car wash centers, independent stores, and convenience stores is also increasing product visibility and helping the market to grow.

Owing to the aforementioned factors, the global car air freshener market is anticipated to increase at a substantial growth rate of ~3.6% during the forecast period, over the ~3.2% growth rate experienced during the historical period of 2017 to 2021.

Key Trends Fueling Demand for Car Air Fresheners Worldwide

Increasing Sales of Four Wheelers to Push the Demand for Car Fragrances

In the past few years, there has been a significant rise in terms of sales of automobiles across the globe. The inflow of new brands in the automobile industry on the back of the growing preference of consumers to travel by four-wheelers is boosting sales of car air fresheners.

Car air fresheners can also help to enhance the aroma inside a car. The increasing number of automobiles on the road owing to better transportation facilities offered by government agencies is boosting the demand for car air fresheners in the market. Moreover, the need for consumers to eradicate bad smells inside a vehicle and to inhale fresh air is aiding growth in the global market.

Volatile Chemical Emissions Pose Challenges to Car Air Freshener Market Growth

Awareness about Potentially Hazardous Compounds May Obstruct Sales of Car Scents

Air fresheners emit a wide range of toxic chemicals that are often classified as hazardous in nature. A study by Springer Nature, for instance, revealed that air fresheners emitted approximately 546 volatile organic compounds (VOCs). Amongst these, about 30 VOCs were classified as potentially hazardous.

All types of air fresheners emitted one or more potentially hazardous compounds. The study further revealed that car air fresheners can lead to the emission of various volatile compounds such as hazardous VOCs. Thus, rising awareness about the hazardous impacts of car air fresheners may hinder product sales during the forecast period.
Top Countries Driving Sales and Innovation in Car Air Fresheners

Why is the Demand for Car Air Fresheners Growing Rapidly in the USA?

Rising Demand for Sustainable Car Perfumes in the USA to Bode Well for Manufacturers

The USA is one of the leading markets for car air fresheners. The country is set to generate an exponential demand during the evaluation period. The USA is estimated to exhibit a significant market share of around 75% by the end of 2022.

The presence of some of the top brands with extensive and unlimited product portfolios on the back of a high pool of loyal consumers is expected to push the country’s market.

Besides, the increased preference of consumers for sustainable and eco-friendly air fresheners that would not damage health or the environment is likely to create substantial growth opportunities in the USA market.

How are Car Air Freshener Companies Faring across China?

Availability of Low-cost Resources to Produce Car Air Freshener Sprays in China to Propel Demand

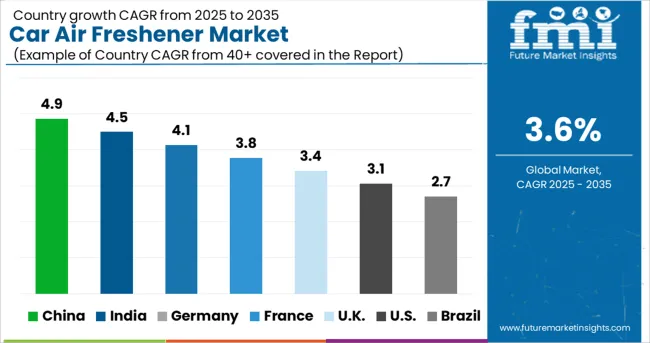
China is set to be one of the largest hubs for air freshener manufacturers in East Asia. It is anticipated to hold a market share of over 60% in East Asia and is set to grow at a CAGR of ~7.4% during the forecast period.

The country is considered to be one of the world’s dominant markets in terms of the manufacturing of air improvement goods and fragrances. Efficient manufacturing capabilities with low cost of production and availability of vast resources have attracted a large number of market players to establish their manufacturing base in the country.

Alternatively, it has resulted in a significant share of countries in the East Asia region.

Why are Sales of Car Air Fresheners Surging Exponentially in India?

High Demand for Car Freshener Sprays Infused with Natural Ingredients to Spur Sales in India

India is one of the emerging markets for car air fresheners and is anticipated to grow with rising awareness regarding environmental safety. In addition, citizens of the country are set to be highly inclined toward natural products and as a result, natural car air fresheners are generating surging demand in India.

Consumers in the country are nowadays looking for natural ingredients-based products from chemical compound products. A huge base of customers in India prefers natural and eco-friendly produced goods. Therefore, this factor is set to encourage Indian manufacturers to use natural ingredients in the production of car air fresheners.

Car Air Freshener Industry Analysis by Product Type, Fragrance, and Distribution Channel

Which is the Most Preferred Product Type across the Globe?

Hanging Car Freshener Gels to Gain Impetus as Customers Look for Long-lasting Fragrances

According to a recent analysis by FMI, based on product type, the hanging air freshener segment is anticipated to exhibit a growth rate of over 7.5% during the forecast period. Hanging air freshener is set to be a highly lucrative category and it is increasingly gaining popularity worldwide.

The target product is gaining prominence on the back of various factors such as ease of usability, use & throw ability, availability of a broad range of fragrances, and low cost of products with long-lasting durability. In order to switch to different fragrances over a short time span, consumers are mainly opting for hanging air fresheners for their cars, which is gaining impetus in the market.

Car Air Fresheners of Which Price Range are Mainly Opted by Customers Globally?

Customers Prefer Medium-Priced Car Spray Perfumes owing to Bulk Buying Practices

In terms of the price range, medium-priced car air fresheners are expected to hold a significant share of around 50% of the market. The premium category of air fresheners is likely to exhibit the highest growth rate during the forecast period among other segments.

The trend of consumers buying air fresheners in bulk capacity has inclined them to opt for products that are priced moderately. The inflow of consumers in hypermarkets/supermarkets due to the easy availability of medium-priced products has increased over the last few years. It is anticipated to boost sales of medium-priced air fresheners in the next ten years.
Leading Companies in the Global Car Air Freshener Market

Leading players operating globally in the market are focusing on partnerships, new product developments, and innovative product launches in order to expand their businesses. A few other key companies are aiming to join hands with local firms to co-develop unique fragrances to meet the surging demand from customers across the globe.

For instance,

  • In March 2022, Premium Guard Inc., a designer, and manufacturer of automotive products launched Pureflow Cabin Air Fresheners. It is set to change the car air freshener marketplace. The cabin air freshener technology is patented and is developed with slow-release scent technology, as well as recycled and natural ingredients.

Scope of the Car Air Freshener Market Report

Attribute Details
Estimated Market Size (2022) USD 2,233.7 million
Projected Market Valuation (2032) USD 3,178.2 million
Value-based CAGR (2022 to 2032) 3.6%
Forecast Period 2022 to 2032
Historical Data Available for 2017 to 2021
Market Analysis Value (USD million)
Key Regions Covered North America; Latin America; Europe; East Asia; South Asia; Oceania & MEA
Key Countries Covered The United States, Canada, Brazil, Mexico, Germany, the United Kingdom, France, Spain, Italy, Russia, South Africa, Northern Africa GCC Countries, China, Japan, South Korea, India, Thailand, Malaysia, Indonesia, Australia & New Zealand.
Key Segments Covered Product Type, Product Form, Price Range, Sales Channel, and Region
Key Companies Profiled Procter & Gamble Co.; Car-Freshener Corporation; California Scents; Church & Dwight Co. Inc.; Godrej Household Products; Reckitt Benckiser Group Plc.; Amway; Kobayashi; Liby; Houdy; Farcent; Jiali; Other (on request)
Report Coverage Market Forecast, Company Share Analysis, Competition Intelligence, DROT Analysis, Market Dynamics and Challenges, and Strategic Growth Initiatives

Car Air Freshener Market Segmentation by Category and Application

By Product Type:

  • Clip-on
  • Plug-ins
  • Spray/Aerosol
  • Paper
  • Hanging
  • Other

By Product Form:

  • Crystal
  • Foam
  • Gel
  • Liquid
  • Powder
  • Other

By Price Range:

  • Low
  • Medium
  • Premium

By Sales Channel:

  • Hypermarkets/Supermarkets
  • Convenience Stores
  • Departmental Stores
  • Independent Stores
  • Online Retailers
  • Others

By Region:

  • North America
  • Latin America
  • Europe
  • East Asia
  • South Asia
  • Oceania
  • Middle East and Africa (MEA)

Table of Content

  • 1. Executive Summary | Car Air Freshener Market
  • 2. Market Overview
  • 3. Key Market Trends
  • 4. Global Market Demand Analysis 2017 to 2021 and Forecast 2022 to 2032
  • 5. Global Market - Pricing Analysis
  • 6. Global Market Demand (in Value or in USD million) Analysis 2017 to 2021 and Forecast 2022 to 2032
  • 7. Market Background
  • 8. Global Market Analysis 2017 to 2021 and Forecast 2022 to 2032, By Product Type
    • 8.1. Clip-on
    • 8.2. Plug-ins
    • 8.3. Spray/Aerosol
    • 8.4. Paper
    • 8.5. Hanging
    • 8.6. Other
  • 9. Global Market Analysis 2017 to 2021 and Forecast 2022 to 2032, By Product Form
    • 9.1. Crystal
    • 9.2. Foam
    • 9.3. Gel
    • 9.4. Liquid
    • 9.5. Powder
    • 9.6. Other
  • 10. Global Market Analysis 2017 to 2021 and Forecast 2022 to 2032, By Price Range
    • 10.1. Low
    • 10.2. Medium
    • 10.3. Premium
  • 11. Global Market Analysis 2017 to 2021 and Forecast 2022 to 2032, By Sales Channel
    • 11.1. Hypermarkets/Supermarkets
    • 11.2. Convenience Stores
    • 11.3. Departmental Stores
    • 11.4. Independent Stores
    • 11.5. Online Retailers
    • 11.6. Others
  • 12. Global Market Analysis 2017 to 2021 and Forecast 2022 to 2032, By Region
    • 12.1. North America
    • 12.2. Latin America
    • 12.3. Europe
    • 12.4. East Asia
    • 12.5. South Asia
    • 12.6. Oceania
    • 12.7. MEA
  • 13. North America Market Analysis 2017 to 2021 and Forecast 2022 to 2032
  • 14. Latin America Market Analysis 2017 to 2021 and Forecast 2022 to 2032
  • 15. Europe Market Analysis 2017 to 2021 and Forecast 2022 to 2032
  • 16. East Asia Market Analysis 2017 to 2021 and Forecast 2022 to 2032
  • 17. South Asia Market Analysis 2017 to 2021 and Forecast 2022 to 2032
  • 18. Oceania Market Analysis 2017 to 2021 and Forecast 2022 to 2032
  • 19. MEA Market Analysis 2017 to 2021 and Forecast 2022 to 2032
  • 20. Market Structure Analysis
  • 21. Competition Analysis
    • 21.1. Procter & Gamble Co.
    • 21.2. Car-Freshener Corporation
    • 21.3. California Scents
    • 21.4. Church & Dwight Co. Inc.
    • 21.5. Godrej Household Products
    • 21.6. Reckitt Benckiser Group Plc.
    • 21.7. Amway
    • 21.8. Kobayashi
    • 21.9. Liby
    • 21.10. Houdy
    • 21.11. Farcent
    • 21.12. Jiali
    • 21.13. Others (As per Request)
  • 22. Assumptions and Acronyms Used
  • 23. Research Methodology

List of Tables

Table 1: Global Market Value (US$ million) Forecast, By Product Type, 2017 to 2032

Table 2: Global Market Volume (‘000 Units) Forecast, By Product Type, 2017 to 2032

Table 3: Global Market Value (US$ million) Forecast, By Product Form, 2017 to 2032

Table 4: Global Market Volume (‘000 Units) Forecast, By Product Form, 2017 to 2032

Table 5: Global Market Value (US$ million) Forecast, By Price Range, 2017 to 2032

Table 6: Global Market Volume (‘000 Units) Forecast, By Price Range, 2017 to 2032

Table 7: Global Market Value (US$ million) Forecast, By Sales Channel, 2017 to 2032

Table 8: Global Market Volume (‘000 Units) Forecast, By Sales Channel, 2017 to 2032

Table 9: Global Market Value (US$ million) Forecast, By Region, 2017 to 2032

Table 10: Global Market Volume (‘000 Units) Forecast, By Region, 2017 to 2032

Table 11: North America Market Value (US$ million) Forecast, By Country, 2017 to 2032

Table 12: North America Market Volume (‘000 Units) Forecast, By Country, 2017 to 2032

Table 13: North America Market Value (US$ million) Forecast, By Product Type, 2017 to 2032

Table 14: North America Market Volume (‘000 Units) Forecast, By Product Type, 2017 to 2032

Table 15: North America Market Value (US$ million) Forecast, By Product Form, 2017 to 2032

Table 16: North America Market Volume (‘000 Units) Forecast, By Product Form, 2017 to 2032

Table 17: North America Market Value (US$ million) Forecast, By Price Range, 2017 to 2032

Table 18: North America Market Volume (‘000 Units) Forecast, By Price Range, 2017 to 2032

Table 19: North America Market Value (US$ million) Forecast, By Sales Channel, 2017 to 2032

Table 20 : North America Market Volume (‘000 Units) Forecast, By Sales Channel, 2017 to 2032

Table 21: Latin America Market Value (US$ million) Forecast, By Country, 2017 to 2032

Table 22: Latin America Market Volume (‘000 Units) Forecast, By Country, 2017 to 2032

Table 23: Latin America Market Value (US$ million) Forecast, By Product Type, 2017 to 2032

Table 24: Latin America Market Volume (‘000 Units) Forecast, By Product Type, 2017 to 2032

Table 25: Latin America Market Value (US$ million) Forecast, By Product Form, 2017 to 2032

Table 26: Latin America Market Volume (‘000 Units) Forecast, By Product Form, 2017 to 2032

Table 27: Latin America Market Value (US$ million) Forecast, By Price Range, 2017 to 2032

Table 28: Latin America Market Volume (‘000 Units) Forecast, By Price Range, 2017 to 2032

Table 29: Latin America Market Value (US$ million) Forecast, By Sales Channel, 2017 to 2032

Table 30: Latin America Market Volume (‘000 Units) Forecast, By Sales Channel, 2017 to 2032

Table 31 : Europe Market Value (US$ million) Forecast, By Country, 2017 to 2032

Table 32: Europe Market Volume (‘000 Units) Forecast, By Country, 2017 to 2032

Table 33: Europe Market Value (US$ million) Forecast, By Product Type, 2017 to 2032

Table 34: Europe Market Volume (‘000 Units) Forecast, By Product Type, 2017 to 2032

Table 35: Europe Market Value (US$ million) Forecast, By Product Form, 2017 to 2032

Table 36: Europe Market Volume (‘000 Units) Forecast, By Product Form, 2017 to 2032

Table 37: Europe Market Value (US$ million) Forecast, By Price Range, 2017 to 2032

Table 38: Europe Market Volume (‘000 Units) Forecast, By Price Range, 2017 to 2032

Table 39: Europe Market Value (US$ million) Forecast, By Sales Channel, 2017 to 2032

Table 40: Europe Market Volume (‘000 Units) Forecast, By Sales Channel, 2017 to 2032

Table 41: East Asia Market Value (US$ million) Forecast, By Country, 2017 to 2032

Table 42: East Asia Market Volume (‘000 Units) Forecast, By Country, 2017 to 2032

Table 43: East Asia Market Value (US$ million) Forecast, By Product Type, 2017 to 2032

Table 44: East Asia Market Volume (‘000 Units) Forecast, By Product Type, 2017 to 2032

Table 45: East Asia Market Value (US$ million) Forecast, By Product Form, 2017 to 2032

Table 46: East Asia Market Volume (‘000 Units) Forecast, By Product Form, 2017 to 2032

Table 47: East Asia Market Value (US$ million) Forecast, By Price Range, 2017 to 2032

Table 48: East Asia Market Volume (‘000 Units) Forecast, By Price Range, 2017 to 2032

Table 49: East Asia Market Value (US$ million) Forecast, By Sales Channel, 2017 to 2032

Table 50: East Asia Market Volume (‘000 Units) Forecast, By Sales Channel, 2017 to 2032

Table 51: South Asia Market Value (US$ million) Forecast, By Country, 2017 to 2032

Table 52: South Asia Market Volume (‘000 Units) Forecast, By Country, 2017 to 2032

Table 53: South Asia Market Value (US$ million) Forecast, By Product Type, 2017 to 2032

Table 54: South Asia Market Volume (‘000 Units) Forecast, By Product Type, 2017 to 2032

Table 55: South Asia Market Value (US$ million) Forecast, By Product Form, 2017 to 2032

Table 56: South Asia Market Volume (‘000 Units) Forecast, By Product Form, 2017 to 2032

Table 57: South Asia Market Value (US$ million) Forecast, By Price Range, 2017 to 2032

Table 58: South Asia Market Volume (‘000 Units) Forecast, By Price Range, 2017 to 2032

Table 59: South Asia Market Value (US$ million) Forecast, By Sales Channel, 2017 to 2032

Table 60 : South Asia Market Volume (‘000 Units) Forecast, By Sales Channel, 2017 to 2032

Table 61: Oceania Market Value (US$ million) Forecast, By Country, 2017 to 2032

Table 62: Oceania Market Volume (‘000 Units) Forecast, By Country, 2017 to 2032

Table 63: Oceania Market Value (US$ million) Forecast, By Product Type, 2017 to 2032

Table 64: Oceania Market Volume (‘000 Units) Forecast, By Product Type, 2017 to 2032

Table 65: Oceania Market Value (US$ million) Forecast, By Product Form, 2017 to 2032

Table 66: Oceania Market Volume (‘000 Units) Forecast, By Product Form, 2017 to 2032

Table 67: Oceania Market Value (US$ million) Forecast, By Price Range, 2017 to 2032

Table 68: Oceania Market Volume (‘000 Units) Forecast, By Price Range, 2017 to 2032

Table 69: Oceania Market Value (US$ million) Forecast, By Sales Channel, 2017 to 2032

Table 70: Oceania Market Volume (‘000 Units) Forecast, By Sales Channel, 2017 to 2032

Table 71: MEA Market Value (US$ million) Forecast, By Country, 2017 to 2032

Table 72: MEA Market Volume (‘000 Units) Forecast, By Country, 2017 to 2032

Table 73: MEA Market Value (US$ million) Forecast, By Product Type, 2017 to 2032

Table 74: MEA Market Volume (‘000 Units) Forecast, By Product Type, 2017 to 2032

Table 75: MEA Market Value (US$ million) Forecast, By Product Form, 2017 to 2032

Table 76: MEA Market Volume (‘000 Units) Forecast, By Product Form, 2017 to 2032

Table 77: MEA Market Value (US$ million) Forecast, By Price Range, 2017 to 2032

Table 78: MEA Market Volume (‘000 Units) Forecast, By Price Range, 2017 to 2032

Table 79: MEA Market Value (US$ million) Forecast, By Sales Channel, 2017 to 2032

Table 80: MEA Market Volume (‘000 Units) Forecast, By Sales Channel, 2017 to 2032

List of Figures

Figure 01: Global Market Value (US$ million) and Volume (‘000 Units) Analysis, 2017 to 2032

Figure 02: Global Market Value (US$ million) and Volume (‘000 Units) Forecast 2022 to 2032

Figure 03: Global Market Value (US$ million) and Volume (‘000 Units) , 2017 to 2032

Figure 04: Global Market Absolute $ Opportunity (US$ million) 2022 to 2032

Figure 05: Global Market Value (US$ million) Analysis by Product Type, 2017 to 2032

Figure 06: Global Market Volume (‘000 Units) Analysis by Product Type, 2017 to 2032

Figure 07: Global Market Y-o-Y Growth (%) Projections, By Product Type, 2022 to 2032

Figure 08: Global Market Attractiveness by Product Type, 2022 to 2032

Figure 09: Global Market Value (US$ million) Analysis by Product Form, 2017 to 2032

Figure 10: Global Market Volume (‘000 Units) Analysis by Product Form, 2017 to 2032

Figure 11: Global Market Y-o-Y Growth (%) Projections, By Product Form, 2022 to 2032

Figure 12: Global Market Attractiveness by Product Form, 2022 to 2032

Figure 13: Global Market Value (US$ million) Analysis by Price Range, 2017 to 2032

Figure 14: Global Market Volume (‘000 Units) Analysis by Price Range, 2017 to 2032

Figure 15: Global Market Y-o-Y Growth (%) Projections, By Price Range, 2022 to 2032

Figure 16: Global Market Attractiveness by Price Range, 2022 to 2032

Figure 17: Global Market Value (US$ million) Analysis by Sales Channel, 2017 to 2032

Figure 18: Global Market Volume (‘000 Units) Analysis by Sales Channel, 2017 to 2032

Figure 19: Global Market Y-o-Y Growth (%) Projections, By Sales Channel, 2022 to 2032

Figure 20: Global Market Attractiveness by Sales Channel, 2022 to 2032

Figure 21: Global Market Value (US$ million) Analysis by Region, 2017 to 2032

Figure 22: Global Market Volume (‘000 Units) Analysis by Region, 2017 to 2032

Figure 23: Global Market Y-o-Y Growth (%) Projections, By Region, 2022 to 2032

Figure 24: Global Market Attractiveness by Region, 2022 to 2032

Figure 25: North America Market Value (US$ million) Analysis by Country, 2017 to 2032

Figure 26: North America Market Volume (‘000 Units) Analysis by Country, 2017 to 2032

Figure 27: North America Market Y-o-Y Growth (%) Projections, By Country, 2022 to 2032

Figure 28: North America Market Attractiveness by Country, 2022 to 2032

Figure 29: North America Market Value (US$ million) Analysis by Product Type, 2017 to 2032

Figure 30: North America Market Volume (‘000 Units) Analysis by Product Type, 2017 to 2032

Figure 31: North America Market Y-o-Y Growth (%) Projections, By Product Type, 2022 to 2032

Figure 32: North America Market Attractiveness by Product Type, 2022 to 2032

Figure 33: North America Market Value (US$ million) Analysis by Product Form, 2017 to 2032

Figure 34: North America Market Volume (‘000 Units) Analysis by Product Form, 2017 to 2032

Figure 35: North America Market Y-o-Y Growth (%) Projections, By Product Form, 2022 to 2032

Figure 36: North America Market Attractiveness by Product Form, 2022 to 2032

Figure 37: North America Market Value (US$ million) Analysis by Price Range, 2017 to 2032

Figure 38: North America Market Volume (‘000 Units) Analysis by Price Range, 2017 to 2032

Figure 39: North America Market Y-o-Y Growth (%) Projections, By Price Range, 2022 to 2032

Figure 40: North America Market Attractiveness by Price Range, 2022 to 2032

Figure 41: North America Market Value (US$ million) Analysis by Sales Channel, 2017 to 2032

Figure 42: North America Market Volume (‘000 Units) Analysis by Sales Channel, 2017 to 2032

Figure 43: North America Market Y-o-Y Growth (%) Projections, By Sales Channel, 2022 to 2032

Figure 44: North America Market Attractiveness by Sales Channel, 2022 to 2032

Figure 45: Latin America Market Value (US$ million) Analysis by Country, 2017 to 2032

Figure 46: Latin America Market Volume (‘000 Units) Analysis by Country, 2017 to 2032

Figure 47: Latin America Market Y-o-Y Growth (%) Projections, By Country, 2022 to 2032

Figure 48: Latin America Market Attractiveness by Country, 2022 to 2032

Figure 49: Latin America Market Value (US$ million) Analysis by Product Type, 2017 to 2032

Figure 50: Latin America Market Volume (‘000 Units) Analysis by Product Type, 2017 to 2032

Figure 51: Latin America Market Y-o-Y Growth (%) Projections, By Product Type, 2022 to 2032

Figure 52: Latin America Market Attractiveness by Product Type, 2022 to 2032

Figure 53: Latin America Market Value (US$ million) Analysis by Product Form, 2017 to 2032

Figure 54: Latin America Market Volume (‘000 Units) Analysis by Product Form, 2017 to 2032

Figure 55: Latin America Market Y-o-Y Growth (%) Projections, By Product Form, 2022 to 2032

Figure 56: Latin America Market Attractiveness by Product Form, 2022 to 2032

Figure 57: Latin America Market Value (US$ million) Analysis by Price Range, 2017 to 2032

Figure 58: North America Market Volume (‘000 Units) Analysis by Sales Channel, 2017 to 2032

Figure 59: North America Market Y-o-Y Growth (%) Projections, By Sales Channel, 2022 to 2032

Figure 60: North America Market Attractiveness by Sales Channel, 2022 to 2032

Figure 61: Latin America Market Value (US$ million) Analysis by Country, 2017 to 2032

Figure 62: Latin America Market Volume (‘000 Units) Analysis by Sales Channel, 2017 to 2032

Figure 63: Latin America Market Y-o-Y Growth (%) Projections, By Sales Channel, 2022 to 2032

Figure 64: Latin America Market Attractiveness by Sales Channel, 2022 to 2032

Figure 65: Europe Market Value (US$ million) Analysis by Country, 2017 to 2032

Figure 66: Europe Market Volume (‘000 Units) Analysis by Country, 2017 to 2032

Figure 67: Europe Market Y-o-Y Growth (%) Projections, By Country, 2022 to 2032

Figure 68: Europe Market Attractiveness by Country, 2022 to 2032

Figure 69: Europe Market Value (US$ million) Analysis by Product Type, 2017 to 2032

Figure 70: Europe Market Volume (‘000 Units) Analysis by Product Type, 2017 to 2032

Figure 71: Europe Market Y-o-Y Growth (%) Projections, By Product Type, 2022 to 2032

Figure 72: Europe Market Attractiveness by Product Type, 2022 to 2032

Figure 73: Europe Market Value (US$ million) Analysis by Product Form, 2017 to 2032

Figure 74: Europe Market Volume (‘000 Units) Analysis by Product Form, 2017 to 2032

Figure 75: Europe Market Y-o-Y Growth (%) Projections, By Product Form, 2022 to 2032

Figure 76: Europe Market Attractiveness by Product Form, 2022 to 2032

Figure 77: Europe Market Value (US$ million) Analysis by Price Range, 2017 to 2032

Figure 78: Europe Market Volume (‘000 Units) Analysis by Price Range, 2017 to 2032

Figure 79: Europe Market Y-o-Y Growth (%) Projections, By Price Range, 2022 to 2032

Figure 80: Europe Market Attractiveness by Price Range, 2022 to 2032

Figure 81: Europe Market Value (US$ million) Analysis by Sales Channel, 2017 to 2032

Figure 82: Europe Market Volume (‘000 Units) Analysis by Sales Channel, 2017 to 2032

Figure 83: Europe Market Y-o-Y Growth (%) Projections, By Sales Channel, 2022 to 2032

Figure 84: Europe Market Attractiveness by Sales Channel, 2022 to 2032

Figure 85: East Asia Market Value (US$ million) Analysis by Country, 2017 to 2032

Figure 86: East Asia Market Volume (‘000 Units) Analysis by Country, 2017 to 2032

Figure 87: East Asia Market Y-o-Y Growth (%) Projections, By Country, 2022 to 2032

Figure 88: East Asia Market Attractiveness by Country, 2022 to 2032

Figure 89: East Asia Market Value (US$ million) Analysis by Product Type, 2017 to 2032

Figure 90: East Asia Market Volume (‘000 Units) Analysis by Product Type, 2017 to 2032

Figure 91: East Asia Market Y-o-Y Growth (%) Projections, By Product Type, 2022 to 2032

Figure 92: East Asia Market Attractiveness by Product Type, 2022 to 2032

Figure 93: East Asia Market Value (US$ million) Analysis by Product Form, 2017 to 2032

Figure 94: East Asia Market Volume (‘000 Units) Analysis by Product Form, 2017 to 2032

Figure 95: East Asia Market Y-o-Y Growth (%) Projections, By Product Form, 2022 to 2032

Figure 96: East Asia Market Attractiveness by Product Form, 2022 to 2032

Figure 97: East Asia Market Value (US$ million) Analysis by Price Range, 2017 to 2032

Figure 98: East Asia Market Volume (‘000 Units) Analysis by Price Range, 2017 to 2032

Figure 99: East Asia Market Y-o-Y Growth (%) Projections, By Price Range, 2022 to 2032

Figure 100: East Asia Market Attractiveness by Price Range, 2022 to 2032

Figure 101: East Asia Market Value (US$ million) Analysis by Sales Channel, 2017 to 2032

Figure 102: East Asia Market Volume (‘000 Units) Analysis by Sales Channel, 2017 to 2032

Figure 103: East Asia Market Y-o-Y Growth (%) Projections, By Sales Channel, 2022 to 2032

Figure 104: East Asia Market Attractiveness by Sales Channel, 2022 to 2032

Figure 105: South Asia Market Value (US$ million) Analysis by Country, 2017 to 2032

Figure 106: South Asia Market Volume (‘000 Units) Analysis by Country, 2017 to 2032

Figure 107: South Asia Market Y-o-Y Growth (%) Projections, By Country, 2022 to 2032

Figure 108: South Asia Market Attractiveness by Country, 2022 to 2032

Figure 109: South Asia Market Value (US$ million) Analysis by Product Type, 2017 to 2032

Figure 110: South Asia Market Volume (‘000 Units) Analysis by Product Type, 2017 to 2032

Figure 111: South Asia Market Y-o-Y Growth (%) Projections, By Product Type, 2022 to 2032

Figure 112: South Asia Market Attractiveness by Product Type, 2022 to 2032

Figure 113: South Asia Market Value (US$ million) Analysis by Product Form, 2017 to 2032

Figure 114: South Asia Market Volume (‘000 Units) Analysis by Product Form, 2017 to 2032

Figure 115: South Asia Market Y-o-Y Growth (%) Projections, By Product Form, 2022 to 2032

Figure 116: South Asia Market Attractiveness by Product Form, 2022 to 2032

Figure 117: South Asia Market Value (US$ million) Analysis by Price Range, 2017 to 2032

Figure 118: South Asia Market Volume (‘000 Units) Analysis by Price Range, 2017 to 2032

Figure 119: South Asia Market Y-o-Y Growth (%) Projections, By Price Range, 2022 to 2032

Figure 120: South Asia Market Attractiveness by Price Range, 2022 to 2032

Figure 121: South Asia Market Value (US$ million) Analysis by Sales Channel, 2017 to 2032

Figure 122: South Asia Market Volume (‘000 Units) Analysis by Sales Channel, 2017 to 2032

Figure 123: South Asia Market Y-o-Y Growth (%) Projections, By Sales Channel, 2022 to 2032

Figure 124: South Asia Market Attractiveness by Sales Channel, 2022 to 2032

Figure 125: Oceania Market Value (US$ million) Analysis by Country, 2017 to 2032

Figure 126: Oceania Market Volume (‘000 Units) Analysis by Country, 2017 to 2032

Figure 127: Oceania Market Y-o-Y Growth (%) Projections, By Country, 2022 to 2032

Figure 128: Oceania Market Attractiveness by Country, 2022 to 2032

Figure 129: Oceania Market Value (US$ million) Analysis by Product Type, 2017 to 2032

Figure 130: Oceania Market Volume (‘000 Units) Analysis by Product Type, 2017 to 2032

Figure 131: Oceania Market Y-o-Y Growth (%) Projections, By Product Type, 2022 to 2032

Figure 132: Oceania Market Attractiveness by Product Type, 2022 to 2032

Figure 133: Oceania Market Value (US$ million) Analysis by Product Form, 2017 to 2032

Figure 134: Oceania Market Volume (‘000 Units) Analysis by Product Form, 2017 to 2032

Figure 135: Oceania Market Y-o-Y Growth (%) Projections, By Product Form, 2022 to 2032

Figure 136: Oceania Market Attractiveness by Product Form, 2022 to 2032

Figure 137: Oceania Market Value (US$ million) Analysis by Price Range, 2017 to 2032

Figure 138: Oceania Market Volume (‘000 Units) Analysis by Price Range, 2017 to 2032

Figure 139: Oceania Market Y-o-Y Growth (%) Projections, By Price Range, 2022 to 2032

Figure 140: Oceania Market Attractiveness by Price Range, 2022 to 2032

Figure 141: Oceania Market Value (US$ million) Analysis by Sales Channel, 2017 to 2032

Figure 142: Oceania Market Volume (‘000 Units) Analysis by Sales Channel, 2017 to 2032

Figure 143: Oceania Market Y-o-Y Growth (%) Projections, By Sales Channel, 2022 to 2032

Figure 144: Oceania Market Attractiveness by Sales Channel, 2022 to 2032

Figure 145: MEA Market Value (US$ million) Analysis by Country, 2017 to 2032

Figure 146: MEA Market Volume (‘000 Units) Analysis by Country, 2017 to 2032

Figure 147: MEA Market Y-o-Y Growth (%) Projections, By Country, 2022 to 2032

Figure 148: MEA Market Attractiveness by Country, 2022 to 2032

Figure 149: MEA Market Value (US$ million) Analysis by Product Type, 2017 to 2032

Figure 150: MEA Market Volume (‘000 Units) Analysis by Product Type, 2017 to 2032

Figure 151: MEA Market Y-o-Y Growth (%) Projections, By Product Type, 2022 to 2032

Figure 152: MEA Market Attractiveness by Product Type, 2022 to 2032

Figure 153: MEA Market Value (US$ million) Analysis by Product Form, 2017 to 2032

Figure 154: MEA Market Volume (‘000 Units) Analysis by Product Form, 2017 to 2032

Figure 155: MEA Market Y-o-Y Growth (%) Projections, By Product Form, 2022 to 2032

Figure 156: MEA Market Attractiveness by Product Form, 2022 to 2032

Figure 157: MEA Market Value (US$ million) Analysis by Price Range, 2017 to 2032

Figure 158: MEA Market Volume (‘000 Units) Analysis by Price Range, 2017 to 2032

Figure 159: MEA Market Y-o-Y Growth (%) Projections, By Price Range, 2022 to 2032

Figure 160: MEA Market Attractiveness by Price Range, 2022 to 2032

Figure 161: MEA Market Value (US$ million) Analysis by Sales Channel, 2017 to 2032

Figure 162: MEA Market Volume (‘000 Units) Analysis by Sales Channel, 2017 to 2032

Figure 163: MEA Market Y-o-Y Growth (%) Projections, By Sales Channel, 2022 to 2032

Figure 164: MEA Market Attractiveness by Sales Channel, 2022 to 2032

Frequently Asked Questions

What was the value of the global market for car air fresheners in 2022?

The global market for car air fresheners was valued at USD 2,233.7 million in 2021.

At what rate did the global market for car air fresheners grow between 2022 and 2032?

The global market for car air fresheners grew at 3.6% CAGR between 2022 and 2032.

What are the key trends driving car air freshener sales?

Growing awareness regarding environmental safety, new product launches, increasing knowledge about natural products, and rising mergers are the key trends in the market.

Who are the leading players in the global market for car air fresheners?

Leading players operating in the global market for car air fresheners are Procter & Gamble Co., Car-Freshener Corporation, California Scents, Church & Dwight Co. Inc., Godrej Household Products, Reckitt Benckiser Group Plc, Amway, Kobayashi, Liby, Houdy, Farcent, and Jiali among others.

Explore Similar Insights

Future Market Insights

Car Air Freshener Market