Carbohydrates Testing Services Market Size and Share Forecast Outlook 2025 to 2035

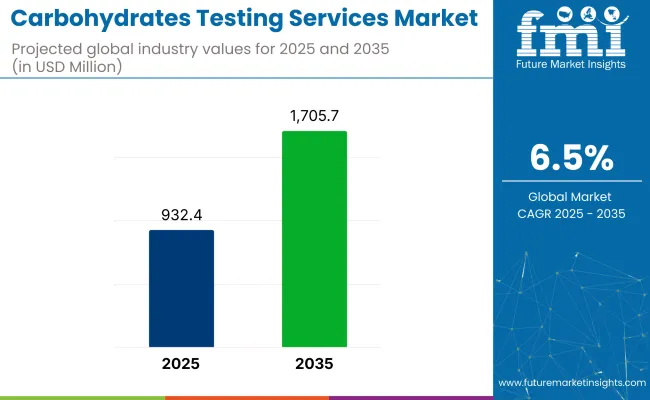
The global carbohydrates testing services market is valued at USD 932.4 million in 2025 and is slated to reach USD 1,705.7 million by 2035, reflecting a CAGR of 6.5%. This growth is being driven by the increasing demand for precise food labeling, rising health consciousness, and technological advancements in testing methods.
Quick Stats for Carbohydrates Testing Services Market

  • Market Value (2025): USD 932.4 million
  • Forecast Value (2035): USD 1,705.7 million
  • Forecast CAGR: 6.5%
  • Engagement Type Leader in 2025: Third-Party or Independent Testing and Analytics Service Providers (64% Market Share)
  • Top End User Industry: Packaged Food Manufacturers (40% Market Share in 2025)
  • Key Growth Region: India (fastest-growing market with 9.4% CAGR)

Carbohydrates Testing Services Market

Metric Value
Market Value (2025) USD 932.4 million
Market Value (2035) USD 1,705.7 million
CAGR (2025 to 2035) 6.5%

Additionally, the emergence of personalized nutrition and diet-specific food products has been boosting the need for detailed carbohydrate profiling across regions, further strengthening market expansion prospects.

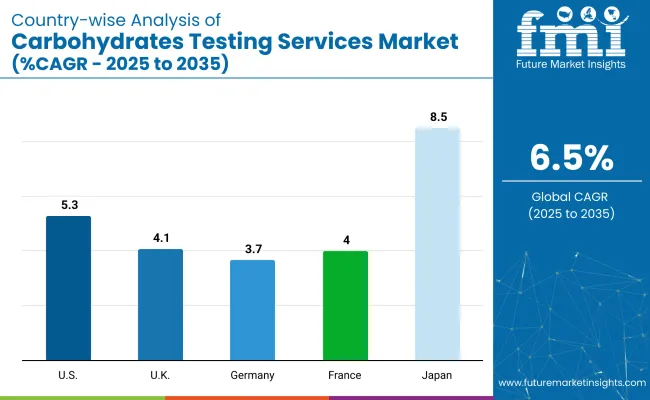
Japan is projected to record the highest growth in the carbohydrates testing services market with a CAGR of 8.5% from 2025 to 2035, driven by strong demand for low glycemic index foods and technological innovations. The USA follows with a CAGR of 5.3%, supported by strict FDA regulations and rising health consciousness.

Germany registers slower growth with a CAGR of 3.7%, driven by robust food safety standards and industry investments. Third-party or independent testing and analytics service providers will dominate the engagement type segment with a 64% market share. Packaged food manufacturers will lead the end-use industry segment with a 40% market share in 2025.

Recent innovations in carbohydrate testing services include advanced high-performance liquid chromatography, mass spectrometry, and AI-powered analyzers that improve accuracy and reduce testing time. Food manufacturers use these technologies to provide detailed carbohydrate profiling for personalized nutrition products and regulatory compliance.

Governments are enforcing stricter guidelines globally. The FDA in the USA mandates detailed carbohydrate labeling under the Nutrition Labeling and Education Act. The European Union enforces Regulation No. 1169/2011 for precise carbohydrate content labeling, while India’s FSSAI sets strict standards for food safety. These regulations drive companies to adopt advanced testing methods to ensure accuracy and maintain consumer trust.

The market forms a significant part of the food testing and food safety markets. It holds approximately a 12-15% share within the broader food testing market, driven by rising demand for accurate nutritional labeling. Within the nutritional analysis services market, carbohydrate testing accounts for nearly a 20% share, as detailed carbohydrate profiling is essential for personalized nutrition and dietary compliance.

It contributes around 5-7% to the global Testing, Inspection, and Certification (TIC) market in food applications. This segment continues to grow due to technological innovations and strict government regulations ensuring food transparency and consumer safety worldwide.

Analyzing Carbohydrates Testing Services Market by Top Investment Segments

The carbohydrates testing services market segments include carbohydrate type, technology, end-use industry, engagement type, and region. The carbohydrate type segment covers monosaccharides testing, disaccharides testing, oligosaccharides testing, and polysaccharides testing. The technology segment includes high-performance liquid chromatography (HPLC), gas chromatography (GC), enzymatic methods, spectrophotometry, and others (such as biosensors and mass spectrometry).

The end-use industry segment comprises packaged food manufacturers, beverage manufacturers, dietary supplements, animal feed manufacturers, and others (including academic research institutions and government laboratories).

The engagement type segment consists of in-house or captive testing and analytics services, and third-party or independent testing and analytics service providers. The regional segment includes North America, Latin America, Western Europe, Eastern Europe, Balkans and Baltic, Russia and Belarus, Central Asia, East Asia, South Asia and Pacific, and Middle East and Africa.

Monosaccharides Testing to Lead the Carbohydrate Type Segment with 39% Market Share in 2025

Monosaccharides testing holds the largest market share in the carbohydrates testing services market, accounting for 39% of the total revenue share.

  • This dominance is driven by the critical importance of glucose and fructose testing in nutritional labeling, glycemic index determination, and regulatory compliance for food products.
  • Food and beverage manufacturers prioritise monosaccharides testing to meet strict food safety regulations, ensure product transparency, and cater to the growing consumer demand.

High-Performance Liquid Chromatography (HPLC) to Dominate the Technology Segment with 33% Market Share in 2025

High-performance liquid chromatography (HPLC) is considered the most lucrative technology segment in the carbohydrates testing services market, holding approximately 33% market share.

  • Its dominance is driven by its unmatched precision in separating, identifying, and quantifying complex carbohydrate molecules in food products.
  • Additionally, advancements in HPLC detectors and automated systems have enhanced its efficiency, making it the preferred choice for high-throughput, reliable carbohydrate testing services globally.

Packaged Food Manufacturers to Lead the End Use Industry Segment with 40% Market Share in 2025

Packaged food manufacturers are the most lucrative segment in the carbohydrates testing services market, holding approximately 40% market share.
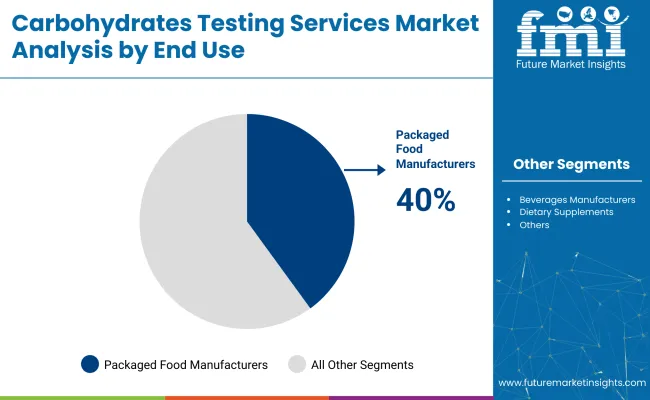
  • This is driven by their critical need for detailed carbohydrate profiling to comply with strict food labeling regulations and meet consumer demands for accurate nutritional information.
  • These manufacturers test carbohydrates to develop and market products suitable for low-carb, diabetic-friendly, and ketogenic diets.

Carbohydrates Testing Services Market End Use

Third-Party or Independent Testing and Analytics Service Providers to Dominate the Engagement Type Segment with 64% Market Share in 2025

Third-party or independent testing and analytics service providers are the most lucrative segment in the carbohydrates testing services market, holding 64% market share.
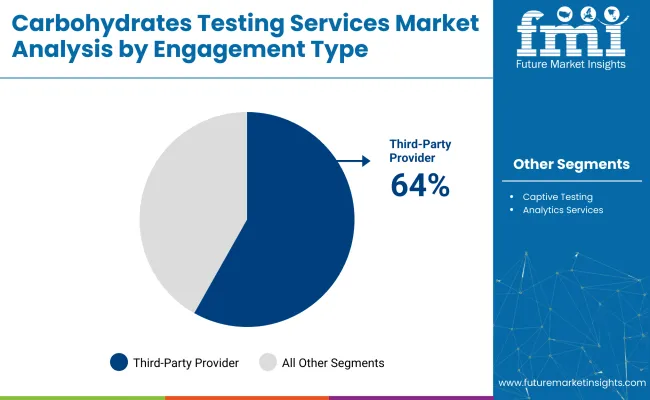
  • Their dominance is driven by food manufacturers increasingly outsourcing testing requirements to specialized labs for cost efficiency, advanced technological capabilities, and faster turnaround times.
  • These service providers offer comprehensive testing portfolios, regulatory expertise, and certifications, making them a preferred choice for companies seeking accuracy and compliance without maintaining in-house labs.

Carbohydrates Testing Services Market Engagement Type

Carbohydrates Testing Services Market Dynamics
The carbohydrates testing services market is growing steadily due to rising demand for accurate nutritional labeling and strict food safety regulations. Advanced technologies like high-performance liquid chromatography and mass spectrometry are boosting testing efficiency and precision.

Recent Trends in the Carbohydrate Testing Services Market

  • Increasing adoption of high-performance liquid chromatography for precise carbohydrate profiling.
  • Rising demand for carbohydrate testing to support personalized nutrition and low-carb diets.
  • Integration of AI and automation technologies to enhance testing speed and accuracy.
  • Growing focus on allergen testing within carbohydrate analysis for food safety compliance.

Challenges in the Carbohydrates Testing Services Market

  • High costs associated with advanced testing technologies and equipment.
  • Limited skilled professionals to operate sophisticated carbohydrate testing instruments.
  • Variability in global food safety regulations creates compliance complexities.
  • Dependence on third-party labs is causing potential delays in product launches.

Analyzing Top Countries Adopting and Expanding Carbohydrate Testing Services

Carbohydrates Testing Services Market Country Type

Japan is projected to record the highest growth in the carbohydrates testing services market with a CAGR of 8.5% from 2025 to 2035, driven by strong demand for low glycemic index foods and technological innovations. The USA follows with a CAGR of 5.3%, supported by strict FDA regulations and rising health consciousness.

France and the UK show moderate growth at 4.0% and 4.1% CAGR, respectively, driven by stringent EU regulations and demand for low-carb products. Germany registers the slowest growth among these countries with a CAGR of 3.7%, although supported by robust food safety standards and industry investments.

This report covers an in-depth analysis of 40+ countries; the five top-performing OECD Countries are highlighted below.

USA Carbohydrates Testing Services Market Analysis

The USA carbohydrates testing services market is projected to grow at a CAGR of 5.3% from 2025 to 2035.

  • Strong FDA regulations mandating precise carbohydrate labeling.
  • Rising health consciousness is driving demand for accurate profiling.
  • Advanced laboratories adopting HPLC and mass spectrometry.
  • Growth is supported by the rising prevalence of lifestyle diseases like diabetes.

Carbohydrates Testing Services Demand Analysis in the UK

Sales of carbohydrate testing services in the UK are expected to grow steadily at a CAGR of 4.1% from 2025 to 2035.

  • Strict food safety regulations under the UK and EU frameworks.
  • Rising demand for low-carb and ketogenic diet products.
  • Increased adoption of automated testing solutions by labs.
  • Strong presence of third-party testing service providers.

Carbohydrates Testing Services Demand Analysis in Germany

Sales of carbohydrate testing services in Germany are forecasted to grow at a CAGR of 3.7% from 2025 to 2035.

  • Strong regulatory framework ensuring food safety compliance.
  • Rising health consciousness is driving demand for precise testing.
  • Leading companies investing in HPLC and enzymatic testing.
  • Growth supported by the packaged food manufacturing sector.
  • Increased outsourcing to third-party testing laboratories.

Carbohydrates Testing Services Demand Analysis in France

The carbohydrates testing services revenue in France is expected to expand at a CAGR of 4.0% from 2025 to 2035.

  • Strict food labeling regulations under EU directives.
  • Rising consumer preference for nutritional transparency.
  • Investments in advanced carbohydrate testing technologies.
  • Growth driven by low-carb and diabetic-friendly food products.

Carbohydrates Testing Services Demand Analysis in Japan

Sales of carbohydrate testing services in Japan are projected to grow at a CAGR of 8.5% from 2025 to 2035.

  • Rising demand for low glycemic index and functional foods.
  • Strong investments in HPLC and biosensor technologies.
  • Technological innovation supporting rapid testing solutions.
  • The government focuses on food safety and transparency regulations.

Leading Carbohydrates Testing Services Manufacturers and Suppliers

The carbohydrates testing services market is moderately consolidated, with leading players such as Eurofins Scientific, BOC Sciences, and Alfa Chemistry commanding significant market shares. These companies compete through strategic pricing, technological innovation, global expansion, and partnerships to enhance their service offerings and market presence.

Eurofins Scientific has been focusing on expanding its global laboratory network and enhancing its digital capabilities to offer comprehensive testing services. BOC Sciences continues to provide specialized carbohydrate stability testing services, catering to the pharmaceutical and food industries. Alfa Chemistry has introduced a new food nutrition analysis service, aiming to support food manufacturers in meeting regulatory compliance and product development needs.

Recent Carbohydrate Testing Services Industry News

  • In November 2024, Eurofins DQCI and Eurofins Microbiology Laboratories launched a rapid, sensitive test for Avian Influenza A in raw milk, providing dairy farmers and processors with a vital tool to efficiently detect and manage avian flu outbreaks in the dairy supply chain.

Carbohydrates Testing Services Industry - Report Scope

Report Attributes Details
Current Total Market Size (2025) USD 932.4 million
Projected Market Size (2035) USD 1,705.7 million
CAGR (2025 to 2035) 6.5%
Base Year for Estimation 2024
Historical Period 2020 to 2024
Projections Period 2025 to 2035
Market Analysis Parameters Revenue in USD million/Volume (Metric Tons)
By Carbohydrate Type Monosaccharides, Disaccharides, Oligosaccharides, Polysaccharides
By Technology High-Performance Liquid Chromatography (HPLC), Gas Chromatography (GC), Enzymatic Methods, Spectrophotometry, Others (Biosensors-based Carbohydrate Testing, Mass spectrometry (MS), Nuclear Magnetic Resonance (NMR) Spectroscopy, and Capillary electrophoresis (CE))
By End Use Industry Packaged Food Manufacturers, Beverages Manufacturers, Dietary Supplements, Animal Feed Manufacturers, Others (Academic Research Institutions and Universities, Government Laboratories and Regulatory Bodies, Contract Research Organisations (CROs), and Ingredient Suppliers a nd Raw Material Processors)
By Engagement Type In-house/Captive Testing and Analytics Services, Third-party/Independent Testing and Analytics Service Providers
Regions Covered North America, Latin America, Western Europe, Eastern Europe, East Asia, South Asia & Pacific, Middle East & Africa
Countries Covered United States, Canada, United Kingdom, Germany, France, China, Japan, South Korea, Brazil, Australia
Key Players Reading Scientific Services Ltd, Eurofins Scientific, BOC Sciences, Alfa Chemistry, SMS LABS SERVICES, Lifeasible, Agri Technovation, Food Research Lab, Dextra Laboratories, TÜ VSÜD, Anacon Laboratories, and FARE Labs.
Additional Attributes Dollar sales by value, market share analysis by region, and country-wise analysis.

Key Segmentation

By Carbohydrate Type:

As per carbohydrate type, the industry has been categorized into Monosaccharides Testing, Disaccharides Testing, Oligosaccharides Testing, and Polysaccharides Testing.

By Technology:

Based on Technology, the industry is further categorized into High-Performance Liquid Chromatography (HPLC), Gas Chromatography (GC), Enzymatic Methods, Spectrophotometry, and Others.

By End Use Industry:

This segment is further categorized into Packaged Food Manufacturers, Beverages Manufacturers, Dietary Supplements, Animal Feed Manufacturers, and Others.

By Engagement Type:

As per engagement type, the industry is divided into House/ Captive Testing and Analytics Services, and 3rd Party/ Independent Testing and Analytics Service Providers.

By Region:

Industry analysis has been carried out in key countries of North America, Latin America, Western Europe, Eastern Europe, Balkans & Baltic, Russia & Belarus, Central Asia, East Asia, South Asia & Pacific, and the Middle East & Africa.

Table of Content

  1. Executive Summary
    • Global Market Outlook
    • Demand-side Trends
    • Supply-side Trends
    • Technology Roadmap Analysis
    • Analysis and Recommendations
  2. Market Overview
    • Market Coverage/Taxonomy
    • Market Definition/Scope/Limitations
  3. Market Background
    • Market Dynamics
      • Drivers
      • Restraints
      • Opportunity
      • Trends
    • Scenario Forecast
      • Demand in Optimistic Scenario
      • Demand in Likely Scenario
      • Demand in Conservative Scenario
    • Opportunity Map Analysis
    • Product Life Cycle Analysis
    • Supply Chain Analysis
      • Supply Side Participants and their Roles
        • Producers
        • Mid-Level Participants (Traders/ Agents/ Brokers)
        • Wholesalers and Distributors
      • Value Added and Value Created at Node in the Supply Chain
      • List of Raw Material Suppliers
      • List of Existing and Potential Buyer’s
    • Investment Feasibility Matrix
    • Value Chain Analysis
      • Profit Margin Analysis
      • Wholesalers and Distributors
      • Retailers
    • PESTLE and Porter’s Analysis
    • Regulatory Landscape
      • By Key Regions
      • By Key Countries
    • Regional Parent Market Outlook
    • Production and Consumption Statistics
    • Import and Export Statistics
  4. Global Market Analysis 2020 to 2024 and Forecast, 2025 to 2035
    • Historical Market Size Value (USD Million) & Volume (Metric Tons) Analysis, 2020 to 2024
    • Current and Future Market Size Value (USD Million) & Volume (Metric Tons) Projections, 2025 to 2035
      • Y-o-Y Growth Trend Analysis
      • Absolute $ Opportunity Analysis
  5. Global Market Pricing Analysis 2020 to 2024 and Forecast 2025 to 2035
  6. Global Market Analysis 2020 to 2024 and Forecast 2025 to 2035, By Carbohydrate Type
    • Introduction/Key Findings
    • Historical Market Size Value (USD Million) & Volume (Metric Tons) Analysis By Carbohydrate Type, 2020 to 2024
    • Current and Future Market Size Value (USD Million) & Volume (Metric Tons) Analysis and Forecast By Carbohydrate Type, 2025 to 2035
      • Monosaccharides Testing
      • Disaccharides Testing
      • Oligosaccharides Testing
      • Polysaccharides Testing
    • Y-o-Y Growth Trend Analysis By Carbohydrate Type, 2020 to 2024
    • Absolute $ Opportunity Analysis By Carbohydrate Type, 2025 to 2035
  7. Global Market Analysis 2020 to 2024 and Forecast 2025 to 2035, By Technology
    • Introduction/Key Findings
    • Historical Market Size Value (USD Million) & Volume (Metric Tons) Analysis By Technology, 2020 to 2024
    • Current and Future Market Size Value (USD Million) & Volume (Metric Tons) Analysis and Forecast By Technology, 2025 to 2035
      • High Performance Liquid Chromatography (HPLC)
      • Gas Chromatography (GC)
      • Enzymatic Methods
      • Spectrophotometry
      • Others
        • Biosensors-based Testing Methods
        • Mass spectrometry (MS)
        • Nuclear Magnetic Resonance (NMR) Spectroscopy
        • Capillary Electrophoresis (CE)
    • Y-o-Y Growth Trend Analysis By Technology, 2020 to 2024
    • Absolute $ Opportunity Analysis By Technology, 2025 to 2035
  8. Global Market Analysis 2020 to 2024 and Forecast 2025 to 2035, By Technology
    • Introduction/Key Findings
    • Historical Market Size Value (USD Million) & Volume (Metric Tons) Analysis By Technology, 2020 to 2024
    • Current and Future Market Size Value (USD Million) & Volume (Metric Tons) Analysis and Forecast By Technology, 2025 to 2035
      • High Performance Liquid Chromatography (HPLC)
      • Gas Chromatography (GC)
      • Enzymatic Methods
      • Spectrophotometry
      • Others
        • Biosensors-based Carbohydrate Testing
        • Mass Spectrometry (MS)
        • Nuclear Magnetic Resonance (NMR) Spectroscopy
        • Capillary Electrophoresis (CE)
    • Y-o-Y Growth Trend Analysis By Technology, 2020 to 2024
    • Absolute $ Opportunity Analysis By Technology, 2025 to 2035
  9. Global Market Analysis 2020 to 2024 and Forecast 2025 to 2035, By End Use Industry
    • Introduction/Key Findings
    • Historical Market Size Value (USD Million) & Volume (Metric Tons) Analysis By End Use Industry, 2020 to 2024
    • Current and Future Market Size Value (USD Million) & Volume (Metric Tons) Analysis and Forecast By End Use Industry, 2025 to 2035
      • Packaged Food Manufacturers
      • Beverages Manufacturers
      • Dietary Supplements
      • Animal Feed Manufacturers
      • Others
        • Academic and Research Institutions
        • Government Laboratories and Regulatory Bodies
        • Contract Research Organisations (CROs)
        • Ingredient Suppliers and Raw Material Processors
    • Y-o-Y Growth Trend Analysis By End Use Industry, 2020 to 2024
    • Absolute $ Opportunity Analysis By End Use Industry, 2025 to 2035
  10. Global Market Analysis 2020 to 2024 and Forecast 2025 to 2035, By Engagement Type
    • Introduction/Key Findings
    • Historical Market Size Value (USD Million) & Volume (Metric Tons) Analysis By Engagement Type, 2020 to 2024
    • Current and Future Market Size Value (USD Million) & Volume (Metric Tons) Analysis and Forecast By Engagement Type, 2025 to 2035
      • In House/ Captive Testing and Analytics Services
      • 3rd Party/ Independent Testing and Analytics Service Providers
    • Y-o-Y Growth Trend Analysis By Engagement Type, 2020 to 2024
    • Absolute $ Opportunity Analysis By Engagement Type, 2025 to 2035
  11. Global Market Analysis 2020 to 2024 and Forecast 2025 to 2035, By Region
    • Introduction
    • Historical Market Size Value (USD Million) & Volume (Metric Tons) Analysis By Region, 2020 to 2024
    • Current Market Size Value (USD Million) & Volume (Metric Tons) Analysis and Forecast By Region, 2025 to 2035
      • USA
      • Latin America
      • Western Europe
      • Eastern Europe
      • East Asia
      • South Asia & Pacific
      • Middle East and Africa
    • Market Attractiveness Analysis By Region
  12. USA Market Analysis 2020 to 2024 and Forecast 2025 to 2035, By Country
    • Historical Market Size Value (USD Million) & Volume (Metric Tons) Trend Analysis By Market Taxonomy, 2020 to 2024
    • Market Size Value (USD Million) & Volume (Metric Tons) Forecast By Market Taxonomy, 2025 to 2035
      • By Country
        • Canada
        • Brazil
        • Mexico
        • Argentina
      • By Carbohydrate Type
      • By Technology
      • By Technology
      • By End Use Industry
      • By Engagement Type
    • Market Attractiveness Analysis
      • By Country
      • By Carbohydrate Type
      • By Technology
      • By Technology
      • By End Use Industry
      • By Engagement Type
    • Key Takeaways
  13. Latin America Market Analysis 2020 to 2024 and Forecast 2025 to 2035, By Country
    • Historical Market Size Value (USD Million) & Volume (Metric Tons) Trend Analysis By Market Taxonomy, 2020 to 2024
    • Market Size Value (USD Million) & Volume (Metric Tons) Forecast By Market Taxonomy, 2025 to 2035
      • By Country
        • Brazil
        • Argentina
        • Rest of LATAM
      • By Carbohydrate Type
      • By Technology
      • By Technology
      • By End Use Industry
      • By Engagement Type
    • Market Attractiveness Analysis
      • By Country
      • By Carbohydrate Type
      • By Technology
      • By Technology
      • By End Use Industry
      • By Engagement Type
    • Key Takeaways
  14. Western Europe Market Analysis 2020 to 2024 and Forecast 2025 to 2035, By Country
    • Historical Market Size Value (USD Million) & Volume (Metric Tons) Trend Analysis By Market Taxonomy, 2020 to 2024
    • Market Size Value (USD Million) & Volume (Metric Tons) Forecast By Market Taxonomy, 2025 to 2035
      • By Country
        • Germany
        • Italy
        • France
        • UK
        • Spain
        • BENELUX
        • Nordic
        • Rest of W.Europe
      • By Carbohydrate Type
      • By Technology
      • By Technology
      • By End Use Industry
      • By Engagement Type
    • Market Attractiveness Analysis
      • By Country
      • By Carbohydrate Type
      • By Technology
      • By Technology
      • By End Use Industry
      • By Engagement Type
    • Key Takeaways
  15. Eastern Europe Market Analysis 2020 to 2024 and Forecast 2025 to 2035, By Country
    • Historical Market Size Value (USD Million) & Volume (Metric Tons) Trend Analysis By Market Taxonomy, 2020 to 2024
    • Market Size Value (USD Million) & Volume (Metric Tons) Forecast By Market Taxonomy, 2025 to 2035
      • By Country
        • Russia
        • Hungary
        • Poland
        • Balkan & Baltics
        • Rest of E. Europe
      • By Carbohydrate Type
      • By Technology
      • By Technology
      • By End Use Industry
      • By Engagement Type
    • Market Attractiveness Analysis
      • By Country
      • By Carbohydrate Type
      • By Technology
      • By Technology
      • By End Use Industry
      • By Engagement Type
    • Key Takeaways
  16. East Asia Market Analysis 2020 to 2024 and Forecast 2025 to 2035, By Country
    • Historical Market Size Value (USD Million) & Volume (Metric Tons) Trend Analysis By Market Taxonomy, 2020 to 2024
    • Market Size Value (USD Million) & Volume (Metric Tons) Forecast By Market Taxonomy, 2025 to 2035
      • By Country
        • China
        • Japan
        • South Korea
      • By Carbohydrate Type
      • By Technology
      • By Technology
      • By End Use Industry
      • By Engagement Type
    • Market Attractiveness Analysis
      • By Country
      • By Carbohydrate Type
      • By Technology
      • By Technology
      • By End Use Industry
      • By Engagement Type
    • Key Takeaways
  17. South Asia & Pacific Market Analysis 2020 to 2024 and Forecast 2025 to 2035, By Country
    • Historical Market Size Value (USD Million) & Volume (Metric Tons) Trend Analysis By Market Taxonomy, 2020 to 2024
    • Market Size Value (USD Million) & Volume (Metric Tons) Forecast By Market Taxonomy, 2025 to 2035
      • By Country
        • India
        • Australia & New Zealand
        • ASEAN
        • Rest of SAP
      • By Carbohydrate Type
      • By Technology
      • By Technology
      • By End Use Industry
      • By Engagement Type
    • Market Attractiveness Analysis
      • By Country
      • By Carbohydrate Type
      • By Technology
      • By Technology
      • By End Use Industry
      • By Engagement Type
    • Key Takeaways
  18. Middle East and Africa Market Analysis 2020 to 2024 and Forecast 2025 to 2035, By Country
    • Historical Market Size Value (USD Million) & Volume (Metric Tons) Trend Analysis By Market Taxonomy, 2020 to 2024
    • Market Size Value (USD Million) & Volume (Metric Tons) Forecast By Market Taxonomy, 2025 to 2035
      • By Country
        • GCC Countries
        • Northern Africa
        • South Africa
        • Turkiye
        • Rest of MEA
      • By Carbohydrate Type
      • By Technology
      • By Technology
      • By End Use Industry
      • By Engagement Type
    • Market Attractiveness Analysis
      • By Country
      • By Carbohydrate Type
      • By Technology
      • By Technology
      • By End Use Industry
      • By Engagement Type
    • Key Takeaways
  19. Key Countries Market Analysis
    • USA
      • Pricing Analysis
      • Market Share Analysis, 2024
        • By Carbohydrate Type
        • By Technology
        • By Technology
        • By End Use Industry
        • By Engagement Type
    • Canada
      • Pricing Analysis
      • Market Share Analysis, 2024
        • By Carbohydrate Type
        • By Technology
        • By Technology
        • By End Use Industry
        • By Engagement Type
    • Brazil
      • Pricing Analysis
      • Market Share Analysis, 2024
        • By Carbohydrate Type
        • By Technology
        • By Technology
        • By End Use Industry
        • By Engagement Type
    • Mexico
      • Pricing Analysis
      • Market Share Analysis, 2024
        • By Carbohydrate Type
        • By Technology
        • By Technology
        • By End Use Industry
        • By Engagement Type
    • Argentina
      • Pricing Analysis
      • Market Share Analysis, 2024
        • By Carbohydrate Type
        • By Technology
        • By Technology
        • By End Use Industry
        • By Engagement Type
  20. Market Structure Analysis
    • Competition Dashboard
    • Competition Benchmarking
    • Market Share Analysis of Top Players
      • By Regional
      • By Carbohydrate Type
      • By Technology
      • By Technology
      • By End Use Industry
      • By Engagement Type
  21. Competition Analysis
    • Competition Deep Dive
      • Reading Scientific Services Ltd
        • Overview
        • Product Portfolio
        • Profitability by Market Segments (Product/Age /Sales Channel/Region)
        • Sales Footprint
        • Strategy Overview
          • Marketing Strategy
          • Product Strategy
          • Channel Strategy
      • Eurofins Scientific
        • Overview
        • Product Portfolio
        • Profitability by Market Segments (Product/Age /Sales Channel/Region)
        • Sales Footprint
        • Strategy Overview
          • Marketing Strategy
          • Product Strategy
          • Channel Strategy
      • BOC Sciences
        • Overview
        • Product Portfolio
        • Profitability by Market Segments (Product/Age /Sales Channel/Region)
        • Sales Footprint
        • Strategy Overview
          • Marketing Strategy
          • Product Strategy
          • Channel Strategy
      • Alfa Chemistry
        • Overview
        • Product Portfolio
        • Profitability by Market Segments (Product/Age /Sales Channel/Region)
        • Sales Footprint
        • Strategy Overview
          • Marketing Strategy
          • Product Strategy
          • Channel Strategy
      • SMS LABS SERVICES
        • Overview
        • Product Portfolio
        • Profitability by Market Segments (Product/Age /Sales Channel/Region)
        • Sales Footprint
        • Strategy Overview
          • Marketing Strategy
          • Product Strategy
          • Channel Strategy
      • Lifeasible
        • Overview
        • Product Portfolio
        • Profitability by Market Segments (Product/Age /Sales Channel/Region)
        • Sales Footprint
        • Strategy Overview
          • Marketing Strategy
          • Product Strategy
          • Channel Strategy
      • Agri Technovation
        • Overview
        • Product Portfolio
        • Profitability by Market Segments (Product/Age /Sales Channel/Region)
        • Sales Footprint
        • Strategy Overview
          • Marketing Strategy
          • Product Strategy
          • Channel Strategy
      • Food Research Lab
        • Overview
        • Product Portfolio
        • Profitability by Market Segments (Product/Age /Sales Channel/Region)
        • Sales Footprint
        • Strategy Overview
          • Marketing Strategy
          • Product Strategy
          • Channel Strategy
      • Dextra Laboratories
        • Overview
        • Product Portfolio
        • Profitability by Market Segments (Product/Age /Sales Channel/Region)
        • Sales Footprint
        • Strategy Overview
          • Marketing Strategy
          • Product Strategy
          • Channel Strategy
      • TÜV SÜD
        • Overview
        • Product Portfolio
        • Profitability by Market Segments (Product/Age /Sales Channel/Region)
        • Sales Footprint
        • Strategy Overview
          • Marketing Strategy
          • Product Strategy
          • Channel Strategy
      • Anacon Laboratories
        • Overview
        • Product Portfolio
        • Profitability by Market Segments (Product/Age /Sales Channel/Region)
        • Sales Footprint
        • Strategy Overview
          • Marketing Strategy
          • Product Strategy
          • Channel Strategy
      • FARE Labs
        • Overview
        • Product Portfolio
        • Profitability by Market Segments (Product/Age /Sales Channel/Region)
        • Sales Footprint
        • Strategy Overview
          • Marketing Strategy
          • Product Strategy
          • Channel Strategy
  22. Assumptions & Acronyms Used
  23. Research Methodology

List of Tables

  • Table 1: Global Market Value (USD Million) Forecast by Region, 2020-2035
  • Table 2: Global Market Volume (Metric Tons) Forecast by Region, 2020-2035
  • Table 3: Global Market Value (USD Million) Forecast by Carbohydrate Type, 2020-2035
  • Table 4: Global Market Volume (Metric Tons) Forecast by Carbohydrate Type, 2020-2035
  • Table 5: Global Market Value (USD Million) Forecast by Technology, 2020-2035
  • Table 6: Global Market Volume (Metric Tons) Forecast by Technology, 2020-2035
  • Table 7: Global Market Value (USD Million) Forecast by Technology, 2020-2035
  • Table 8: Global Market Volume (Metric Tons) Forecast by Technology, 2020-2035
  • Table 9: Global Market Value (USD Million) Forecast by End Use Industry, 2020-2035
  • Table 10: Global Market Volume (Metric Tons) Forecast by End Use Industry, 2020-2035
  • Table 11: Global Market Value (USD Million) Forecast by Engagement Type, 2020-2035
  • Table 12: Global Market Volume (Metric Tons) Forecast by Engagement Type, 2020-2035
  • Table 13: USA Market Value (USD Million) Forecast by Country, 2020-2035
  • Table 14: USA Market Volume (Metric Tons) Forecast by Country, 2020-2035
  • Table 15: USA Market Value (USD Million) Forecast by Carbohydrate Type, 2020-2035
  • Table 16: USA Market Volume (Metric Tons) Forecast by Carbohydrate Type, 2020-2035
  • Table 17: USA Market Value (USD Million) Forecast by Technology, 2020-2035
  • Table 18: USA Market Volume (Metric Tons) Forecast by Technology, 2020-2035
  • Table 19: USA Market Value (USD Million) Forecast by Technology, 2020-2035
  • Table 20: USA Market Volume (Metric Tons) Forecast by Technology, 2020-2035
  • Table 21: USA Market Value (USD Million) Forecast by End Use Industry, 2020-2035
  • Table 22: USA Market Volume (Metric Tons) Forecast by End Use Industry, 2020-2035
  • Table 23: USA Market Value (USD Million) Forecast by Engagement Type, 2020-2035
  • Table 24: USA Market Volume (Metric Tons) Forecast by Engagement Type, 2020-2035
  • Table 25: Latin America Market Value (USD Million) Forecast by Country, 2020-2035
  • Table 26: Latin America Market Volume (Metric Tons) Forecast by Country, 2020-2035
  • Table 27: Latin America Market Value (USD Million) Forecast by Carbohydrate Type, 2020-2035
  • Table 28: Latin America Market Volume (Metric Tons) Forecast by Carbohydrate Type, 2020-2035
  • Table 29: Latin America Market Value (USD Million) Forecast by Technology, 2020-2035
  • Table 30: Latin America Market Volume (Metric Tons) Forecast by Technology, 2020-2035
  • Table 31: Latin America Market Value (USD Million) Forecast by Technology, 2020-2035
  • Table 32: Latin America Market Volume (Metric Tons) Forecast by Technology, 2020-2035
  • Table 33: Latin America Market Value (USD Million) Forecast by End Use Industry, 2020-2035
  • Table 34: Latin America Market Volume (Metric Tons) Forecast by End Use Industry, 2020-2035
  • Table 35: Latin America Market Value (USD Million) Forecast by Engagement Type, 2020-2035
  • Table 36: Latin America Market Volume (Metric Tons) Forecast by Engagement Type, 2020-2035
  • Table 37: Western Europe Market Value (USD Million) Forecast by Country, 2020-2035
  • Table 38: Western Europe Market Volume (Metric Tons) Forecast by Country, 2020-2035
  • Table 39: Western Europe Market Value (USD Million) Forecast by Carbohydrate Type, 2020-2035
  • Table 40: Western Europe Market Volume (Metric Tons) Forecast by Carbohydrate Type, 2020-2035
  • Table 41: Western Europe Market Value (USD Million) Forecast by Technology, 2020-2035
  • Table 42: Western Europe Market Volume (Metric Tons) Forecast by Technology, 2020-2035
  • Table 43: Western Europe Market Value (USD Million) Forecast by Technology, 2020-2035
  • Table 44: Western Europe Market Volume (Metric Tons) Forecast by Technology, 2020-2035
  • Table 45: Western Europe Market Value (USD Million) Forecast by End Use Industry, 2020-2035
  • Table 46: Western Europe Market Volume (Metric Tons) Forecast by End Use Industry, 2020-2035
  • Table 47: Western Europe Market Value (USD Million) Forecast by Engagement Type, 2020-2035
  • Table 48: Western Europe Market Volume (Metric Tons) Forecast by Engagement Type, 2020-2035
  • Table 49: Eastern Europe Market Value (USD Million) Forecast by Country, 2020-2035
  • Table 50: Eastern Europe Market Volume (Metric Tons) Forecast by Country, 2020-2035
  • Table 51: Eastern Europe Market Value (USD Million) Forecast by Carbohydrate Type, 2020-2035
  • Table 52: Eastern Europe Market Volume (Metric Tons) Forecast by Carbohydrate Type, 2020-2035
  • Table 53: Eastern Europe Market Value (USD Million) Forecast by Technology, 2020-2035
  • Table 54: Eastern Europe Market Volume (Metric Tons) Forecast by Technology, 2020-2035
  • Table 55: Eastern Europe Market Value (USD Million) Forecast by Technology, 2020-2035
  • Table 56: Eastern Europe Market Volume (Metric Tons) Forecast by Technology, 2020-2035
  • Table 57: Eastern Europe Market Value (USD Million) Forecast by End Use Industry, 2020-2035
  • Table 58: Eastern Europe Market Volume (Metric Tons) Forecast by End Use Industry, 2020-2035
  • Table 59: Eastern Europe Market Value (USD Million) Forecast by Engagement Type, 2020-2035
  • Table 60: Eastern Europe Market Volume (Metric Tons) Forecast by Engagement Type, 2020-2035
  • Table 61: East Asia Market Value (USD Million) Forecast by Country, 2020-2035
  • Table 62: East Asia Market Volume (Metric Tons) Forecast by Country, 2020-2035
  • Table 63: East Asia Market Value (USD Million) Forecast by Carbohydrate Type, 2020-2035
  • Table 64: East Asia Market Volume (Metric Tons) Forecast by Carbohydrate Type, 2020-2035
  • Table 65: East Asia Market Value (USD Million) Forecast by Technology, 2020-2035
  • Table 66: East Asia Market Volume (Metric Tons) Forecast by Technology, 2020-2035
  • Table 67: East Asia Market Value (USD Million) Forecast by Technology, 2020-2035
  • Table 68: East Asia Market Volume (Metric Tons) Forecast by Technology, 2020-2035
  • Table 69: East Asia Market Value (USD Million) Forecast by End Use Industry, 2020-2035
  • Table 70: East Asia Market Volume (Metric Tons) Forecast by End Use Industry, 2020-2035
  • Table 71: East Asia Market Value (USD Million) Forecast by Engagement Type, 2020-2035
  • Table 72: East Asia Market Volume (Metric Tons) Forecast by Engagement Type, 2020-2035
  • Table 73: South Asia & Pacific Market Value (USD Million) Forecast by Country, 2020-2035
  • Table 74: South Asia & Pacific Market Volume (Metric Tons) Forecast by Country, 2020-2035
  • Table 75: South Asia & Pacific Market Value (USD Million) Forecast by Carbohydrate Type, 2020-2035
  • Table 76: South Asia & Pacific Market Volume (Metric Tons) Forecast by Carbohydrate Type, 2020-2035
  • Table 77: South Asia & Pacific Market Value (USD Million) Forecast by Technology, 2020-2035
  • Table 78: South Asia & Pacific Market Volume (Metric Tons) Forecast by Technology, 2020-2035
  • Table 79: South Asia & Pacific Market Value (USD Million) Forecast by Technology, 2020-2035
  • Table 80: South Asia & Pacific Market Volume (Metric Tons) Forecast by Technology, 2020-2035
  • Table 81: South Asia & Pacific Market Value (USD Million) Forecast by End Use Industry, 2020-2035
  • Table 82: South Asia & Pacific Market Volume (Metric Tons) Forecast by End Use Industry, 2020-2035
  • Table 83: South Asia & Pacific Market Value (USD Million) Forecast by Engagement Type, 2020-2035
  • Table 84: South Asia & Pacific Market Volume (Metric Tons) Forecast by Engagement Type, 2020-2035
  • Table 85: Middle East and Africa Market Value (USD Million) Forecast by Country, 2020-2035
  • Table 86: Middle East and Africa Market Volume (Metric Tons) Forecast by Country, 2020-2035
  • Table 87: Middle East and Africa Market Value (USD Million) Forecast by Carbohydrate Type, 2020-2035
  • Table 88: Middle East and Africa Market Volume (Metric Tons) Forecast by Carbohydrate Type, 2020-2035
  • Table 89: Middle East and Africa Market Value (USD Million) Forecast by Technology, 2020-2035
  • Table 90: Middle East and Africa Market Volume (Metric Tons) Forecast by Technology, 2020-2035
  • Table 91: Middle East and Africa Market Value (USD Million) Forecast by Technology, 2020-2035
  • Table 92: Middle East and Africa Market Volume (Metric Tons) Forecast by Technology, 2020-2035
  • Table 93: Middle East and Africa Market Value (USD Million) Forecast by End Use Industry, 2020-2035
  • Table 94: Middle East and Africa Market Volume (Metric Tons) Forecast by End Use Industry, 2020-2035
  • Table 95: Middle East and Africa Market Value (USD Million) Forecast by Engagement Type, 2020-2035
  • Table 96: Middle East and Africa Market Volume (Metric Tons) Forecast by Engagement Type, 2020-2035

List of Figures

  • Figure 1: Global Market Volume (Metric Tons) Forecast 2020-2035
  • Figure 2: Global Market Pricing Analysis
  • Figure 3: Global Market Value (USD Million) Forecast 2020-2035
  • Figure 4: Global Market Value Share and BPS Analysis by Carbohydrate Type, 2025 and 2035
  • Figure 5: Global Market Y-o-Y Growth Comparison by Carbohydrate Type, 2025-2035
  • Figure 6: Global Market Attractiveness Analysis by Carbohydrate Type
  • Figure 7: Global Market Value Share and BPS Analysis by Technology, 2025 and 2035
  • Figure 8: Global Market Y-o-Y Growth Comparison by Technology, 2025-2035
  • Figure 9: Global Market Attractiveness Analysis by Technology
  • Figure 10: Global Market Value Share and BPS Analysis by Technology, 2025 and 2035
  • Figure 11: Global Market Y-o-Y Growth Comparison by Technology, 2025-2035
  • Figure 12: Global Market Attractiveness Analysis by Technology
  • Figure 13: Global Market Value Share and BPS Analysis by End Use Industry, 2025 and 2035
  • Figure 14: Global Market Y-o-Y Growth Comparison by End Use Industry, 2025-2035
  • Figure 15: Global Market Attractiveness Analysis by End Use Industry
  • Figure 16: Global Market Value Share and BPS Analysis by Engagement Type, 2025 and 2035
  • Figure 17: Global Market Y-o-Y Growth Comparison by Engagement Type, 2025-2035
  • Figure 18: Global Market Attractiveness Analysis by Engagement Type
  • Figure 19: Global Market Value (USD Million) Share and BPS Analysis by Region, 2025 and 2035
  • Figure 20: Global Market Y-o-Y Growth Comparison by Region, 2025-2035
  • Figure 21: Global Market Attractiveness Analysis by Region
  • Figure 22: USA Market Incremental $ Opportunity, 2025-2035
  • Figure 23: Latin America Market Incremental $ Opportunity, 2025-2035
  • Figure 24: Western Europe Market Incremental $ Opportunity, 2025-2035
  • Figure 25: Eastern Europe Market Incremental $ Opportunity, 2025-2035
  • Figure 26: East Asia Market Incremental $ Opportunity, 2025-2035
  • Figure 27: South Asia & Pacific Market Incremental $ Opportunity, 2025-2035
  • Figure 28: Middle East and Africa Market Incremental $ Opportunity, 2025-2035
  • Figure 29: USA Market Value Share and BPS Analysis by Country, 2025 and 2035
  • Figure 30: USA Market Value Share and BPS Analysis by Carbohydrate Type, 2025 and 2035
  • Figure 31: USA Market Y-o-Y Growth Comparison by Carbohydrate Type, 2025-2035
  • Figure 32: USA Market Attractiveness Analysis by Carbohydrate Type
  • Figure 33: USA Market Value Share and BPS Analysis by Technology, 2025 and 2035
  • Figure 34: USA Market Y-o-Y Growth Comparison by Technology, 2025-2035
  • Figure 35: USA Market Attractiveness Analysis by Technology
  • Figure 36: USA Market Value Share and BPS Analysis by Technology, 2025 and 2035
  • Figure 37: USA Market Y-o-Y Growth Comparison by Technology, 2025-2035
  • Figure 38: USA Market Attractiveness Analysis by Technology
  • Figure 39: USA Market Value Share and BPS Analysis by End Use Industry, 2025 and 2035
  • Figure 40: USA Market Y-o-Y Growth Comparison by End Use Industry, 2025-2035
  • Figure 41: USA Market Attractiveness Analysis by End Use Industry
  • Figure 42: USA Market Value Share and BPS Analysis by Engagement Type, 2025 and 2035
  • Figure 43: USA Market Y-o-Y Growth Comparison by Engagement Type, 2025-2035
  • Figure 44: USA Market Attractiveness Analysis by Engagement Type
  • Figure 45: Latin America Market Value Share and BPS Analysis by Country, 2025 and 2035
  • Figure 46: Latin America Market Value Share and BPS Analysis by Carbohydrate Type, 2025 and 2035
  • Figure 47: Latin America Market Y-o-Y Growth Comparison by Carbohydrate Type, 2025-2035
  • Figure 48: Latin America Market Attractiveness Analysis by Carbohydrate Type
  • Figure 49: Latin America Market Value Share and BPS Analysis by Technology, 2025 and 2035
  • Figure 50: Latin America Market Y-o-Y Growth Comparison by Technology, 2025-2035
  • Figure 51: Latin America Market Attractiveness Analysis by Technology
  • Figure 52: Latin America Market Value Share and BPS Analysis by Technology, 2025 and 2035
  • Figure 53: Latin America Market Y-o-Y Growth Comparison by Technology, 2025-2035
  • Figure 54: Latin America Market Attractiveness Analysis by Technology
  • Figure 55: Latin America Market Value Share and BPS Analysis by End Use Industry, 2025 and 2035
  • Figure 56: Latin America Market Y-o-Y Growth Comparison by End Use Industry, 2025-2035
  • Figure 57: Latin America Market Attractiveness Analysis by End Use Industry
  • Figure 58: Latin America Market Value Share and BPS Analysis by Engagement Type, 2025 and 2035
  • Figure 59: Latin America Market Y-o-Y Growth Comparison by Engagement Type, 2025-2035
  • Figure 60: Latin America Market Attractiveness Analysis by Engagement Type
  • Figure 61: Western Europe Market Value Share and BPS Analysis by Country, 2025 and 2035
  • Figure 62: Western Europe Market Value Share and BPS Analysis by Carbohydrate Type, 2025 and 2035
  • Figure 63: Western Europe Market Y-o-Y Growth Comparison by Carbohydrate Type, 2025-2035
  • Figure 64: Western Europe Market Attractiveness Analysis by Carbohydrate Type
  • Figure 65: Western Europe Market Value Share and BPS Analysis by Technology, 2025 and 2035
  • Figure 66: Western Europe Market Y-o-Y Growth Comparison by Technology, 2025-2035
  • Figure 67: Western Europe Market Attractiveness Analysis by Technology
  • Figure 68: Western Europe Market Value Share and BPS Analysis by Technology, 2025 and 2035
  • Figure 69: Western Europe Market Y-o-Y Growth Comparison by Technology, 2025-2035
  • Figure 70: Western Europe Market Attractiveness Analysis by Technology
  • Figure 71: Western Europe Market Value Share and BPS Analysis by End Use Industry, 2025 and 2035
  • Figure 72: Western Europe Market Y-o-Y Growth Comparison by End Use Industry, 2025-2035
  • Figure 73: Western Europe Market Attractiveness Analysis by End Use Industry
  • Figure 74: Western Europe Market Value Share and BPS Analysis by Engagement Type, 2025 and 2035
  • Figure 75: Western Europe Market Y-o-Y Growth Comparison by Engagement Type, 2025-2035
  • Figure 76: Western Europe Market Attractiveness Analysis by Engagement Type
  • Figure 77: Eastern Europe Market Value Share and BPS Analysis by Country, 2025 and 2035
  • Figure 78: Eastern Europe Market Value Share and BPS Analysis by Carbohydrate Type, 2025 and 2035
  • Figure 79: Eastern Europe Market Y-o-Y Growth Comparison by Carbohydrate Type, 2025-2035
  • Figure 80: Eastern Europe Market Attractiveness Analysis by Carbohydrate Type
  • Figure 81: Eastern Europe Market Value Share and BPS Analysis by Technology, 2025 and 2035
  • Figure 82: Eastern Europe Market Y-o-Y Growth Comparison by Technology, 2025-2035
  • Figure 83: Eastern Europe Market Attractiveness Analysis by Technology
  • Figure 84: Eastern Europe Market Value Share and BPS Analysis by Technology, 2025 and 2035
  • Figure 85: Eastern Europe Market Y-o-Y Growth Comparison by Technology, 2025-2035
  • Figure 86: Eastern Europe Market Attractiveness Analysis by Technology
  • Figure 87: Eastern Europe Market Value Share and BPS Analysis by End Use Industry, 2025 and 2035
  • Figure 88: Eastern Europe Market Y-o-Y Growth Comparison by End Use Industry, 2025-2035
  • Figure 89: Eastern Europe Market Attractiveness Analysis by End Use Industry
  • Figure 90: Eastern Europe Market Value Share and BPS Analysis by Engagement Type, 2025 and 2035
  • Figure 91: Eastern Europe Market Y-o-Y Growth Comparison by Engagement Type, 2025-2035
  • Figure 92: Eastern Europe Market Attractiveness Analysis by Engagement Type
  • Figure 93: East Asia Market Value Share and BPS Analysis by Country, 2025 and 2035
  • Figure 94: East Asia Market Value Share and BPS Analysis by Carbohydrate Type, 2025 and 2035
  • Figure 95: East Asia Market Y-o-Y Growth Comparison by Carbohydrate Type, 2025-2035
  • Figure 96: East Asia Market Attractiveness Analysis by Carbohydrate Type
  • Figure 97: East Asia Market Value Share and BPS Analysis by Technology, 2025 and 2035
  • Figure 98: East Asia Market Y-o-Y Growth Comparison by Technology, 2025-2035
  • Figure 99: East Asia Market Attractiveness Analysis by Technology
  • Figure 100: East Asia Market Value Share and BPS Analysis by Technology, 2025 and 2035
  • Figure 101: East Asia Market Y-o-Y Growth Comparison by Technology, 2025-2035
  • Figure 102: East Asia Market Attractiveness Analysis by Technology
  • Figure 103: East Asia Market Value Share and BPS Analysis by End Use Industry, 2025 and 2035
  • Figure 104: East Asia Market Y-o-Y Growth Comparison by End Use Industry, 2025-2035
  • Figure 105: East Asia Market Attractiveness Analysis by End Use Industry
  • Figure 106: East Asia Market Value Share and BPS Analysis by Engagement Type, 2025 and 2035
  • Figure 107: East Asia Market Y-o-Y Growth Comparison by Engagement Type, 2025-2035
  • Figure 108: East Asia Market Attractiveness Analysis by Engagement Type
  • Figure 109: South Asia & Pacific Market Value Share and BPS Analysis by Country, 2025 and 2035
  • Figure 110: South Asia & Pacific Market Value Share and BPS Analysis by Carbohydrate Type, 2025 and 2035
  • Figure 111: South Asia & Pacific Market Y-o-Y Growth Comparison by Carbohydrate Type, 2025-2035
  • Figure 112: South Asia & Pacific Market Attractiveness Analysis by Carbohydrate Type
  • Figure 113: South Asia & Pacific Market Value Share and BPS Analysis by Technology, 2025 and 2035
  • Figure 114: South Asia & Pacific Market Y-o-Y Growth Comparison by Technology, 2025-2035
  • Figure 115: South Asia & Pacific Market Attractiveness Analysis by Technology
  • Figure 116: South Asia & Pacific Market Value Share and BPS Analysis by Technology, 2025 and 2035
  • Figure 117: South Asia & Pacific Market Y-o-Y Growth Comparison by Technology, 2025-2035
  • Figure 118: South Asia & Pacific Market Attractiveness Analysis by Technology
  • Figure 119: South Asia & Pacific Market Value Share and BPS Analysis by End Use Industry, 2025 and 2035
  • Figure 120: South Asia & Pacific Market Y-o-Y Growth Comparison by End Use Industry, 2025-2035
  • Figure 121: South Asia & Pacific Market Attractiveness Analysis by End Use Industry
  • Figure 122: South Asia & Pacific Market Value Share and BPS Analysis by Engagement Type, 2025 and 2035
  • Figure 123: South Asia & Pacific Market Y-o-Y Growth Comparison by Engagement Type, 2025-2035
  • Figure 124: South Asia & Pacific Market Attractiveness Analysis by Engagement Type
  • Figure 125: Middle East and Africa Market Value Share and BPS Analysis by Country, 2025 and 2035
  • Figure 126: Middle East and Africa Market Value Share and BPS Analysis by Carbohydrate Type, 2025 and 2035
  • Figure 127: Middle East and Africa Market Y-o-Y Growth Comparison by Carbohydrate Type, 2025-2035
  • Figure 128: Middle East and Africa Market Attractiveness Analysis by Carbohydrate Type
  • Figure 129: Middle East and Africa Market Value Share and BPS Analysis by Technology, 2025 and 2035
  • Figure 130: Middle East and Africa Market Y-o-Y Growth Comparison by Technology, 2025-2035
  • Figure 131: Middle East and Africa Market Attractiveness Analysis by Technology
  • Figure 132: Middle East and Africa Market Value Share and BPS Analysis by Technology, 2025 and 2035
  • Figure 133: Middle East and Africa Market Y-o-Y Growth Comparison by Technology, 2025-2035
  • Figure 134: Middle East and Africa Market Attractiveness Analysis by Technology
  • Figure 135: Middle East and Africa Market Value Share and BPS Analysis by End Use Industry, 2025 and 2035
  • Figure 136: Middle East and Africa Market Y-o-Y Growth Comparison by End Use Industry, 2025-2035
  • Figure 137: Middle East and Africa Market Attractiveness Analysis by End Use Industry
  • Figure 138: Middle East and Africa Market Value Share and BPS Analysis by Engagement Type, 2025 and 2035
  • Figure 139: Middle East and Africa Market Y-o-Y Growth Comparison by Engagement Type, 2025-2035
  • Figure 140: Middle East and Africa Market Attractiveness Analysis by Engagement Type
  • Figure 141: Global Market - Tier Structure Analysis
  • Figure 142: Global Market - Company Share Analysis

Frequently Asked Questions

What is the current size of the carbohydrates testing services market?

The market is valued at USD 932.4 million in 2025.

What is the projected size of the carbohydrates testing services market by 2035?

It is expected to reach USD 1,705.7 million by 2035.

Which segment leads by technology in the carbohydrates testing services market?

High-performance liquid chromatography (HPLC) holds the largest share of 33% in 2025.

What is the forecasted CAGR for the carbohydrates testing services market?

The market is projected to grow at a CAGR of 6.5% from 2025 to 2035.

Which country is expected to record the fastest CAGR in the carbohydrates testing services market?

Japan is expected to record the fastest CAGR of 8.5% from 2025 to 2035 in the carbohydrates testing services market.

Explore Similar Insights

Future Market Insights

Carbohydrates Testing Services Market