Freshness Monitoring Packaging Market Size and Share Forecast Outlook 2025 to 2035

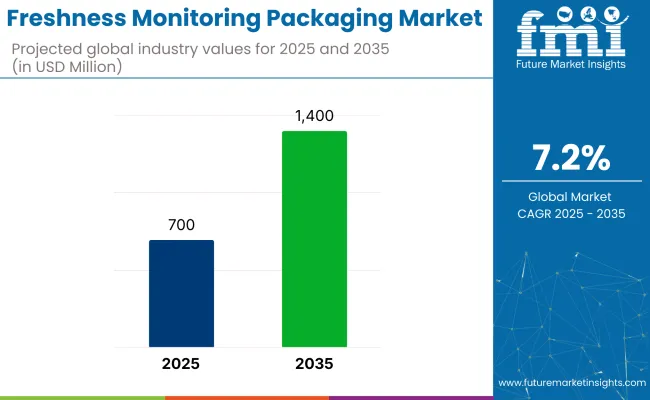
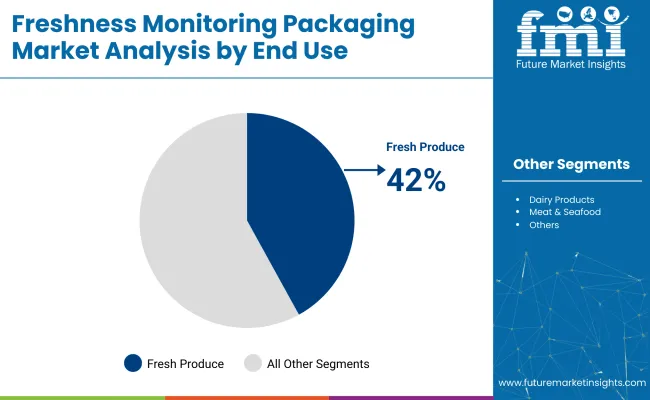
The freshness monitoring packaging market is projected to reach USD 1400 million by 2035, reflecting a 7.2% CAGR. The fresh produce segment will continue to hold the largest share among end-use categories, propelled by perishability concerns and the imperative to reduce post-harvest losses.
Quick Stats of Freshness Monitoring Packaging Market

  • Market Value (2025): USD 700 million
  • Forecast Value (2035): USD 1400 million
  • Forecast CAGR: 7.2%
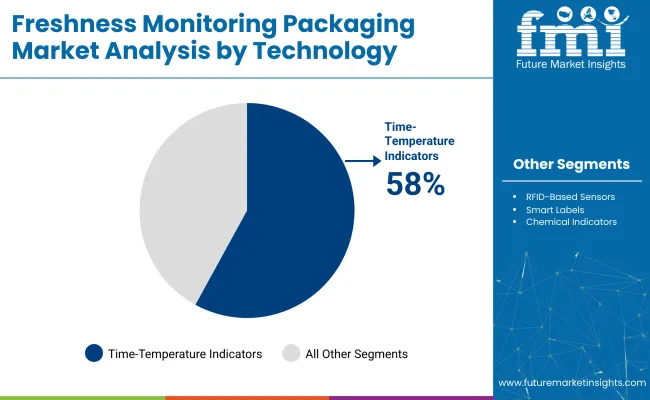
  • Leading Segment: Time-Temperature Indicators(58% share)
  • Key Growth Region: Asia Pacific (India)
  • Key Players: FreshTrackTech, 3M, Zebra Technologies Corp., Timestrip UK LTD, SpotSee, Varcode, DeltaTrak Inc., and Insignia Technologies.

Freshness Monitoring Packaging Market

The freshness monitoring packaging market has been estimated to account for 5-8% of the smart food packaging segment, highlighting its expanding role in protecting temperature-sensitive products. A 4-6% share has been assigned within the larger intelligent packaging domain, where freshness data are being integrated alongside time-temperature indicators and data-logging units. Over 50% of the freshness-indicator-label niche has been attributed to this industry, as label-embedded chemistry is being regarded as the primary use case.

Just 1-2% of the overall food packaging materials landscape has been recorded, owing to the dominance of conventional barrier and protective formats. Finally, 15-20% of food-freshness sensor deployments have been credited to packaging-integrated systems, underlining their relevance among on-package and external monitoring technologies.

Traceability will play increasingly central roles, fueling demand for next-generation chemical indicators and bio-based packaging alternatives. As industries seek to comply with evolving regulations and address consumer expectations, growth in freshness monitoring packaging is expected to remain strong throughout the period.

In April 2024, a researcher in biomaterials from Auburn University was awarded a USA patent for a novel gas-sensing coating designed for meat packaging. This innovative coating enables packaging stickers to change color progressively, indicating the freshness level of the meat inside. This development aims to reduce food waste by providing consumers and retailers with a clear visual indicator of product freshness, enhancing food safety and reducing spoilage. The technology represents a significant step forward in intelligent packaging solutions, offering a practical application of freshness monitoring in the food industry

Analyzing Freshness Monitoring Packaging by Key Investment Segments

Time-temperature indicators lead the technology segment due to reliability and integration ease; fresh produce drives end-use demand with high perishability needs; and plastic films dominate materials, offering flexibility and sensor compatibility. Continued innovation in TTI chemistry, produce-specific calibration, and green film substrates will underpin industry growth through 2035.

Time-Temperature Indicators dominate technology adoption.

Time-temperature indicators (TTIs) will continue to command 58% of the technology segment in 2025. Their affordability, ease of integration into existing packaging lines, and proven accuracy in monitoring thermal history make them indispensable for cold-chain logistics.
  • Leading suppliers like DeltaTrak Inc. and Timestrip UK are enhancing TTI formulations to offer multi-threshold and multi-use capabilities. Recent R&D focuses on miniaturization and digital readouts, enabling seamless integration with smart labels and IoT platforms.
  • As regulatory scrutiny intensifies, TTIs will remain the preferred choice for tracking temperature-sensitive goods, especially in pharmaceuticals and fresh produce. Continued innovation in TTI chemistry and manufacturing processes will preserve their industry leadership.

Freshness Monitoring Packaging Market Analysis By Technology

Fresh Produce leads end-use demand

Fresh produce is projected to account for 42% of end-use demand in 2025. High perishability and stringent quality requirements drive growers and distributors to adopt freshness monitoring solutions.
  • Companies such as 3M and Zebra Technologies are partnering with large supermarket chains to provide real-time spoilage alerts, reducing food waste and improving inventory management. Innovations in sensor calibration specific to fruits and vegetables are enhancing accuracy.
  • With global population growth and food security concerns mounting, investment in freshness monitoring for produce will remain strong. Efforts to standardize sensor-to-packaging interfaces will further accelerate adoption in this critical segment.

Freshness Monitoring Packaging Market Analysis By End Use

Plastic Films drive material innovation

Plastic films will constitute 37.2% of the material segment in 2025, balancing flexibility, barrier performance, and sensor compatibility. Manufacturers like Avery Dennison and Insignia Technologies are developing advanced multi-layer film structures that embed sensors without compromising seal integrity.

  • R&D is focused on recyclable and compostable film substrates to address Environmental responsibility. New extrusion and lamination techniques are improving sensor adhesion and signal clarity.
  • As cold-chain regulations evolve, plastic-film-based sensors will remain the primary medium for freshness monitoring. Ongoing material science breakthroughs such as nano-coatings and bio-based polymers are expected to reinforce this segment’s dominance.

Top Freshness Monitoring Packaging Market Dynamics

Government food-safety mandates and consumer demand for transparency are driving the adoption of freshness-monitoring packaging. Yet, sensor costs and integration complexity pose adoption barriers. Continued regulatory alignment, cost-reduction innovations, and turnkey solutions will be critical to industry expansion through 2035.

Rising Regulatory Pressure Is Driving Monitoring Solution Adoption

Increased regulatory scrutiny across the EU, USA, and Asia is being cited as a key driver behind the adoption of freshness-monitoring technologies. Requirements for temperature tracking and spoilage documentation are being enforced on perishable goods, prompting the integration of sensors such as RFID and time-temperature indicators. Certification standards are being aligned through collaborations between technology providers and regulatory bodies to ensure accuracy and compliance.

  • QR-coded freshness labels are being standardised to enable traceable audit records.
  • Predictive analytics tools are being embedded to analyse real-time spoilage indicators.
  • Vendor selection criteria are being updated by retailers to prioritise certified monitoring technologies.

Sensor Cost and Integration Barriers Are Being Faced by Producers

Widespread adoption of freshness-monitoring packaging is being hindered by high sensor costs and complex integration demands. Upgrades to packaging infrastructure are required to accommodate multi-layer film and embedded electronics. Smaller producers are being impacted disproportionately due to limited capital and technical resources. As a result, modular and pilot-ready systems are being offered by suppliers, though full scalability remains constrained.
  • Calibration consistency is being disrupted by fragmented global supply chains.
  • Legacy packaging equipment is being found incompatible with smart sensor modules.
  • Workforce training deficiencies are being observed in sensor deployment and data handling.

Analyzing Key Countries Manufacturing and Supplying Freshness Packaging

Country Wise Analysis Of Freshness Monitoring Packaging Market

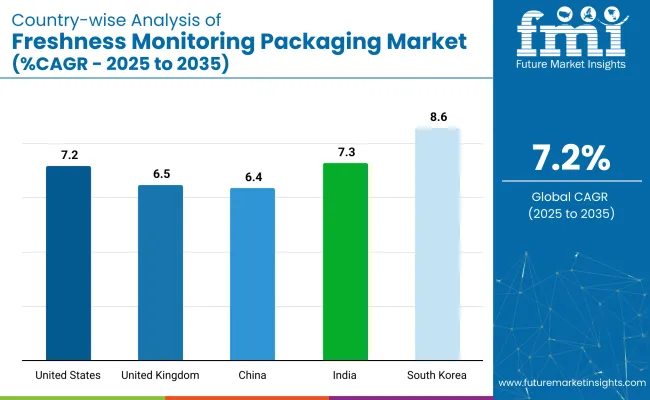
Countries CAGR (2025 to 2035)
United States 7.2%
United Kingdom 6.5%
China 6.4%
India 7.3%
South Korea 8.6%

In the Freshness Monitoring Packaging industry, group-wise performance has been marked by distinct growth trajectories. Among OECD countries, South Korea has been forecasted to achieve the highest CAGR of 8.6%, driven by the adoption of smart sensors and government-supported cold chain digitization. The United States has been projected at 7.2%, with growth driven by traceability mandates across the pharmaceutical and food sectors.

A slower pace of 6.5% has been recorded in the United Kingdom, where retrofit costs and low small-retailer uptake have limited growth. In BRICS, India’s 7.3% CAGR has been supported by refrigerated transport investment and export-focused infrastructure. China’s 6.4% CAGR has been shaped by uneven technological deployment. OECD growth has been regulation-driven, while BRICS expansion has been led by export readiness.

The report covers a detailed analysis of 40+ countries, and the top five countries have been shared as a reference.

An overview of United States freshness monitoring packaging growth

With a projected CAGR of 7.2%, the United States market will continue to expand as manufacturers and regulators push for greater supply-chain visibility and food safety. The USA leads adoption of freshness monitoring solutions, propelled by stringent FDA and USDA guidelines for perishable goods.

Retailers like Walmart and Kroger are piloting RFID-based sensors and time-temperature indicators on produce and meat, reducing spoilage and waste. Major suppliers-3M Company and Zebra Technologies-partner with food distributors to integrate smart labels into existing packaging lines. Cold-chain logistics firms invest in end-to-end traceability platforms, combining printed sensors with blockchain.

  • RFID tags are being deployed across produce and meat categories to track real-time conditions.
  • Blockchain-based traceability systems are integrated with smart packaging.
  • Collaboration between major retailers and sensor providers is accelerating commercial rollouts.

In-depth analysis of the United Kingdom packaging sensor adoption

With a 6.5% CAGR, the UK market is expected to see steady growth, driven by regulatory pressure and consumer demand. In the UK, food safety standards and waste-reduction targets are driving freshness monitoring uptake. Retail chains such as Tesco and Sainsbury’s are deploying time-temperature indicators on fresh produce labels and integrating printed sensors in dairy packaging.

Government initiatives, like the Waste and Resources Action Programme (WRAP), provide funding for pilot projects that validate sensor accuracy in real-world conditions. Suppliers such as Avery Dennison and Evigence Sensors collaborate with packaging converters to develop paper-based smart labels that align with the UK’s environmental responsibility goals.

  • Time-temperature indicators are prioritized for chilled produce and dairy segments.
  • Public-private funding pilots are validating sensor efficacy across supply chains.
  • Paper-based smart labels are developed to meet compostability and recyclability standards.

China freshness packaging market analysis and growth

With robust investment in sensor R&D and a projected CAGR of 6.4%, China is becoming a major innovation hub for freshness monitoring technologies. China’s freshness monitoring packaging industry is experiencing rapid growth as domestic food safety incidents underscore the need for better cold-chain controls.

eCcommerce giants like Alibaba and JD.com are integrating smart labels-RFID and printed sensors-into delivery packaging for meat and seafood. Local suppliers, including Keep-it Technologies and NiGK Corporation, are scaling production of chemical indicators tailored to Chinese cold-chain conditions. Government “Food Safety Law” revisions mandate traceability solutions, accelerating adoption.

  • Online grocery and meat platforms are leading in freshness sensor deployment.
  • Domestic R&D focuses on cost-effective chemical indicators for perishables.
  • Regulatory mandates are driving traceability adoption across cold-chain sectors.

India freshness packaging market analysis and growth

With a projected CAGR of 7.3%, India's adoption is driven by government infrastructure projects, rising consumer awareness, and private-sector initiatives aimed at reducing spoilage and improving food quality. The industry is growing as retailers and food producers tackle high post-harvest losses in fruits and vegetables.

Time-temperature indicators are being piloted by large cold-chain operators in Maharashtra and Punjab to validate transit conditions. Companies like DeltaTrak Inc. and Timestrip UK are forging partnerships with Indian packaging firms to localize sensor solutions. The Food Safety and Standards Authority of India (FSSAI) is exploring smart-label mandates for dairy and meat products.

  • High post-harvest losses are prompting accelerated cold-chain digitization.
  • Global sensor firms are localizing products via joint ventures and licensing.
  • Regulatory bodies are drafting smart-label policies focused on perishables.

South Korea freshness packaging market growth overview

With the highest CAGR of 8.6%, South Korea’s market is expected to experience rapid expansion, driven by tech-savvy consumers, robust e-commerce infrastructure, and stringent food safety regulations. The growth is led by consumer electronics applications in smart packaging.

Major conglomerates like Samsung and LG are developing integrated freshness sensors for edible products sold through online platforms. Time-temperature indicators and RFID tags are being tested in e-grocery deliveries to ensure product integrity. Local firms such as Insignia Technologies and LCR Hallcrest are partnering with packaging converters to embed printed sensors in plastic films that meet KFDA standards.

  • Electronics firms are embedding smart sensors in packaging for domestic e-commerce.
  • Smart films with temperature indicators are being tailored to KFDA standards.
  • High consumer tech literacy accelerates industry readiness for sensor-based packaging.

Leading Freshness Monitoring Packaging Market Suppliers

The industry is shaped by key participants such as FreshTrackTech, 3M, Zebra Technologies, SpotSee, and Timestrip UK. 3M has prioritized RFID-enabled freshness solutions, while Zebra Technologies integrates IoT to support real-time monitoring of perishables. SpotSee and Varcode develop advanced time-temperature indicators, and Timestrip UK focuses on time-sensitive labels for food and pharmaceuticals.

These firms maintain competitiveness through continued investment in R&D Emerging players are advancing smart packaging and data-driven models but face high entry barriers due to compliance demands and capital intensity. Consolidation has been observed, with established companies acquiring smaller innovators to enhance product portfolios. This evolving competitive landscape reflects a shift toward scalable, intelligent packaging systems, marked by innovation partnerships and the increasing application of sensor technologies in supply-chain visibility.

Recent Industry News

  • In October 2024, Avery Dennison announced that Kroger will deploy RFID-enabled freshness sensors across its grocery network, enabling item-level temperature tracking to reduce spoilage and optimize replenishment. This large-scale rollout represents one of the industry’s most significant adoptions of RFID for cold-chain freshness monitoring.
  • In June 2025, Timestrip UK Ltd. partnered with electronics specialists Holtronic Ltd. to launch the Timestrip Neo platform, an irreversible, multi-threshold temperature indicator designed for both blood products and perishable foods. These developments underscore a shift toward integrated sensor networks and advanced indicator chemistries, driving broader implementation of freshness-monitoring packaging in retail and healthcare sectors.

Key Players in the Freshness Monitoring Packaging Market

  • FreshTrackTech
  • 3M
  • Zebra Technologies Corp.
  • Timestrip UK LTD
  • SpotSee
  • Varcode
  • DeltaTrak Inc.
  • Insignia Technologies

Report Coverage and Scope Summary

Report Attributes Details
Current Total Industry Size (2025) USD 700 million
Projected Industry Size (2035) USD 1400 million
CAGR (2025 to 2035) 7.2%
Base Year for Estimation 2024
Historical Period 2020 to 2024
Projections Period 2025 to 2035
Quantitative Units USD billion for value and million units for volume
Technology Types Analyzed Time-Temperature Indicator, RFID-based Sensors, Smart Labels, Printed Sensors, Chemical Indicator
End-Use Segmentation Fresh Produce, Dairy Products, Meat & Seafood, Bakery Products, Processed Foods
Material Types Analyzed Plastic Films, Paper-based Packaging, Bio-based Packaging, Others
Regions Covered North America, Latin America, Western Europe, Eastern Europe, East Asia, South Asia, Middle East & Africa (MEA)
Countries Covered United States, Canada, Mexico, Brazil, Argentina, Germany, France, United Kingdom, Italy, Spain, Netherlands, China, India, Japan, South Korea, Australia, New Zealand, GCC Countries, South Africa
Key Players FreshTrackTech, 3M, Zebra Technologies Corp., Timestrip UK LTD, SpotSee, Varcode, DeltaTrak Inc., and Insignia Technologies.
Additional Attributes Dollar sales by technology, material type, and end-use, increasing demand for smart packaging solutions in food safety, growing focus on eco-friendly in packaging, regional trends in cold chain logistics, technological advancements in freshness monitoring and packaging design.

Freshness Monitoring Packaging Analyzed by Key Investment Segments

By Technology:

The industry includes time-temperature indicators, RFID-based sensors, smart labels, printed sensors, and chemical indicators.

By End Use:

The industry is segmented into fresh produce, dairy products, meat and seafood, bakery products, and processed foods.

By Material Type:

Based on material type, the industry is categorized into plastic films, paper-based packaging, bio-based packaging, and other materials.

By Region:

The industry coverage includes North America, Latin America, Western Europe, Eastern Europe, East Asia, South Asia, and the Middle East & Africa (MEA).

Table of Content

  1. Executive Summary
    • Global Market Outlook
    • Demand-side Trends
    • Supply-side Trends
    • Technology Roadmap Analysis
    • Analysis and Recommendations
  2. Market Overview
    • Market Coverage / Taxonomy
    • Market Definition / Scope / Limitations
  3. Market Background
    • Market Dynamics
      • Drivers
      • Restraints
      • Opportunity
      • Trends
    • Scenario Forecast
      • Demand in Optimistic Scenario
      • Demand in Likely Scenario
      • Demand in Conservative Scenario
    • Opportunity Map Analysis
    • Product Life Cycle Analysis
    • Supply Chain Analysis
      • Supply Side Participants and their Roles
        • Producers
        • Mid-Level Participants (Traders/ Agents/ Brokers)
        • Wholesalers and Distributors
      • Value Added and Value Created at Node in the Supply Chain
      • List of Raw Material Suppliers
      • List of Existing and Potential Buyer’s
    • Investment Feasibility Matrix
    • Value Chain Analysis
      • Profit Margin Analysis
      • Wholesalers and Distributors
      • Retailers
    • PESTLE and Porter’s Analysis
    • Regulatory Landscape
      • By Key Regions
      • By Key Countries
    • Regional Parent Market Outlook
    • Production and Consumption Statistics
    • Import and Export Statistics
  4. Global Market Analysis 2020 to 2024 and Forecast, 2025 to 2035
    • Historical Market Size Value (USD Billion) & Volume (Million Unit) Analysis, 2020 to 2024
    • Current and Future Market Size Value (USD Billion) & Volume (Million Unit) Projections, 2025 to 2035
      • Y-o-Y Growth Trend Analysis
      • Absolute $ Opportunity Analysis
  5. Global Market Pricing Analysis 2020 to 2024 and Forecast 2025 to 2035
  6. Global Market Analysis 2020 to 2024 and Forecast 2025 to 2035, By Technology
    • Introduction / Key Findings
    • Historical Market Size Value (USD Billion) & Volume (Million Unit) Analysis By Technology, 2020 to 2024
    • Current and Future Market Size Value (USD Billion) & Volume (Million Unit) Analysis and Forecast By Technology, 2025 to 2035
      • Time-Temperature Indicators
      • RFID-Based Sensors
      • Smart Labels
      • Printed Sensors
      • Chemical Indicators
    • Y-o-Y Growth Trend Analysis By Technology, 2020 to 2024
    • Absolute $ Opportunity Analysis By Technology, 2025 to 2035
  7. Global Market Analysis 2020 to 2024 and Forecast 2025 to 2035, By End Use
    • Introduction / Key Findings
    • Historical Market Size Value (USD Billion) & Volume (Million Unit) Analysis By End Use, 2020 to 2024
    • Current and Future Market Size Value (USD Billion) & Volume (Million Unit) Analysis and Forecast By End Use, 2025 to 2035
      • Fresh Produce
      • Dairy Products
      • Meat and Seafood
      • Bakery Products
      • Processed Foods
    • Y-o-Y Growth Trend Analysis By End Use, 2020 to 2024
    • Absolute $ Opportunity Analysis By End Use, 2025 to 2035
  8. Global Market Analysis 2020 to 2024 and Forecast 2025 to 2035, By Material Type
    • Introduction / Key Findings
    • Historical Market Size Value (USD Billion) & Volume (Million Unit) Analysis By Material Type, 2020 to 2024
    • Current and Future Market Size Value (USD Billion) & Volume (Million Unit) Analysis and Forecast By Material Type, 2025 to 2035
      • Plastic Films
      • Paper-Based Packaging
      • Bio-Based Packaging
      • Other Materials
    • Y-o-Y Growth Trend Analysis By Material Type, 2020 to 2024
    • Absolute $ Opportunity Analysis By Material Type, 2025 to 2035
  9. Global Market Analysis 2020 to 2024 and Forecast 2025 to 2035, By Region
    • Introduction
    • Historical Market Size Value (USD Billion) & Volume (Million Unit) Analysis By Region, 2020 to 2024
    • Current Market Size Value (USD Billion) & Volume (Million Unit) Analysis and Forecast By Region, 2025 to 2035
      • North America
      • Latin America
      • Western Europe
      • Eastern Europe
      • East Asia
      • South Asia & Pacific
      • Middle East and Africa
    • Market Attractiveness Analysis By Region
  10. North America Market Analysis 2020 to 2024 and Forecast 2025 to 2035, By Country
    • Historical Market Size Value (USD Billion) & Volume (Million Unit) Trend Analysis By Market Taxonomy, 2020 to 2024
    • Market Size Value (USD Billion) & Volume (Million Unit) Forecast By Market Taxonomy, 2025 to 2035
      • By Country
        • USA
        • Canada
        • Mexico
      • By Technology
      • By End Use
      • By Material Type
    • Market Attractiveness Analysis
      • By Country
      • By Technology
      • By End Use
      • By Material Type
    • Key Takeaways
  11. Latin America Market Analysis 2020 to 2024 and Forecast 2025 to 2035, By Country
    • Historical Market Size Value (USD Billion) & Volume (Million Unit) Trend Analysis By Market Taxonomy, 2020 to 2024
    • Market Size Value (USD Billion) & Volume (Million Unit) Forecast By Market Taxonomy, 2025 to 2035
      • By Country
        • Brazil
        • Argentina
        • Rest of LATAM
      • By Technology
      • By End Use
      • By Material Type
    • Market Attractiveness Analysis
      • By Country
      • By Technology
      • By End Use
      • By Material Type
    • Key Takeaways
  12. Western Europe Market Analysis 2020 to 2024 and Forecast 2025 to 2035, By Country
    • Historical Market Size Value (USD Billion) & Volume (Million Unit) Trend Analysis By Market Taxonomy, 2020 to 2024
    • Market Size Value (USD Billion) & Volume (Million Unit) Forecast By Market Taxonomy, 2025 to 2035
      • By Country
        • Germany
        • Italy
        • France
        • UK
        • Spain
        • BENELUX
        • Nordic
        • Rest of W.Europe
      • By Technology
      • By End Use
      • By Material Type
    • Market Attractiveness Analysis
      • By Country
      • By Technology
      • By End Use
      • By Material Type
    • Key Takeaways
  13. Eastern Europe Market Analysis 2020 to 2024 and Forecast 2025 to 2035, By Country
    • Historical Market Size Value (USD Billion) & Volume (Million Unit) Trend Analysis By Market Taxonomy, 2020 to 2024
    • Market Size Value (USD Billion) & Volume (Million Unit) Forecast By Market Taxonomy, 2025 to 2035
      • By Country
        • Russia
        • Hungary
        • Poland
        • Balkan & Baltics
        • Rest of E. Europe
      • By Technology
      • By End Use
      • By Material Type
    • Market Attractiveness Analysis
      • By Country
      • By Technology
      • By End Use
      • By Material Type
    • Key Takeaways
  14. East Asia Market Analysis 2020 to 2024 and Forecast 2025 to 2035, By Country
    • Historical Market Size Value (USD Billion) & Volume (Million Unit) Trend Analysis By Market Taxonomy, 2020 to 2024
    • Market Size Value (USD Billion) & Volume (Million Unit) Forecast By Market Taxonomy, 2025 to 2035
      • By Country
        • China
        • Japan
        • South Korea
      • By Technology
      • By End Use
      • By Material Type
    • Market Attractiveness Analysis
      • By Country
      • By Technology
      • By End Use
      • By Material Type
    • Key Takeaways
  15. South Asia & Pacific Market Analysis 2020 to 2024 and Forecast 2025 to 2035, By Country
    • Historical Market Size Value (USD Billion) & Volume (Million Unit) Trend Analysis By Market Taxonomy, 2020 to 2024
    • Market Size Value (USD Billion) & Volume (Million Unit) Forecast By Market Taxonomy, 2025 to 2035
      • By Country
        • India
        • Australia & New Zealand
        • ASEAN
        • Rest of SAP
      • By Technology
      • By End Use
      • By Material Type
    • Market Attractiveness Analysis
      • By Country
      • By Technology
      • By End Use
      • By Material Type
    • Key Takeaways
  16. Middle East and Africa Market Analysis 2020 to 2024 and Forecast 2025 to 2035, By Country
    • Historical Market Size Value (USD Billion) & Volume (Million Unit) Trend Analysis By Market Taxonomy, 2020 to 2024
    • Market Size Value (USD Billion) & Volume (Million Unit) Forecast By Market Taxonomy, 2025 to 2035
      • By Country
        • GCC Countries
        • Northern Africa
        • South Africa
        • Turkiye
        • Rest of MEA
      • By Technology
      • By End Use
      • By Material Type
    • Market Attractiveness Analysis
      • By Country
      • By Technology
      • By End Use
      • By Material Type
    • Key Takeaways
  17. Key Countries Market Analysis
    • USA
      • Pricing Analysis
      • Market Share Analysis, 2024
        • By Technology
        • By End Use
        • By Material Type
    • Canada
      • Pricing Analysis
      • Market Share Analysis, 2024
        • By Technology
        • By End Use
        • By By Material Type
    • Brazil
      • Pricing Analysis
      • Market Share Analysis, 2024
        • By Technology
        • By End Use
        • By Material Type
    • Mexico
      • Pricing Analysis
      • Market Share Analysis, 2024
        • By Technology
        • By End Use
        • By Material Type
    • Argentina
      • Pricing Analysis
      • Market Share Analysis, 2024
        • By Technology
        • By End Use
        • By Material Type
  18. Market Structure Analysis
    • Competition Dashboard
    • Competition Benchmarking
    • Market Share Analysis of Top Players
      • By Regional
      • By Technology
      • By End Use
      • By Material Type
  19. Competition Analysis
    • Competition Deep Dive
      • FreshTrackTech
        • Overview
        • Product Portfolio
        • Profitability by Market Segments (Product/Age /Sales Channel/Region)
        • Sales Footprint
        • Strategy Overview
          • Marketing Strategy
          • Product Strategy
          • Channel Strategy
      • 3M
        • Overview
        • Product Portfolio
        • Profitability by Market Segments (Product/Age /Sales Channel/Region)
        • Sales Footprint
        • Strategy Overview
          • Marketing Strategy
          • Product Strategy
          • Channel Strategy
      • Zebra Technologies Corp.
        • Overview
        • Product Portfolio
        • Profitability by Market Segments (Product/Age /Sales Channel/Region)
        • Sales Footprint
        • Strategy Overview
          • Marketing Strategy
          • Product Strategy
          • Channel Strategy
      • Timestrip UK LTD
        • Overview
        • Product Portfolio
        • Profitability by Market Segments (Product/Age /Sales Channel/Region)
        • Sales Footprint
        • Strategy Overview
          • Marketing Strategy
          • Product Strategy
          • Channel Strategy
      • SpotSee
        • Overview
        • Product Portfolio
        • Profitability by Market Segments (Product/Age /Sales Channel/Region)
        • Sales Footprint
        • Strategy Overview
          • Marketing Strategy
          • Product Strategy
          • Channel Strategy
      • Varcode
        • Overview
        • Product Portfolio
        • Profitability by Market Segments (Product/Age /Sales Channel/Region)
        • Sales Footprint
        • Strategy Overview
          • Marketing Strategy
          • Product Strategy
          • Channel Strategy
      • DeltaTrak Inc.
        • Overview
        • Product Portfolio
        • Profitability by Market Segments (Product/Age /Sales Channel/Region)
        • Sales Footprint
        • Strategy Overview
          • Marketing Strategy
          • Product Strategy
          • Channel Strategy
      • Insignia Technologies
        • Overview
        • Product Portfolio
        • Profitability by Market Segments (Product/Age /Sales Channel/Region)
        • Sales Footprint
        • Strategy Overview
          • Marketing Strategy
          • Product Strategy
          • Channel Strategy
  20. Assumptions & Acronyms Used
  21. Research Methodology

List of Tables

  • Table 1: Global Market Value (USD Billion) Forecast by Region, 2020 to 2035
  • Table 2: Global Market Volume (Million Units) Forecast by Region, 2020 to 2035
  • Table 3: Global Market Value (USD Billion) Forecast by Technology, 2020 to 2035
  • Table 4: Global Market Volume (Million Units) Forecast by Technology, 2020 to 2035
  • Table 5: Global Market Value (USD Billion) Forecast by End Use, 2020 to 2035
  • Table 6: Global Market Volume (Million Units) Forecast by End Use, 2020 to 2035
  • Table 7: Global Market Value (USD Billion) Forecast by Material Types, 2020 to 2035
  • Table 8: Global Market Volume (Million Units) Forecast by Material Types, 2020 to 2035
  • Table 9: North America Market Value (USD Billion) Forecast by Country, 2020 to 2035
  • Table 10: North America Market Volume (Million Units) Forecast by Country, 2020 to 2035
  • Table 11: North America Market Value (USD Billion) Forecast by Technology, 2020 to 2035
  • Table 12: North America Market Volume (Million Units) Forecast by Technology, 2020 to 2035
  • Table 13: North America Market Value (USD Billion) Forecast by End Use, 2020 to 2035
  • Table 14: North America Market Volume (Million Units) Forecast by End Use, 2020 to 2035
  • Table 15: North America Market Value (USD Billion) Forecast by Material Types, 2020 to 2035
  • Table 16: North America Market Volume (Million Units) Forecast by Material Types, 2020 to 2035
  • Table 17: Latin America Market Value (USD Billion) Forecast by Country, 2020 to 2035
  • Table 18: Latin America Market Volume (Million Units) Forecast by Country, 2020 to 2035
  • Table 19: Latin America Market Value (USD Billion) Forecast by Technology, 2020 to 2035
  • Table 20: Latin America Market Volume (Million Units) Forecast by Technology, 2020 to 2035
  • Table 21: Latin America Market Value (USD Billion) Forecast by End Use, 2020 to 2035
  • Table 22: Latin America Market Volume (Million Units) Forecast by End Use, 2020 to 2035
  • Table 23: Latin America Market Value (USD Billion) Forecast by Material Types, 2020 to 2035
  • Table 24: Latin America Market Volume (Million Units) Forecast by Material Types, 2020 to 2035
  • Table 25: Europe Market Value (USD Billion) Forecast by Country, 2020 to 2035
  • Table 26: Europe Market Volume (Million Units) Forecast by Country, 2020 to 2035
  • Table 27: Europe Market Value (USD Billion) Forecast by Technology, 2020 to 2035
  • Table 28: Europe Market Volume (Million Units) Forecast by Technology, 2020 to 2035
  • Table 29: Europe Market Value (USD Billion) Forecast by End Use, 2020 to 2035
  • Table 30: Europe Market Volume (Million Units) Forecast by End Use, 2020 to 2035
  • Table 31: Europe Market Value (USD Billion) Forecast by Material Types, 2020 to 2035
  • Table 32: Europe Market Volume (Million Units) Forecast by Material Types, 2020 to 2035
  • Table 33: East Asia Market Value (USD Billion) Forecast by Country, 2020 to 2035
  • Table 34: East Asia Market Volume (Million Units) Forecast by Country, 2020 to 2035
  • Table 35: East Asia Market Value (USD Billion) Forecast by Technology, 2020 to 2035
  • Table 36: East Asia Market Volume (Million Units) Forecast by Technology, 2020 to 2035
  • Table 37: East Asia Market Value (USD Billion) Forecast by End Use, 2020 to 2035
  • Table 38: East Asia Market Volume (Million Units) Forecast by End Use, 2020 to 2035
  • Table 39: East Asia Market Value (USD Billion) Forecast by Material Types, 2020 to 2035
  • Table 40: East Asia Market Volume (Million Units) Forecast by Material Types, 2020 to 2035
  • Table 41: South Asia Market Value (USD Billion) Forecast by Country, 2020 to 2035
  • Table 42: South Asia Market Volume (Million Units) Forecast by Country, 2020 to 2035
  • Table 43: South Asia Market Value (USD Billion) Forecast by Technology, 2020 to 2035
  • Table 44: South Asia Market Volume (Million Units) Forecast by Technology, 2020 to 2035
  • Table 45: South Asia Market Value (USD Billion) Forecast by End Use, 2020 to 2035
  • Table 46: South Asia Market Volume (Million Units) Forecast by End Use, 2020 to 2035
  • Table 47: South Asia Market Value (USD Billion) Forecast by Material Types, 2020 to 2035
  • Table 48: South Asia Market Volume (Million Units) Forecast by Material Types, 2020 to 2035
  • Table 49: Oceania Market Value (USD Billion) Forecast by Country, 2020 to 2035
  • Table 50: Oceania Market Volume (Million Units) Forecast by Country, 2020 to 2035
  • Table 51: Oceania Market Value (USD Billion) Forecast by Technology, 2020 to 2035
  • Table 52: Oceania Market Volume (Million Units) Forecast by Technology, 2020 to 2035
  • Table 53: Oceania Market Value (USD Billion) Forecast by End Use, 2020 to 2035
  • Table 54: Oceania Market Volume (Million Units) Forecast by End Use, 2020 to 2035
  • Table 55: Oceania Market Value (USD Billion) Forecast by Material Types, 2020 to 2035
  • Table 56: Oceania Market Volume (Million Units) Forecast by Material Types, 2020 to 2035
  • Table 57: MEA Market Value (USD Billion) Forecast by Country, 2020 to 2035
  • Table 58: MEA Market Volume (Million Units) Forecast by Country, 2020 to 2035
  • Table 59: MEA Market Value (USD Billion) Forecast by Technology, 2020 to 2035
  • Table 60: MEA Market Volume (Million Units) Forecast by Technology, 2020 to 2035
  • Table 61: MEA Market Value (USD Billion) Forecast by End Use, 2020 to 2035
  • Table 62: MEA Market Volume (Million Units) Forecast by End Use, 2020 to 2035
  • Table 63: MEA Market Value (USD Billion) Forecast by Material Types, 2020 to 2035
  • Table 64: MEA Market Volume (Million Units) Forecast by Material Types, 2020 to 2035

List of Figures

  • Figure 1: Global Market Volume (Million Units) Forecast 2020 to 2035
  • Figure 2: Global Market Pricing Analysis
  • Figure 3: Global Market Value (USD Billion) Forecast 2020 to 2035
  • Figure 4: Global Market Value Share and BPS Analysis by Technology, 2025 and 2035
  • Figure 5: Global Market Y-o-Y Growth Comparison by Technology, 2025 to 2035
  • Figure 6: Global Market Attractiveness Analysis by Technology
  • Figure 7: Global Market Value Share and BPS Analysis by End Use, 2025 and 2035
  • Figure 8: Global Market Y-o-Y Growth Comparison by End Use, 2025 to 2035
  • Figure 9: Global Market Attractiveness Analysis by End Use
  • Figure 10: Global Market Value Share and BPS Analysis by Material Types, 2025 and 2035
  • Figure 11: Global Market Y-o-Y Growth Comparison by Material Types, 2025 to 2035
  • Figure 12: Global Market Attractiveness Analysis by Material Types
  • Figure 13: Global Market Value (USD Billion) Share and BPS Analysis by Region, 2025 and 2035
  • Figure 14: Global Market Y-o-Y Growth Comparison by Region, 2025 to 2035
  • Figure 15: Global Market Attractiveness Analysis by Region
  • Figure 16: North America Market Incremental $ Opportunity, 2025 to 2035
  • Figure 17: Latin America Market Incremental $ Opportunity, 2025 to 2035
  • Figure 18: Europe Market Incremental $ Opportunity, 2025 to 2035
  • Figure 19: East Asia Market Incremental $ Opportunity, 2025 to 2035
  • Figure 20: South Asia Market Incremental $ Opportunity, 2025 to 2035
  • Figure 21: Oceania Market Incremental $ Opportunity, 2025 to 2035
  • Figure 22: MEA Market Incremental $ Opportunity, 2025 to 2035
  • Figure 23: North America Market Value Share and BPS Analysis by Country, 2025 and 2035
  • Figure 24: North America Market Value Share and BPS Analysis by Technology, 2025 and 2035
  • Figure 25: North America Market Y-o-Y Growth Comparison by Technology, 2025 to 2035
  • Figure 26: North America Market Attractiveness Analysis by Technology
  • Figure 27: North America Market Value Share and BPS Analysis by End Use, 2025 and 2035
  • Figure 28: North America Market Y-o-Y Growth Comparison by End Use, 2025 to 2035
  • Figure 29: North America Market Attractiveness Analysis by End Use
  • Figure 30: North America Market Value Share and BPS Analysis by Material Types, 2025 and 2035
  • Figure 31: North America Market Y-o-Y Growth Comparison by Material Types, 2025 to 2035
  • Figure 32: North America Market Attractiveness Analysis by Material Types
  • Figure 33: Latin America Market Value Share and BPS Analysis by Country, 2025 and 2035
  • Figure 34: Latin America Market Value Share and BPS Analysis by Technology, 2025 and 2035
  • Figure 35: Latin America Market Y-o-Y Growth Comparison by Technology, 2025 to 2035
  • Figure 36: Latin America Market Attractiveness Analysis by Technology
  • Figure 37: Latin America Market Value Share and BPS Analysis by End Use, 2025 and 2035
  • Figure 38: Latin America Market Y-o-Y Growth Comparison by End Use, 2025 to 2035
  • Figure 39: Latin America Market Attractiveness Analysis by End Use
  • Figure 40: Latin America Market Value Share and BPS Analysis by Material Types, 2025 and 2035
  • Figure 41: Latin America Market Y-o-Y Growth Comparison by Material Types, 2025 to 2035
  • Figure 42: Latin America Market Attractiveness Analysis by Material Types
  • Figure 43: Europe Market Value Share and BPS Analysis by Country, 2025 and 2035
  • Figure 44: Europe Market Value Share and BPS Analysis by Technology, 2025 and 2035
  • Figure 45: Europe Market Y-o-Y Growth Comparison by Technology, 2025 to 2035
  • Figure 46: Europe Market Attractiveness Analysis by Technology
  • Figure 47: Europe Market Value Share and BPS Analysis by End Use, 2025 and 2035
  • Figure 48: Europe Market Y-o-Y Growth Comparison by End Use, 2025 to 2035
  • Figure 49: Europe Market Attractiveness Analysis by End Use
  • Figure 50: Europe Market Value Share and BPS Analysis by Material Types, 2025 and 2035
  • Figure 51: Europe Market Y-o-Y Growth Comparison by Material Types, 2025 to 2035
  • Figure 52: Europe Market Attractiveness Analysis by Material Types
  • Figure 53: East Asia Market Value Share and BPS Analysis by Country, 2025 and 2035
  • Figure 54: East Asia Market Value Share and BPS Analysis by Technology, 2025 and 2035
  • Figure 55: East Asia Market Y-o-Y Growth Comparison by Technology, 2025 to 2035
  • Figure 56: East Asia Market Attractiveness Analysis by Technology
  • Figure 57: East Asia Market Value Share and BPS Analysis by End Use, 2025 and 2035
  • Figure 58: East Asia Market Y-o-Y Growth Comparison by End Use, 2025 to 2035
  • Figure 59: East Asia Market Attractiveness Analysis by End Use
  • Figure 60: East Asia Market Value Share and BPS Analysis by Material Types, 2025 and 2035
  • Figure 61: East Asia Market Y-o-Y Growth Comparison by Material Types, 2025 to 2035
  • Figure 62: East Asia Market Attractiveness Analysis by Material Types
  • Figure 63: South Asia Market Value Share and BPS Analysis by Country, 2025 and 2035
  • Figure 64: South Asia Market Value Share and BPS Analysis by Technology, 2025 and 2035
  • Figure 65: South Asia Market Y-o-Y Growth Comparison by Technology, 2025 to 2035
  • Figure 66: South Asia Market Attractiveness Analysis by Technology
  • Figure 67: South Asia Market Value Share and BPS Analysis by End Use, 2025 and 2035
  • Figure 68: South Asia Market Y-o-Y Growth Comparison by End Use, 2025 to 2035
  • Figure 69: South Asia Market Attractiveness Analysis by End Use
  • Figure 70: South Asia Market Value Share and BPS Analysis by Material Types, 2025 and 2035
  • Figure 71: South Asia Market Y-o-Y Growth Comparison by Material Types, 2025 to 2035
  • Figure 72: South Asia Market Attractiveness Analysis by Material Types
  • Figure 73: Oceania Market Value Share and BPS Analysis by Country, 2025 and 2035
  • Figure 74: Oceania Market Value Share and BPS Analysis by Technology, 2025 and 2035
  • Figure 75: Oceania Market Y-o-Y Growth Comparison by Technology, 2025 to 2035
  • Figure 76: Oceania Market Attractiveness Analysis by Technology
  • Figure 77: Oceania Market Value Share and BPS Analysis by End Use, 2025 and 2035
  • Figure 78: Oceania Market Y-o-Y Growth Comparison by End Use, 2025 to 2035
  • Figure 79: Oceania Market Attractiveness Analysis by End Use
  • Figure 80: Oceania Market Value Share and BPS Analysis by Material Types, 2025 and 2035
  • Figure 81: Oceania Market Y-o-Y Growth Comparison by Material Types, 2025 to 2035
  • Figure 82: Oceania Market Attractiveness Analysis by Material Types
  • Figure 83: MEA Market Value Share and BPS Analysis by Country, 2025 and 2035
  • Figure 84: MEA Market Value Share and BPS Analysis by Technology, 2025 and 2035
  • Figure 85: MEA Market Y-o-Y Growth Comparison by Technology, 2025 to 2035
  • Figure 86: MEA Market Attractiveness Analysis by Technology
  • Figure 87: MEA Market Value Share and BPS Analysis by End Use, 2025 and 2035
  • Figure 88: MEA Market Y-o-Y Growth Comparison by End Use, 2025 to 2035
  • Figure 89: MEA Market Attractiveness Analysis by End Use
  • Figure 90: MEA Market Value Share and BPS Analysis by Material Types, 2025 and 2035
  • Figure 91: MEA Market Y-o-Y Growth Comparison by Material Types, 2025 to 2035
  • Figure 92: MEA Market Attractiveness Analysis by Material Types
  • Figure 93: Global Market - Tier Structure Analysis
  • Figure 94: Global Market - Company Share Analysis

Frequently Asked Questions

What is the estimated size of the freshness monitoring packaging market in 2025?

The industry is projected to reach USD 700 million in 2025.

How large is the freshness monitoring packaging market expected to be by 2035?

The industry is forecasted to grow to USD 1400 million by 2035.

What is the CAGR of the freshness monitoring packaging market from 2025 to 2035?

The industry is anticipated to expand at a CAGR of 7.2% during 2025 to 2035.

Which technology segment leads the industry?

Time-temperature indicators dominate, capturing 58% of technology adoption.

Which end-use sector uses these solutions most?

Fresh produce leads with 42% share.

Which material is most commonly used?

Plastic films account for 37.2% of materials.

Explore Similar Insights

Future Market Insights

Freshness Monitoring Packaging Market