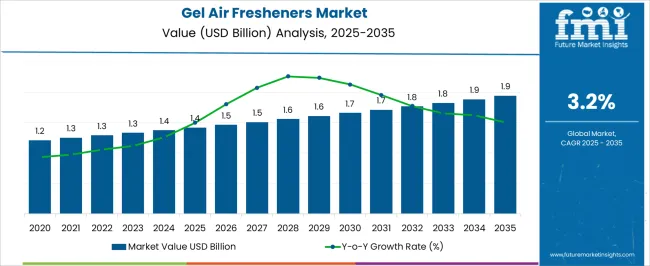
The Gel Air Fresheners Market is estimated to be valued at USD 1.4 billion in 2025 and is projected to reach USD 1.9 billion by 2035, registering a compound annual growth rate (CAGR) of 3.2% over the forecast period.

| Metric | Value |
|---|---|
| Gel Air Fresheners Market Estimated Value in (2025 E) | USD 1.4 billion |
| Gel Air Fresheners Market Forecast Value in (2035 F) | USD 1.9 billion |
| Forecast CAGR (2025 to 2035) | 3.2% |
The gel air fresheners market is witnessing consistent growth as shifting lifestyle preferences, heightened awareness of indoor air quality, and rising demand for affordable, long-lasting fragrance solutions drive adoption across diverse settings. Consumer inclination towards products that combine aesthetics, convenience, and functionality has positioned gel-based formats as a favored choice over sprays and diffusers.
The ability of gel air fresheners to offer controlled, gradual release of fragrance without electricity or frequent replacement is contributing to their sustained popularity. Future expansion is expected to be shaped by innovations in natural and allergen-free formulations, visually appealing designs, and integration of wellness attributes such as mood enhancement and stress relief.
Increasing urbanization, premiumization trends in homecare products, and growing retail penetration in developing regions are further paving the way for continued market advancement and wider consumer reach.
The market is segmented by Application, End Use, and Sales Channel and region. By Application, the market is divided into Residential, Corporate Offices, Car, Restaurants, and Others. In terms of End Use, the market is classified into Aromatherapy, Surface Care & Protection, Sprays, and Others. Based on Sales Channel, the market is segmented into Hypermarkets/Supermarkets, Convenience Stores, Multi-brand Stores, Specialty Stores, Modern Trades, and Online Retailers. Regionally, the market is classified into North America, Latin America, Western Europe, Eastern Europe, Balkan & Baltic Countries, Russia & Belarus, Central Asia, East Asia, South Asia & Pacific, and the Middle East & Africa.

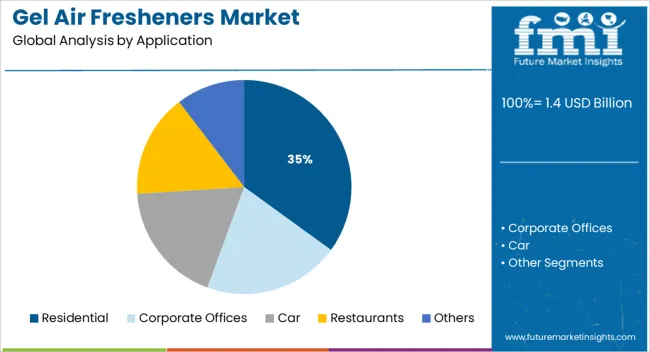
When segmented by application, the residential segment is projected to capture 35.0% of the total market revenue in 2025, emerging as the leading application segment. This dominance is being supported by the widespread use of gel air fresheners in homes for enhancing indoor ambiance, masking unpleasant odors, and creating personalized living environments.
Rising disposable incomes and a growing focus on home aesthetics have encouraged consumers to adopt premium and multipurpose fragrance products that align with their lifestyle preferences. The ease of placement, low maintenance, and visually appealing designs of gel air fresheners have contributed to their preference over other formats in residential settings.
Additionally, the trend of frequent home gatherings and a heightened focus on cleanliness and freshness post-pandemic have reinforced the strong adoption of gel air fresheners in the residential domain.

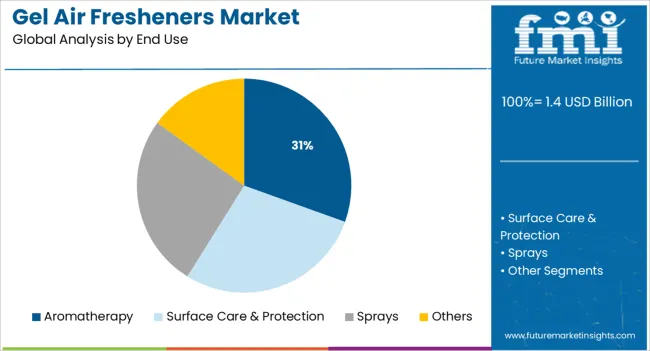
Segmenting by end use reveals that the aromatherapy segment is expected to account for 30.5% of the market revenue in 2025, positioning itself as a prominent subsegment. This growth is being driven by the rising popularity of wellness-oriented products that cater to stress relief, relaxation, and emotional well-being.
The incorporation of essential oils and natural extracts in gel formulations has enabled consumers to experience therapeutic benefits while also enjoying long-lasting fragrance. An increased understanding of the psychological effects of scents on mood and productivity has fueled demand in this segment.
Consumers are also increasingly seeking holistic homecare solutions that combine functionality with mental wellness, a trend that has aligned well with the aromatherapy-focused gel air fresheners. The convenience of use and the perception of safer, flame-free alternatives to candles or diffusers have further strengthened the segment’s share.

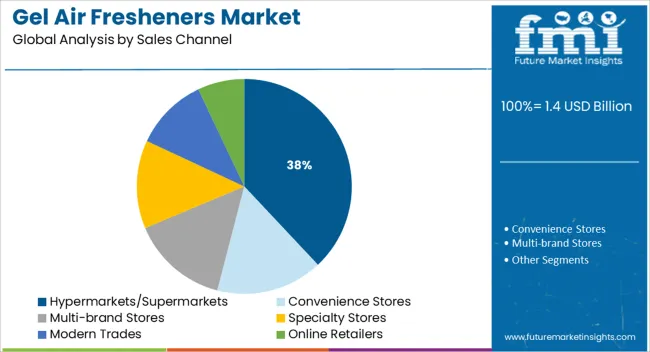
When analyzed by sales channel, hypermarkets and supermarkets are projected to hold 38.0% of the market revenue in 2025, establishing themselves as the foremost distribution channel. This leadership is being reinforced by their ability to offer consumers a wide assortment of brands, formats, and price points under one roof, enabling informed purchase decisions.
The strong physical presence of these retailers, combined with strategic shelf placement and promotional activities, has ensured high product visibility and accessibility. Consumers have also shown a preference for tactile evaluation and the immediate gratification of purchasing in-store, which aligns with the nature of gel air fresheners as a sensory product.
Bulk purchasing options and attractive discounts available in these channels have further driven volume sales. The trust and convenience associated with established retail chains have cemented hypermarkets and supermarkets as the leading avenue for gel air freshener distribution.
In the forecast period, the gel air fresheners market is predicted to grow at a rapid pace. Rising global demand for a variety of aroma products is a major factor driving the gel air fresheners market forward. The increasing importance and popularity of aromatherapy, as well as the development of new fragrances, would also help to drive the global market in the next ten years.
Key companies have increased their focus on creating novel marketing activities and advertising campaigns, which are likely to boost growth. Sales of gel air fresheners are expected to surge rapidly during the forecast period on the back of the easy availability of products and the expansion of supply & demand networks across the world.
The market, however, has faced certain challenges over the last few years. The high cost of manufacturing may stifle widespread use, posing a key challenge for the gel air freshener market.
On the other hand, the growing desire for high-end lifestyles and luxury products in everyday life can create a profitable opportunity for the widespread use of gel air fresheners. As per FMI, the global gel air fresheners market exhibited a positive growth outlook and progressed at a CAGR of around 2.8% from 2020 to 2024.
The gel air freshener market has seen tremendous growth and has been steadily progressing for years, but the industry is primarily associated with environmental and social issues such as poor packaging practices, as well as waste generated during the production of such products.
Eco-friendly and sustainable packaging solutions have evolved in response to the industry's current environmental concerns, with assistance from government and private groups. Consumers are nowadays becoming more ecologically concerned, which is driving the demand for gel air fresheners with sustainable packaging.
Environmental sustainability is becoming immensely popular among well-known firms. Several new business participants, as well as established brands, are taking the lead by launching their own websites. Environmental and sustainability adaptation methods put forward by manufacturers are propelling the gel air freshener industry forward.
Surging Inclination towards Luxurious Lifestyles in the USA to Propel Demand for Gel Ball Air Fresheners
With increasing disposable income, the need for luxury has rapidly surged in the USA Air fresheners are used extensively in the country due to the rising desire for luxurious lifestyles and high-end goods.
As more people become aware of natural air fresheners, the demand is anticipated to increase in the country. Additionally, throughout the course of the projection period, the market is expected to showcase a growth rate of around 2.7%.
Further, companies across the USA are working on product differentiations due to rising competition. Some of them are developing gel air fresheners based on climatic conditions. Increased demand for gel air fresheners in both residential and commercial sectors is another factor that manufacturers are concentrating on in order to improve their product portfolios.
Increasing Demand for Essential Oils in China to Fuel the Need for Perfume Gels
Widespread consumer awareness of gel air fresheners and modifications in terms of product formulations are two key factors predicted to support healthy growth in the China market. Manufacturers in the country are increasingly experimenting and offering fresheners with various scents to cater to fragmented demand from different consumer demographics.
Fulfillment of their demand is appealing to customers to look for bulk products in the country. Sales of essential oils with various scents are at an all-time high, which suggests that China-based companies will keep expanding their range of products in the next ten years.
Due to consumer's willingness to pay more for aesthetically pleasing aromas, manufacturers of gel air fresheners in China are expanding their product ranges. It is thus anticipated to exhibit a growth rate of around 6.5% CAGR during the forecast period, mentions FMI.
Launch of Unique Room Freshener Gels by Indian Manufacturers to Bode Well by 2035
In the South Asia region, India has become a promising market for gel air fresheners. The market is expected to grow with a CAGR value of ~9.8% during the assessment period. People are becoming more mindful of their health and fitness in the country. However, by introducing new products, vendors can not only grow their sales and market share but also draw in new clients by becoming noticeable in the marketplace.
It is anticipated that the increasing number of brands releasing various types of air freshener products would boost their sales and propel the development of the targeted market across India. For instance, in 2025, Dabur launched Odonil Gel Pocket, which is a gel-based air freshener infused with essential oils.
Demand for Room Freshener Gels to Skyrocket as Consumers Realize the Significance of a Pleasant-smelling Home
The residential segment is anticipated to dominate the gel air fresheners market during the projected time frame. The increasing realization among consumers about the importance of a pleasant-smelling home not only for special occasions and holiday gatherings but all throughout the year is expected to aid growth.
Favorable demographics and growing awareness about health & hygiene are also expected to drive sales in the residential segment. As per FMI, the segment is anticipated to grow at a steady CAGR of ~3.7% over the projected period. High disposable income and increasing willingness to spend more money on high-end goods are attributed to this growth.
Increasing Demand for Healing Therapies to Propel Sales of Gel Air Deodorizers
Based on end use, the aromatherapy category is estimated to generate the lion’s share in the global market. As per FMI, the category is projected to showcase a CAGR of around ~6.3% during the forecast period.
Aromatherapy aims to find a balance between a strong reputation and competitive pricing. The idea is to appeal to the mass market and thus gain greater penetration, rather than targeting clients who want to spend a lot of money on premium products.
A growing inclination towards natural remedies from manufactured pharmaceutical products is set to aid sales. Key market players are also taking various initiatives to come up with state-of-the-art products as consumers are shifting towards natural healing therapies.
Consumers Prefer Buying Air Freshener Gel for Rooms through Online Retailers
In terms of sales channels, online retailers are estimated to account for 35.5% of the overall share in the gel air fresheners industry. It is projected to expand gradually at a CAGR of 2.8% throughout the evaluation period.
The market for gel air fresheners is currently dominated by store-based retailing, which includes modern trade, departmental stores, and specialized shops. However, with increased internet usage, it is anticipated that sales through online shopping channels will grow significantly.
One such factor pointing to the expansion of online sales is the quick creation of specialty lifestyle and luxury product retailers. In addition, shifting trends in terms of customer purchasing preferences towards the cost ranges of online retailers is another sign that would drive future expansion of online sales.
Key tactics employed by participants in the gel air freshener industry are product innovations, business expansions, and mergers & acquisitions. Sustained competitive advantage through innovation is the primary criterion for generating high market share among large-scale companies worldwide. To sustain their market positions, businesses are increasing their marketing and research & development (R&D) activities, as well as broadening their distribution networks.
For instance:
| Attribute | Details |
|---|---|
| Estimated Market Size (2025) | USD 1.4 billion |
| Projected Market Valuation (2035) | USD 1.9 billion |
| Value-based CAGR (2025 to 2035) | 3.2% |
| Forecast Period | 2025 to 2035 |
| Historical Data Available for | 2020 to 2024 |
| Market Analysis | Value (USD Million) |
| Key Regions Covered | North America; Latin America; Europe; East Asia; South Asia; Oceania & MEA |
| Key Countries Covered | United States of America, Canada, Brazil, Mexico, Germany, The UK, France, Spain, Italy, Russia, Benelux, South Africa, Northern Africa GCC Countries, China, Japan, South Korea, India, Thailand, Malaysia, Indonesia, Australia & New Zealand. |
| Key Segments Covered | Application, End Use, Sales Channel, and Region |
| Key Companies Profiled | Dyna Fresh; Sniff Drive; Dclario Technologies India Pvt Ltd.; AEROZEL; Neuchatel Chemie Specialties; Aromate; P & P PRODUCTS; Power Line Packaging, Inc.; Atlantic Paper & Supply; Larsen packaging products Inc.; GT Midwest; Menshen Packaging USA, Inc.; Alpha Lion Distributors Inc.; Corporate Images, Inc.; Arizona Natural Resources, Inc.; Others |
| Report Coverage | Market Forecast, Company Share Analysis, Competition Intelligence, Drivers, Restraints, Opportunities and Threats Analysis, Market Dynamics and Challenges, and Strategic Growth Initiatives |
The global gel air fresheners market is estimated to be valued at USD 1.4 billion in 2025.
The market size for the gel air fresheners market is projected to reach USD 1.9 billion by 2035.
The gel air fresheners market is expected to grow at a 3.2% CAGR between 2025 and 2035.
The key product types in gel air fresheners market are residential, corporate offices, car, restaurants and others.
In terms of end use, aromatherapy segment to command 30.5% share in the gel air fresheners market in 2025.


Full Research Suite comprises of:
Market outlook & trends analysis
Interviews & case studies
Strategic recommendations
Vendor profiles & capabilities analysis
5-year forecasts
8 regions and 60+ country-level data splits
Market segment data splits
12 months of continuous data updates
DELIVERED AS:
PDF EXCEL ONLINE
Gelatin Films Market Size and Share Forecast Outlook 2025 to 2035
Gel Stent Market Size and Share Forecast Outlook 2025 to 2035
Gel-Type Strong Acid Cation Exchange Resin Market Size and Share Forecast Outlook 2025 to 2035
Gel Dryer Market Size and Share Forecast Outlook 2025 to 2035
Gel Warmers Market Size and Share Forecast Outlook 2025 to 2035
Gel Imaging Documentation Market Size and Share Forecast Outlook 2025 to 2035
Gellan Gum Market Analysis - Size, Share, and Forecast Outlook 2025 to 2035
Gel Packs Market Size and Share Forecast Outlook 2025 to 2035
Gelatin Substitutes Market Analysis - Size, Share, & Forecast Outlook 2025 to 2035
Gelatin Market Trends - Food, Pharma & Nutritional Growth 2025 to 2035
Gel Implants Market Analysis - Trends, Share & Forecast 2025 to 2035
Gelling Agent Market Insights – Texture & Food Innovation 2025 to 2035
Gelatin Hydrolysates Market
Gel Column Agglutination Test System Market
Sol-Gel Based Skin Treatments Market Size and Share Forecast Outlook 2025 to 2035
Pyrogel Insulation Market Size and Share Forecast Outlook 2025 to 2035
Aerogel Insulation Market Size and Share Forecast Outlook 2025 to 2035
Softgel Capsules Market Overview - Growth & Forecast 2025 to 2035
Aerogel Market Size, Growth, and Forecast for 2025 to 2035
Aerogel Film Market Analysis - Size, Share, and Forecast Outlook 2025 to 2035

Thank you!
You will receive an email from our Business Development Manager. Please be sure to check your SPAM/JUNK folder too.
Chat With
MaRIA