Aerogel Market Size and Share Forecast Outlook 2025 to 2035

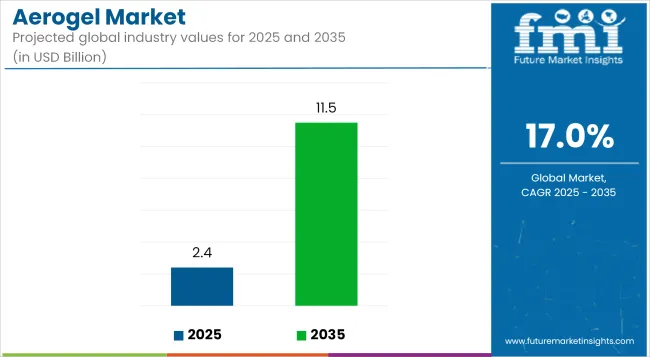
The global aerogel market is projected to grow from USD 2.4 billion in 2025 to USD 11.5 billion by 2035, reflecting a CAGR of 17.0% during the forecast period. Market expansion is being driven by stringent energy-efficiency regulations in construction, increased deployment of thermal management materials in electric vehicles, and widespread adoption in oil and gas insulation systems.
Quick Stats for Aerogel Market

  • Industry Value (2025): USD 2.4 billion
  • Forecast Value (2035): USD 11.5 billion
  • Forecast CAGR: 17.0%
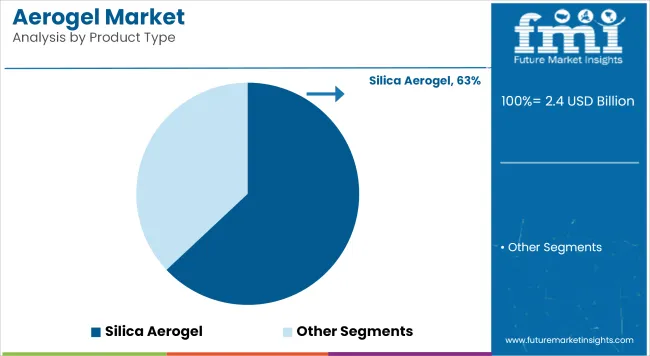
  • Leading Segment in 2025: Silica Aerogels (63% share)
  • Key Growth Region: Asia-Pacific (especially China and India)
  • Top Key Players: Aspen Aerogels, Cabot Corporation, Armacell International S.A., Alkegen, IBIH Advanced Materials Co., Ltd.

Aerogel Market Industry Value Analysis

Silica-based aerogels are being preferred due to their ultra-low thermal conductivity and inert chemical profile. Blanket-form aerogels, which enable easy handling and conformability on irregular surfaces, are expected to account for nearly 43% of global sales in 2025. The construction sector is being identified as the dominant end-use industry, where aerogel-based insulation materials are being used for retrofitting building envelopes, green roofs, and passive wall systems.

In energy infrastructure, aerogels are being adopted for subsea pipeline wraps and LNG insulation jackets. Performance benefits such as reduced heat loss and prevention of hydrate formation are driving usage across upstream and midstream installations. These attributes are being valued in high-value assets such as deepwater pipelines and cryogenic storage units.

In electric vehicles, thin-layer aerogel spacers are being integrated into battery modules to minimize thermal propagation risk while supporting compact pack architectures. Aerospace projects are continuing to validate aerogels in fuel tank linings, reentry systems, and debris protection, reinforcing their relevance in extreme temperature and vacuum conditions.

Manufacturers are moving toward ambient-pressure drying and automated roll-to-roll manufacturing to achieve cost reductions and scale-up. Leading producers such as Aspen Aerogels, Cabot Corporation, and Armacell are undertaking capacity expansion and process debottlenecking initiatives to reduce unit production costs by as much as 25% within five years.

Rapid capacity addition in China is being enabled by vertically integrated supply chains and favorable energy pricing, while European manufacturers are focusing on low-carbon alternatives through the use of bio-based feedstocks. Demand visibility is expected to be reinforced through long-term offtake agreements with EV manufacturers, EPC contractors, and government-backed infrastructure programs.
Analyzing Aerogel Market by Top Investment Segments

Silica aerogels are projected to dominate product demand due to their widespread use in insulation, lightweight composites, and thermal barriers

Aerogel Market Analysis By Product Type

Silica aerogels are estimated to account for approximately 63% of the global aerogel market share in 2025 and are projected to grow at a CAGR of 17.2% through 2035. These aerogels offer extremely low thermal conductivity, high porosity, and minimal density, making them highly effective in insulation applications across construction, oil and gas pipelines, and aerospace systems.

Silica-based materials are also preferred for their non-combustibility and compatibility with coatings and laminates. The market is experiencing a surge in demand for flexible silica aerogel blankets and panels as alternatives to traditional insulation, particularly in energy efficiency retrofits and high-performance building envelopes.
Blanket form aerogels are expected to lead volume demand due to ease of application, thermal stability, and suitability for large-surface insulation

Aerogel Market Analysis By Form

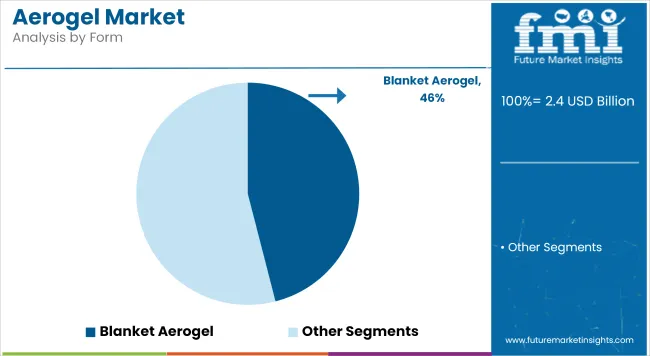
Blanket aerogels are projected to hold approximately 46% of the global aerogel market share in 2025 and are expected to grow at a CAGR of 17.3% through 2035. These flexible, fiber-reinforced mats are widely used in industrial insulation for pipes, vessels, and equipment exposed to extreme temperatures.

Their ultra-thin profile allows for reduced insulation thickness without compromising thermal performance, a critical factor in space-constrained applications such as aircraft, automotive components, and offshore oil platforms. Major manufacturers are also developing hydrophobic variants to improve moisture resistance and durability. As industries prioritize energy conservation and lightweight material integration, blanket-form aerogels are expected to remain central to market expansion across both infrastructure and transportation sectors.
Aerogels Market Analysis by Top Countries

Aerogel Market Cagr Analysis By Country

What is the forecast for the United States aerogel market?

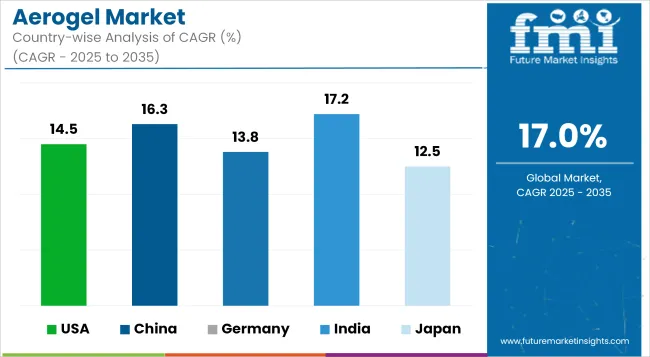
In the United States aerogel market demand is projected to climb at about a 14.5% CAGR through 2035, as federal tax incentives and stricter state-level energy codes accelerate deep-retrofit activity in offices, hospitals, and data centers. National laboratories are likely to validate aerogel-vacuum panels in next-generation heat pump trials, thereby broadening specification confidence.

Aerospace programmes-NASA’s Artemis cargo modules and commercial launch vehicles- are expected to keep procuring cryogenic tanks and ablative shields, anchoring a high-margin niche. Refinery and LNG operators are poised to adopt aerogel wraps that cut pipe heat loss by up to 40%, extending maintenance cycles and supporting steady aftermarket revenues.

How fast is China’s aerogel market expected to expand?

China is projected to post roughly 16.3% CAGR, buoyed by the government’s dual-carbon roadmap, which tightens insulation norms in megacity high-rises and industrial parks. Provincial subsidies for ultra-low-energy buildings are likely to spur blanket and panel uptake in the Yangtze River Delta retrofit districts.

Domestic EV makers are expected to embed thin aerogel spacers in high-nickel battery packs to mitigate the risk of thermal runaway, creating a sizable demand for silica grades. Concurrently, the rapid build-out of coastal LNG terminals and long-distance cryogenic pipelines is set to sustain demand for ambient-pressure-dried rolls, which simplify on-site installation.

What is the outlook for Germany’s aerogel market?

Germany's aerogel industry is forecast to advance at a rate of approximately 13.8% CAGR as automotive OEMs pursue lightweighting and battery safety ahead of the Euro 7 emissions rules. Aerogel fire-protection mats are likely to be specified for pouch-cell modules, while hydrogen fuel-cell buses may adopt carbon-aerogel insulation around cryo-compressed tanks.

Building-renovation grants under the BEG programme are expected to favour slender aerogel plasters for heritage façades where bulky mineral wool is impractical. Chemical-cluster operators along the Rhine are set to line super-heated steam pipes with composite blankets, trimming energy loss and helping plants meet Scope 1 decarbonisation targets.

How quickly will India’s aerogel market grow?

India is projected to register the fastest national CAGR, around 17.2%, as Smart-City missions and new energy-conservation codes mandate higher R-values in residential towers and metro-station envelopes. Flagship green-hydrogen hubs and LNG import terminals on the western coast are likely to specify aerogel pipe wraps and tank-base pads, driving large industrial orders.

Domestic two-wheeler makers are expected to roll out battery-electric scooters with aerogel liners that meet the new AIS 156 thermal safety norms, thereby widening mobility penetration. Production-linked incentive schemes for advanced materials could further lower unit costs, boosting local manufacturing scale-up by mid-decade.

What is the projected growth rate for Japan’s aerogel market?

Japan’s aerogel demand is expected to rise at about 12.5% CAGR through 2035 as an ageing building stock undergoes energy-retrofit cycles under the ZEH+ initiative and municipal resilience plans. Railway operators are likely to install aerogel-insulated carriages to improve passenger comfort while trimming HVAC electricity draw on long-distance routes.

JAXA’s upcoming launch systems and lunar landers are projected to require ultra-light cryogenic insulation, sustaining a specialised aerospace stream. Electronics manufacturers are poised to test polymer-aerogel substrates in high-speed 6G base-station modules, signaling how thermal-management advances could ripple through Japan’s telecom supply chain.

Competition Outlook

The aerogel materials market is witnessing significant developments as companies increasingly focus on meeting the growing demand for high-performance thermal insulation and fire protection solutions across various industries.

Producers are investing in expanding regional production capacities, such as new manufacturing plants in emerging markets, to address the rising need for energy-efficient materials in sectors like oil and gas, LNG infrastructure, and industrial piping. As electric vehicle (EV) adoption accelerates, the market is also seeing a surge in demand for specialized aerogels, such as those used for battery fire protection in EVs.

Recent Devemopments

  • In April 2024, Armacell was reported to have opened a new aerogel insulation manufacturing plant in India and launched its next-generation aerogel product line. The facility was established to meet growing demand for high-performance thermal insulation in Asia-Pacific markets. The new aerogel materials were designed for superior flexibility, thermal efficiency, and ease of installation, targeting applications in oil and gas, LNG infrastructure, and industrial piping. The investment was positioned as a strategic move to expand regional production capacity and strengthen Armacell’s presence in energy-efficient materials.
  • In September 2024, Irving-based Alkegen was reported to have commenced full-scale production of its proprietary aerogel materials for EV battery fire protection. The aerogels were developed to serve as thermal barriers that delay heat transfer and provide passive safety in electric vehicle battery packs. The product line was positioned to meet rising OEM demand for lightweight, high-temperature-resistant materials as EV adoption accelerates. It was stated that Alkegen’s facility was operating at full capacity to supply global automotive platforms.

Key Players

  • Aspen Aerogels, Inc.
  • Cabot Corporation
  • Armacell International S.A.
  • Beerenberg AS
  • IBIH Advanced Materials Co., Ltd.

Research Methodology

Future Market Insights’ chemicals research applies a rigorous, bottom-up framework that tracks both supply and demand to derive precise market estimates: it begins with comprehensive market profiling defining product scope, formulations, applications and end-use industries then builds a detailed data-capture list covering historical demand, installed production capacity, utilization rates, HS-code trade flows, application- and grade-wise consumption patterns and market fragmentation metrics.

Data is sourced via secondary research (industry journals, HS-trade databases, SEC filings, pricing quotes) and filled through primary interviews with manufacturers, distributors and KOLs; these inputs feed FMI’s proprietary year-over-year projection model, which weights macro-economic factors (raw-material availability, regulatory compliance, economic outlook) and micro drivers (capacity additions, company expansions) to generate scenario-based forecasts.

Throughout, iterative triangulation across supply records, consumption forecasts and trade analytics ensures auditable TAM calculations, while tiered competition mapping analyzes producer portfolios, capacities, market shares and strategic developments, rounds out a fully validated, data-driven outlook for the chemicals sector. Get the full research methodology and sample.

Report Scope

Attribute Description
Forecast period 2025 to 2035
Historical data 2020 to 2024
Base year for estimates 2024
Units of measure USD billion (value)
Segments covered Product type (silica, polymer, carbon, others); form (blanket, panel, monolith, article); end-use industry (construction, oil & gas, automotive & transport, aerospace & defence, others); region/country
Report coverage Market size and growth, CAGR analysis, drivers and restraints, regional and country outlooks, competitive landscape, and emerging opportunities
Regions/countries analysed United States, China, Germany, India, Japan, plus the wider markets of North America, Latin America, Western & Eastern Europe, South Asia, East Asia, and the Middle East & Africa
Key players profiled Aspen Aerogels; Cabot Corporation; Armacell International; Nano Tech; Zhejiang UGOO; Guangdong Alison; Beerenberg; Aerogel Technologies; Enersens; IBIH Advanced Materials
Industry classification Chemicals & Materials - General & Advanced Materials
Customisation scope Country-specific break-outs, additional segment splits, competitive-mapping add-ons

Key Market Segments

By Product Type:

On the basis of product type, the market is categorized into Silica Aerogel, Polymer Aerogel, Carbon Aerogel, and Others

By Form:

On the basis of form, the market is categorized into Monolith Aerogel, Blanket Aerogel, Article Aerogel, and Panel Form Aerogel

By End Use Industry:

On the basis of end use industry, the market is categorized into Oil and Gas, Marine and Aerospace, Performance Coating, Construction, Automotive, and Others

By Region:

Key regions considered for the study include North America, Latin America, East Asia, South Asia and Pacific, Western Europe, Eastern Europe and Middle East and Africa

Table of Content

  1. Executive Summary
  2. Industry Introduction, including Taxonomy and Market Definition
  3. Market Trends and Success Factors, including Macro-economic Factors, Market Dynamics, and Recent Industry Developments
  4. Global Market Demand Analysis 2020 to 2024 and Forecast 2025 to 2035, including Historical Analysis and Future Projections
  5. Pricing Analysis
  6. Global Market Analysis 2020 to 2024 and Forecast 2025 to 2035
    • Product Type
    • Form
    • End Use Industry
  7. Global Market Analysis 2020 to 2024 and Forecast 2025 to 2035, By Product Type
    • Silica Aerogel
    • Polymer Aerogel
    • Carbon Aerogel
    • Others
  8. Global Market Analysis 2020 to 2024 and Forecast 2025 to 2035, By Form
    • Monolith Aerogel
    • Blanket Aerogel
    • Article Aerogel
    • Panel Form Aerogel
  9. Global Market Analysis 2020 to 2024 and Forecast 2025 to 2035, By End Use Industry
    • Oil & Gas
    • Marine & Aerospace
    • Performance Coating
    • Construction
    • Automotive
    • Others
  10. Global Market Analysis 2020 to 2024 and Forecast 2025 to 2035, By Region
    • North America
    • Latin America
    • Western Europe
    • South Asia
    • East Asia
    • Eastern Europe
    • Middle East & Africa
  11. North America Sales Analysis 2020 to 2024 and Forecast 2025 to 2035, by Key Segments and Countries
  12. Latin America Sales Analysis 2020 to 2024 and Forecast 2025 to 2035, by Key Segments and Countries
  13. Western Europe Sales Analysis 2020 to 2024 and Forecast 2025 to 2035, by Key Segments and Countries
  14. South Asia Sales Analysis 2020 to 2024 and Forecast 2025 to 2035, by Key Segments and Countries
  15. East Asia Sales Analysis 2020 to 2024 and Forecast 2025 to 2035, by Key Segments and Countries
  16. Eastern Europe Sales Analysis 2020 to 2024 and Forecast 2025 to 2035, by Key Segments and Countries
  17. Middle East & Africa Sales Analysis 2020 to 2024 and Forecast 2025 to 2035, by Key Segments and Countries
  18. Sales Forecast 2025 to 2035 by Product Type, Form, and End Use Industry for 30 Countries
  19. Competition Outlook, including Market Structure Analysis, Company Share Analysis by Key Players, and Competition Dashboard
  20. Company Profile
    • Aspen Aerogels, Inc.
    • Cabot Corporation
    • Armacell International S.A.
    • Nano Tech Co., Ltd.
    • Zhejiang UGOO Technology Co., Ltd.
    • Guangdong Alison Technology Co., Ltd.
    • Beerenberg AS
    • Technologies, LLC
    • Enersens
    • IBIH Advanced Materials Co., Ltd.

List of Tables

  • Table 1: Global Market Value (USD Million) Forecast by Region, 2020 to 2035
  • Table 2: Global Market Volume (Tons) Forecast by Region, 2020 to 2035
  • Table 3: Global Market Value (USD Million) Forecast by Material Type, 2020 to 2035
  • Table 4: Global Market Volume (Tons) Forecast by Material Type, 2020 to 2035
  • Table 5: Global Market Value (USD Million) Forecast by Form, 2020 to 2035
  • Table 6: Global Market Volume (Tons) Forecast by Form, 2020 to 2035
  • Table 7: Global Market Value (USD Million) Forecast by Application, 2020 to 2035
  • Table 8: Global Market Volume (Tons) Forecast by Application, 2020 to 2035
  • Table 9: North America Market Value (USD Million) Forecast by Country, 2020 to 2035
  • Table 10: North America Market Volume (Tons) Forecast by Country, 2020 to 2035
  • Table 11: North America Market Value (USD Million) Forecast by Material Type, 2020 to 2035
  • Table 12: North America Market Volume (Tons) Forecast by Material Type, 2020 to 2035
  • Table 13: North America Market Value (USD Million) Forecast by Form, 2020 to 2035
  • Table 14: North America Market Volume (Tons) Forecast by Form, 2020 to 2035
  • Table 15: North America Market Value (USD Million) Forecast by Application, 2020 to 2035
  • Table 16: North America Market Volume (Tons) Forecast by Application, 2020 to 2035
  • Table 17: Latin America Market Value (USD Million) Forecast by Country, 2020 to 2035
  • Table 18: Latin America Market Volume (Tons) Forecast by Country, 2020 to 2035
  • Table 19: Latin America Market Value (USD Million) Forecast by Material Type, 2020 to 2035
  • Table 20: Latin America Market Volume (Tons) Forecast by Material Type, 2020 to 2035
  • Table 21: Latin America Market Value (USD Million) Forecast by Form, 2020 to 2035
  • Table 22: Latin America Market Volume (Tons) Forecast by Form, 2020 to 2035
  • Table 23: Latin America Market Value (USD Million) Forecast by Application, 2020 to 2035
  • Table 24: Latin America Market Volume (Tons) Forecast by Application, 2020 to 2035
  • Table 25: Europe Market Value (USD Million) Forecast by Country, 2020 to 2035
  • Table 26: Europe Market Volume (Tons) Forecast by Country, 2020 to 2035
  • Table 27: Europe Market Value (USD Million) Forecast by Material Type, 2020 to 2035
  • Table 28: Europe Market Volume (Tons) Forecast by Material Type, 2020 to 2035
  • Table 29: Europe Market Value (USD Million) Forecast by Form, 2020 to 2035
  • Table 30: Europe Market Volume (Tons) Forecast by Form, 2020 to 2035
  • Table 31: Europe Market Value (USD Million) Forecast by Application, 2020 to 2035
  • Table 32: Europe Market Volume (Tons) Forecast by Application, 2020 to 2035
  • Table 33: East Asia Market Value (USD Million) Forecast by Country, 2020 to 2035
  • Table 34: East Asia Market Volume (Tons) Forecast by Country, 2020 to 2035
  • Table 35: East Asia Market Value (USD Million) Forecast by Material Type, 2020 to 2035
  • Table 36: East Asia Market Volume (Tons) Forecast by Material Type, 2020 to 2035
  • Table 37: East Asia Market Value (USD Million) Forecast by Form, 2020 to 2035
  • Table 38: East Asia Market Volume (Tons) Forecast by Form, 2020 to 2035
  • Table 39: East Asia Market Value (USD Million) Forecast by Application, 2020 to 2035
  • Table 40: East Asia Market Volume (Tons) Forecast by Application, 2020 to 2035
  • Table 41: South Asia & Pacific Market Value (USD Million) Forecast by Country, 2020 to 2035
  • Table 42: South Asia & Pacific Market Volume (Tons) Forecast by Country, 2020 to 2035
  • Table 43: South Asia & Pacific Market Value (USD Million) Forecast by Material Type, 2020 to 2035
  • Table 44: South Asia & Pacific Market Volume (Tons) Forecast by Material Type, 2020 to 2035
  • Table 45: South Asia & Pacific Market Value (USD Million) Forecast by Form, 2020 to 2035
  • Table 46: South Asia & Pacific Market Volume (Tons) Forecast by Form, 2020 to 2035
  • Table 47: South Asia & Pacific Market Value (USD Million) Forecast by Application, 2020 to 2035
  • Table 48: South Asia & Pacific Market Volume (Tons) Forecast by Application, 2020 to 2035
  • Table 49: MEA Market Value (USD Million) Forecast by Country, 2020 to 2035
  • Table 50: MEA Market Volume (Tons) Forecast by Country, 2020 to 2035
  • Table 51: MEA Market Value (USD Million) Forecast by Material Type, 2020 to 2035
  • Table 52: MEA Market Volume (Tons) Forecast by Material Type, 2020 to 2035
  • Table 53: MEA Market Value (USD Million) Forecast by Form, 2020 to 2035
  • Table 54: MEA Market Volume (Tons) Forecast by Form, 2020 to 2035
  • Table 55: MEA Market Value (USD Million) Forecast by Application, 2020 to 2035
  • Table 56: MEA Market Volume (Tons) Forecast by Application, 2020 to 2035

List of Figures

  • Figure 1: Global Market Value (USD Million) by Material Type, 2025 to 2035
  • Figure 2: Global Market Value (USD Million) by Form, 2025 to 2035
  • Figure 3: Global Market Value (USD Million) by Application, 2025 to 2035
  • Figure 4: Global Market Value (USD Million) by Region, 2025 to 2035
  • Figure 5: Global Market Value (USD Million) Analysis by Region, 2020 to 2035
  • Figure 6: Global Market Volume (Tons) Analysis by Region, 2020 to 2035
  • Figure 7: Global Market Value Share (%) and BPS Analysis by Region, 2025 to 2035
  • Figure 8: Global Market Y-o-Y Growth (%) Projections by Region, 2025 to 2035
  • Figure 9: Global Market Value (USD Million) Analysis by Material Type, 2020 to 2035
  • Figure 10: Global Market Volume (Tons) Analysis by Material Type, 2020 to 2035
  • Figure 11: Global Market Value Share (%) and BPS Analysis by Material Type, 2025 to 2035
  • Figure 12: Global Market Y-o-Y Growth (%) Projections by Material Type, 2025 to 2035
  • Figure 13: Global Market Value (USD Million) Analysis by Form, 2020 to 2035
  • Figure 14: Global Market Volume (Tons) Analysis by Form, 2020 to 2035
  • Figure 15: Global Market Value Share (%) and BPS Analysis by Form, 2025 to 2035
  • Figure 16: Global Market Y-o-Y Growth (%) Projections by Form, 2025 to 2035
  • Figure 17: Global Market Value (USD Million) Analysis by Application, 2020 to 2035
  • Figure 18: Global Market Volume (Tons) Analysis by Application, 2020 to 2035
  • Figure 19: Global Market Value Share (%) and BPS Analysis by Application, 2025 to 2035
  • Figure 20: Global Market Y-o-Y Growth (%) Projections by Application, 2025 to 2035
  • Figure 21: Global Market Attractiveness by Material Type, 2025 to 2035
  • Figure 22: Global Market Attractiveness by Form, 2025 to 2035
  • Figure 23: Global Market Attractiveness by Application, 2025 to 2035
  • Figure 24: Global Market Attractiveness by Region, 2025 to 2035
  • Figure 25: North America Market Value (USD Million) by Material Type, 2025 to 2035
  • Figure 26: North America Market Value (USD Million) by Form, 2025 to 2035
  • Figure 27: North America Market Value (USD Million) by Application, 2025 to 2035
  • Figure 28: North America Market Value (USD Million) by Country, 2025 to 2035
  • Figure 29: North America Market Value (USD Million) Analysis by Country, 2020 to 2035
  • Figure 30: North America Market Volume (Tons) Analysis by Country, 2020 to 2035
  • Figure 31: North America Market Value Share (%) and BPS Analysis by Country, 2025 to 2035
  • Figure 32: North America Market Y-o-Y Growth (%) Projections by Country, 2025 to 2035
  • Figure 33: North America Market Value (USD Million) Analysis by Material Type, 2020 to 2035
  • Figure 34: North America Market Volume (Tons) Analysis by Material Type, 2020 to 2035
  • Figure 35: North America Market Value Share (%) and BPS Analysis by Material Type, 2025 to 2035
  • Figure 36: North America Market Y-o-Y Growth (%) Projections by Material Type, 2025 to 2035
  • Figure 37: North America Market Value (USD Million) Analysis by Form, 2020 to 2035
  • Figure 38: North America Market Volume (Tons) Analysis by Form, 2020 to 2035
  • Figure 39: North America Market Value Share (%) and BPS Analysis by Form, 2025 to 2035
  • Figure 40: North America Market Y-o-Y Growth (%) Projections by Form, 2025 to 2035
  • Figure 41: North America Market Value (USD Million) Analysis by Application, 2020 to 2035
  • Figure 42: North America Market Volume (Tons) Analysis by Application, 2020 to 2035
  • Figure 43: North America Market Value Share (%) and BPS Analysis by Application, 2025 to 2035
  • Figure 44: North America Market Y-o-Y Growth (%) Projections by Application, 2025 to 2035
  • Figure 45: North America Market Attractiveness by Material Type, 2025 to 2035
  • Figure 46: North America Market Attractiveness by Form, 2025 to 2035
  • Figure 47: North America Market Attractiveness by Application, 2025 to 2035
  • Figure 48: North America Market Attractiveness by Country, 2025 to 2035
  • Figure 49: Latin America Market Value (USD Million) by Material Type, 2025 to 2035
  • Figure 50: Latin America Market Value (USD Million) by Form, 2025 to 2035
  • Figure 51: Latin America Market Value (USD Million) by Application, 2025 to 2035
  • Figure 52: Latin America Market Value (USD Million) by Country, 2025 to 2035
  • Figure 53: Latin America Market Value (USD Million) Analysis by Country, 2020 to 2035
  • Figure 54: Latin America Market Volume (Tons) Analysis by Country, 2020 to 2035
  • Figure 55: Latin America Market Value Share (%) and BPS Analysis by Country, 2025 to 2035
  • Figure 56: Latin America Market Y-o-Y Growth (%) Projections by Country, 2025 to 2035
  • Figure 57: Latin America Market Value (USD Million) Analysis by Material Type, 2020 to 2035
  • Figure 58: Latin America Market Volume (Tons) Analysis by Material Type, 2020 to 2035
  • Figure 59: Latin America Market Value Share (%) and BPS Analysis by Material Type, 2025 to 2035
  • Figure 60: Latin America Market Y-o-Y Growth (%) Projections by Material Type, 2025 to 2035
  • Figure 61: Latin America Market Value (USD Million) Analysis by Form, 2020 to 2035
  • Figure 62: Latin America Market Volume (Tons) Analysis by Form, 2020 to 2035
  • Figure 63: Latin America Market Value Share (%) and BPS Analysis by Form, 2025 to 2035
  • Figure 64: Latin America Market Y-o-Y Growth (%) Projections by Form, 2025 to 2035
  • Figure 65: Latin America Market Value (USD Million) Analysis by Application, 2020 to 2035
  • Figure 66: Latin America Market Volume (Tons) Analysis by Application, 2020 to 2035
  • Figure 67: Latin America Market Value Share (%) and BPS Analysis by Application, 2025 to 2035
  • Figure 68: Latin America Market Y-o-Y Growth (%) Projections by Application, 2025 to 2035
  • Figure 69: Latin America Market Attractiveness by Material Type, 2025 to 2035
  • Figure 70: Latin America Market Attractiveness by Form, 2025 to 2035
  • Figure 71: Latin America Market Attractiveness by Application, 2025 to 2035
  • Figure 72: Latin America Market Attractiveness by Country, 2025 to 2035
  • Figure 73: Europe Market Value (USD Million) by Material Type, 2025 to 2035
  • Figure 74: Europe Market Value (USD Million) by Form, 2025 to 2035
  • Figure 75: Europe Market Value (USD Million) by Application, 2025 to 2035
  • Figure 76: Europe Market Value (USD Million) by Country, 2025 to 2035
  • Figure 77: Europe Market Value (USD Million) Analysis by Country, 2020 to 2035
  • Figure 78: Europe Market Volume (Tons) Analysis by Country, 2020 to 2035
  • Figure 79: Europe Market Value Share (%) and BPS Analysis by Country, 2025 to 2035
  • Figure 80: Europe Market Y-o-Y Growth (%) Projections by Country, 2025 to 2035
  • Figure 81: Europe Market Value (USD Million) Analysis by Material Type, 2020 to 2035
  • Figure 82: Europe Market Volume (Tons) Analysis by Material Type, 2020 to 2035
  • Figure 83: Europe Market Value Share (%) and BPS Analysis by Material Type, 2025 to 2035
  • Figure 84: Europe Market Y-o-Y Growth (%) Projections by Material Type, 2025 to 2035
  • Figure 85: Europe Market Value (USD Million) Analysis by Form, 2020 to 2035
  • Figure 86: Europe Market Volume (Tons) Analysis by Form, 2020 to 2035
  • Figure 87: Europe Market Value Share (%) and BPS Analysis by Form, 2025 to 2035
  • Figure 88: Europe Market Y-o-Y Growth (%) Projections by Form, 2025 to 2035
  • Figure 89: Europe Market Value (USD Million) Analysis by Application, 2020 to 2035
  • Figure 90: Europe Market Volume (Tons) Analysis by Application, 2020 to 2035
  • Figure 91: Europe Market Value Share (%) and BPS Analysis by Application, 2025 to 2035
  • Figure 92: Europe Market Y-o-Y Growth (%) Projections by Application, 2025 to 2035
  • Figure 93: Europe Market Attractiveness by Material Type, 2025 to 2035
  • Figure 94: Europe Market Attractiveness by Form, 2025 to 2035
  • Figure 95: Europe Market Attractiveness by Application, 2025 to 2035
  • Figure 96: Europe Market Attractiveness by Country, 2025 to 2035
  • Figure 97: East Asia Market Value (USD Million) by Material Type, 2025 to 2035
  • Figure 98: East Asia Market Value (USD Million) by Form, 2025 to 2035
  • Figure 99: East Asia Market Value (USD Million) by Application, 2025 to 2035
  • Figure 100: East Asia Market Value (USD Million) by Country, 2025 to 2035
  • Figure 101: East Asia Market Value (USD Million) Analysis by Country, 2020 to 2035
  • Figure 102: East Asia Market Volume (Tons) Analysis by Country, 2020 to 2035
  • Figure 103: East Asia Market Value Share (%) and BPS Analysis by Country, 2025 to 2035
  • Figure 104: East Asia Market Y-o-Y Growth (%) Projections by Country, 2025 to 2035
  • Figure 105: East Asia Market Value (USD Million) Analysis by Material Type, 2020 to 2035
  • Figure 106: East Asia Market Volume (Tons) Analysis by Material Type, 2020 to 2035
  • Figure 107: East Asia Market Value Share (%) and BPS Analysis by Material Type, 2025 to 2035
  • Figure 108: East Asia Market Y-o-Y Growth (%) Projections by Material Type, 2025 to 2035
  • Figure 109: East Asia Market Value (USD Million) Analysis by Form, 2020 to 2035
  • Figure 110: East Asia Market Volume (Tons) Analysis by Form, 2020 to 2035
  • Figure 111: East Asia Market Value Share (%) and BPS Analysis by Form, 2025 to 2035
  • Figure 112: East Asia Market Y-o-Y Growth (%) Projections by Form, 2025 to 2035
  • Figure 113: East Asia Market Value (USD Million) Analysis by Application, 2020 to 2035
  • Figure 114: East Asia Market Volume (Tons) Analysis by Application, 2020 to 2035
  • Figure 115: East Asia Market Value Share (%) and BPS Analysis by Application, 2025 to 2035
  • Figure 116: East Asia Market Y-o-Y Growth (%) Projections by Application, 2025 to 2035
  • Figure 117: East Asia Market Attractiveness by Material Type, 2025 to 2035
  • Figure 118: East Asia Market Attractiveness by Form, 2025 to 2035
  • Figure 119: East Asia Market Attractiveness by Application, 2025 to 2035
  • Figure 120: East Asia Market Attractiveness by Country, 2025 to 2035
  • Figure 121: South Asia & Pacific Market Value (USD Million) by Material Type, 2025 to 2035
  • Figure 122: South Asia & Pacific Market Value (USD Million) by Form, 2025 to 2035
  • Figure 123: South Asia & Pacific Market Value (USD Million) by Application, 2025 to 2035
  • Figure 124: South Asia & Pacific Market Value (USD Million) by Country, 2025 to 2035
  • Figure 125: South Asia & Pacific Market Value (USD Million) Analysis by Country, 2020 to 2035
  • Figure 126: South Asia & Pacific Market Volume (Tons) Analysis by Country, 2020 to 2035
  • Figure 127: South Asia & Pacific Market Value Share (%) and BPS Analysis by Country, 2025 to 2035
  • Figure 128: South Asia & Pacific Market Y-o-Y Growth (%) Projections by Country, 2025 to 2035
  • Figure 129: South Asia & Pacific Market Value (USD Million) Analysis by Material Type, 2020 to 2035
  • Figure 130: South Asia & Pacific Market Volume (Tons) Analysis by Material Type, 2020 to 2035
  • Figure 131: South Asia & Pacific Market Value Share (%) and BPS Analysis by Material Type, 2025 to 2035
  • Figure 132: South Asia & Pacific Market Y-o-Y Growth (%) Projections by Material Type, 2025 to 2035
  • Figure 133: South Asia & Pacific Market Value (USD Million) Analysis by Form, 2020 to 2035
  • Figure 134: South Asia & Pacific Market Volume (Tons) Analysis by Form, 2020 to 2035
  • Figure 135: South Asia & Pacific Market Value Share (%) and BPS Analysis by Form, 2025 to 2035
  • Figure 136: South Asia & Pacific Market Y-o-Y Growth (%) Projections by Form, 2025 to 2035
  • Figure 137: South Asia & Pacific Market Value (USD Million) Analysis by Application, 2020 to 2035
  • Figure 138: South Asia & Pacific Market Volume (Tons) Analysis by Application, 2020 to 2035
  • Figure 139: South Asia & Pacific Market Value Share (%) and BPS Analysis by Application, 2025 to 2035
  • Figure 140: South Asia & Pacific Market Y-o-Y Growth (%) Projections by Application, 2025 to 2035
  • Figure 141: South Asia & Pacific Market Attractiveness by Material Type, 2025 to 2035
  • Figure 142: South Asia & Pacific Market Attractiveness by Form, 2025 to 2035
  • Figure 143: South Asia & Pacific Market Attractiveness by Application, 2025 to 2035
  • Figure 144: South Asia & Pacific Market Attractiveness by Country, 2025 to 2035
  • Figure 145: MEA Market Value (USD Million) by Material Type, 2025 to 2035
  • Figure 146: MEA Market Value (USD Million) by Form, 2025 to 2035
  • Figure 147: MEA Market Value (USD Million) by Application, 2025 to 2035
  • Figure 148: MEA Market Value (USD Million) by Country, 2025 to 2035
  • Figure 149: MEA Market Value (USD Million) Analysis by Country, 2020 to 2035
  • Figure 150: MEA Market Volume (Tons) Analysis by Country, 2020 to 2035
  • Figure 151: MEA Market Value Share (%) and BPS Analysis by Country, 2025 to 2035
  • Figure 152: MEA Market Y-o-Y Growth (%) Projections by Country, 2025 to 2035
  • Figure 153: MEA Market Value (USD Million) Analysis by Material Type, 2020 to 2035
  • Figure 154: MEA Market Volume (Tons) Analysis by Material Type, 2020 to 2035
  • Figure 155: MEA Market Value Share (%) and BPS Analysis by Material Type, 2025 to 2035
  • Figure 156: MEA Market Y-o-Y Growth (%) Projections by Material Type, 2025 to 2035
  • Figure 157: MEA Market Value (USD Million) Analysis by Form, 2020 to 2035
  • Figure 158: MEA Market Volume (Tons) Analysis by Form, 2020 to 2035
  • Figure 159: MEA Market Value Share (%) and BPS Analysis by Form, 2025 to 2035
  • Figure 160: MEA Market Y-o-Y Growth (%) Projections by Form, 2025 to 2035
  • Figure 161: MEA Market Value (USD Million) Analysis by Application, 2020 to 2035
  • Figure 162: MEA Market Volume (Tons) Analysis by Application, 2020 to 2035
  • Figure 163: MEA Market Value Share (%) and BPS Analysis by Application, 2025 to 2035
  • Figure 164: MEA Market Y-o-Y Growth (%) Projections by Application, 2025 to 2035
  • Figure 165: MEA Market Attractiveness by Material Type, 2025 to 2035
  • Figure 166: MEA Market Attractiveness by Form, 2025 to 2035
  • Figure 167: MEA Market Attractiveness by Application, 2025 to 2035
  • Figure 168: MEA Market Attractiveness by Country, 2025 to 2035

Frequently Asked Questions

What is the estimated size of the aerogel market in 2025?

The market is projected to reach about USD 2.4 billion in 2025.

How large is the market expected to be by 2035?

Global sales are forecast to rise to roughly USD 11.5 billion by 2035.

What value-based CAGR is likely between 2025 and 2035?

Revenue is expected to advance at an approximately 17% CAGR over the forecast period.

Which factors are projected to drive demand?

Tighter building-energy codes, wider use of lightweight thermal barriers in electric-vehicle batteries, and insulation upgrades in LNG infrastructure are likely to underpin growth.

Which product segment is expected to hold the largest share?

Silica aerogel is projected to account for about 71% of global revenue in 2025 owing to its ultra-low thermal conductivity and broad industrial acceptance.

Which country is likely to record the fastest growth?

India is expected to post the highest national CAGR around 17% supported by smart-city energy codes, LNG terminal expansions, and new e-scooter battery safety norms.

Explore Similar Insights

Future Market Insights

Aerogel Market