Softgel Capsules Market Size and Share Forecast Outlook 2025 to 2035

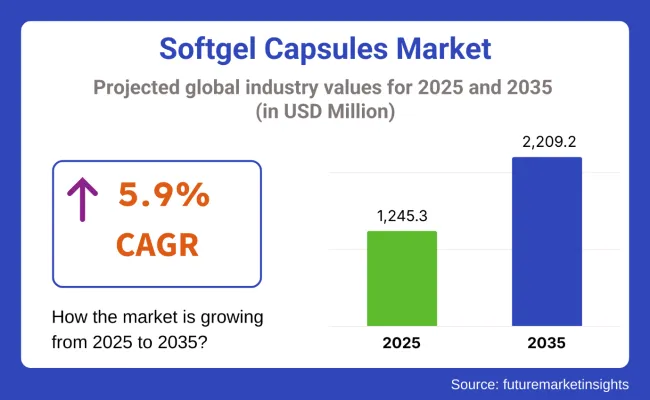
The global Softgel Capsule Market is estimated to be valued at USD 1,245.3 million in 2025 and is projected to reach USD 2,209.2 million by 2035, registering a compound annual growth rate (CAGR) of 5.9% over the forecast period.
Quick Stats for Pharmacy Automation Market

  • Industry Value (2025): USD 1,245.3 million
  • Forecast Value (2035): USD 2,209.2 million
  • Forecast CAGR: 5.9%
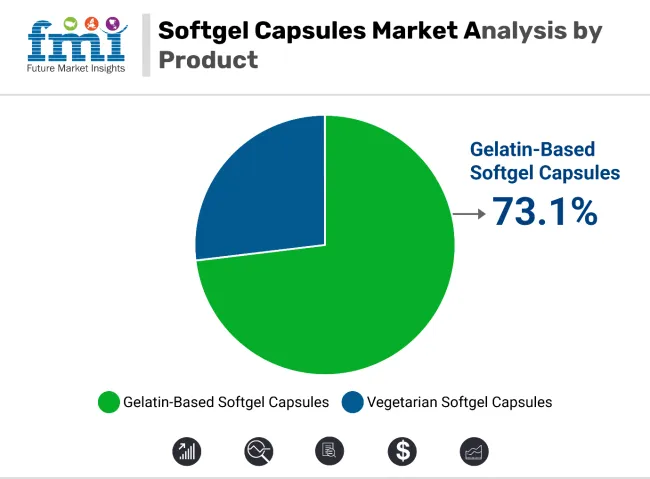
  • Leading Segment in 2025: Gelatin-Based Softgel Capsules
  • Key Growth Regions: North America, Europe
  • Top Key Players: Aenova Group, Fuji Capsule Co., Ltd, Catalent, Inc, EuroCaps Ltd, Guangdong Yichao Biotechnology Co., Ltd., Captek Softgel International Inc, Soft Gel Technologies Inc.

Softgel Capsules Market

This upward trajectory is fundamentally driven by accelerating pharmaceutical and nutraceutical industry expansion along with a significant demand for gelatin-based capsules. Critical factors influencing the growth of this market include rising consumer preference for oral drug delivery systems, enhanced bioavailability characteristics of softgel formulations and increasing chronic disease prevalence. The market also benefits from technological innovations in encapsulation processes and growing demand for personalized medicine.

Market leaders Capsugel (Lonza Group), Catalent Inc., CAPTEK Softgel International, Aenova Group, and Procaps Group are driving substantial growth through strategic technological innovations and capacity expansions. These manufacturers are capitalizing on increasing nutraceutical demand and preventive healthcare trends, with plant-based softgel capsules gaining significant momentum through HPMC and pullulan innovations that enhance clean-label appeal.

Others factors include pharmaceutical companies' increasing adoption of softgel formulations for poorly soluble drugs, expanding manufacturing capabilities in emerging markets, and strategic partnerships with nutraceutical companies. In 2024, Roquette announced the Launch of New LYCAGEL® Flex Softgel Capsule Shell System.

“At Roquette, our guiding purpose is to solve the toughest challenges in drug delivery,” commented Steve Amoussou-Guenou, Technical Developer Manager Europe at Roquette. Key players are investing heavily in advanced encapsulation technologies, automated production systems, and quality assurance protocols to meet stringent regulatory requirements across global markets

Analyzing Softgel Capsules Market by Top Investment Segments

Gelatin-Based Softgel Capsules Lead the Market Due to Biocompatibility, Stability, and Versatility

In 2025, gelatin-based softgel capsules are projected to capture 73.1% of the total revenue share in the softgel capsule market. This dominance is driven by the well-established benefits of gelatin as a versatile, biocompatible material that provides excellent stability and ease of manufacturing. Gelatin capsules are widely preferred in the pharmaceutical and nutraceutical industries due to their ability to encapsulate a variety of active ingredients, including oils, powders, and liquids, with high bioavailability.

Additionally, gelatin-based softgel capsules are cost-effective to produce and widely accepted by regulatory bodies, further bolstering their market share. The segment’s growth is also attributed to increasing consumer demand for dietary supplements, particularly those related to health, wellness, and aging, where gelatin-based capsules are a preferred format due to their ability to deliver a wide range of active ingredients in a single dosage form.
Softgel Capsules Market By Product

Type A Gelatin Dominates the Raw Material Segment Due to Excellent Gelation and Versatility in Softgel Capsule Production

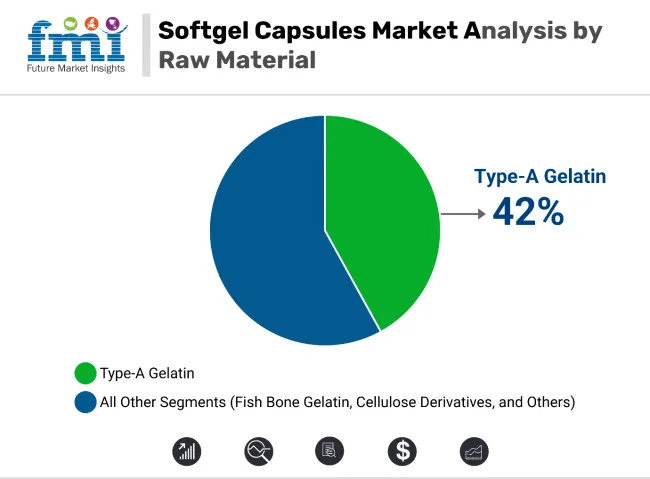
In 2025, Type A gelatin is expected to hold 42.0% of the revenue share in the raw material segment of the softgel capsule market. This leading position is due to Type A gelatin’s superior gelation properties, which provide excellent film formation, elasticity, and strength in softgel capsule production. Derived from pork skin, Type A gelatin is highly favored for its ability to dissolve efficiently and release active ingredients rapidly in the gastrointestinal tract, making it ideal for pharmaceutical and nutraceutical applications.

Its versatility in encapsulating both hydrophilic and lipophilic ingredients has further contributed to its widespread adoption in the production of softgel capsules. Additionally, Type A gelatin has been widely recognized for its cost-effectiveness, availability, and regulatory acceptance, making it the preferred raw material for manufacturers. As the demand for softgel capsules in the global pharmaceutical and dietary supplement industries continues to rise, Type A gelatin is expected to remain the dominant raw material in the market.
Softgel Capsules Market By Row Material

Challenges and Opportunities

Challenge: High Production Costs and Material Sensitivities

In contrast, softgels need the use of specialized encapsulation machinery, stringent temperature and humidity controls, and a high degree of precision with gelatin or plant-based polymers. These challenging conditions result in higher operational costs, hence contract manufacturing and in-house production become on the capital-intensive side.

Moreover, softgels are sensitive to moisture, oxygen, and heat, which can cause product instability especially in design nutraceuticals or pharmaceuticals containing volatile oils, live probiotics, or lipid-soluble compounds. The growing number of vegetarian diets worldwide, for example, poses an additional challenge to the softgel form, as gelatin is unsuitable for certain consumer bases (e.g. vegetarians, vegans, and certain religious populations).

Opportunity: Growth in Nutraceuticals, Personalized Dosing, and Plant-Based Alternatives

Despite these limitations, the global softgel capsules market is expected to witness significant growth due to the rising demand for nutraceuticals, omega-3 dietary supplements, herbal extracts, and disease-specific formulations. It provides many benefits, such as convenient swallowing, fast bioavailability, and higher stability of oil-based compounds. Softgels are preferred by consumers for vitamins, anti-inflammatory blends, joint support and cognitive health, driving demand for end-users of all ages.

Vegetarian softgel shells contain tapioca starch, carrageenan or modified cellulose, which has given rise to plant-based supplement brands. In medicine, they are increasingly being used in controlled-release systems, pediatric formulations, and hormonal therapies due to their customizable dosage and taste-masking capabilities.

Country-Wise Outlook

United States

The USA softgel capsules industry is rising consistently due to growing need for dietary supplements along with aging population and growing preference for easy-to-swallow dosage forms. Softgels are commonly used for vitamins, fish oils and prescription drugs, with very high consumer acceptance in OTC and pharmaceutical markets.

Innovation in ways to use gelatin alternatives, controlled-release technologies and bioavailability enhancement are also pepping up. Increased growth in the direct-to-consumer nutraceutical sector in addition to solid retail distribution are also factors in the expanding market.

Country CAGR (2025 to 2035)
USA 6.0%

United Kingdom

The UK softgel capsules market has been witnessing steady growth over the years, fueled by rising health consciousness among consumers, new opportunities in plant-based supplement trends, and advancements in functional nutrition. Softgels are the preferred form of omega-3, turmeric, and vitamin D supplementation, especially for joint health, immunity, and beauty applications.

To fulfil a gradually increasing customer base of vegetarians and halal consumers, brands are providing vegan and gelatine-free softgel choices. It is also a recommendation-driven market and e-commerce driven channel, with significant growth of personalized wellness products.

Country CAGR (2025 to 2035)
UK 5.5%

European Union

The European Union softgel capsules market is poised for market expansion, driven by increased demand for high-absorption nutritional supplements, management of chronic diseases, and better regulation of nutritional products. It is due to this factor that Germany, Italy and the Netherlands is dominating in the production as well as consumption of nutraceutical and pharma-grade softgels.

As demand for clean-label, allergen-free and non-GMO supplements grows, softgel innovations, like plant-based and starch-based gel technologies, are also being developed by EU manufacturers. Because of higher bioavailability, pharmaceutical companies are utilizing softgels for hormone therapy, cardiovascular drugs, and central nervous system (CNS) treatments.

Region CAGR (2025 to 2035)
European Union 5.8%

Japan

Japan is experiencing moderate growth in its softgel capsules market, with the demand being led by its aging population, which prefers easy dosing formats and precise dosing, alongside a focus on wellness and health. Softgels are a popular delivery method in dosage forms that support eye health, energy, and cognitive function, and they are keenly focused on quality and efficacy.

At the same time, local pharmaceutical companies follow developments in customized softgel formulations for niche indications, and nutraceutical companies take advantage of their ability to combine coenzyme Q10 and lutein with collagen in softgel formats. Regulation promotes innovation and protects consumers.

Country CAGR (2025 to 2035)
Japan 5.4%

South Korea

Growth of the South Korean softgel capsules market is thriving thanks to the wellness trends along with cosmetic-nutritional crossovers and tech-driven supplement delivery. Softgels for skin-care, weight management, and anti-fatigue formulations are gaining popularity among consumers, who are heavily swayed by beauty and wellness influencers.

And domestically, brands are launching sugar-free, fast-dissolving, and plant-based softgel capsules aimed at young, urban consumers. Healthcare segment growth is also being compounded by booming pharmaceutical demand for precision-dose softgels in oncology and chronic care.

Country CAGR (2025 to 2035)
South Korea 6.1%

Competitive Outlook

The global softgel capsules products market enables consumers to attain a broad spectrum of physical and psychological wellness for longer and is one of the most promising and dynamic segments of the pharma industry. Softgels are popular not just for vitamins and supplements but omega-3s and prescription drugs as well, while providing protection to lipid-based and sensitive formulations.

Major players have their eyes set on gelatin and plant-based alternatives, high-throughput encapsulation, clean-label ingredients, and tailored release profiles. The market consists of CDMOs, pharma companies and dietary supplement manufacturers in therapeutic, preventive and wellness sectors worldwide.

Key Developments:

  • In 2024, Roquette, a leader in plant-based ingredients, has launched LYCAGEL® Flex, a new hydroxypropyl pea starch premix. This plasticizer-free excipient for nutraceutical and pharmaceutical softgel capsules allows manufacturers to customize formulations. It aims to set new standards for quality, stability, and performance in plant-based softgels, building on Roquette's existing LYCAGEL® technology
  • In 2024, Torque Pharma has introduced Multipower Soft Gelatin Capsules, a new nutraceutical combining multivitamins and essential minerals. This innovation aims to boost immunity and energy, addressing daily nutritional needs. The capsules contain Ginseng extract alongside vital vitamins (A, B1, B2, B6, B12, C, E, B3) and minerals (calcium, copper, iodine, iron, manganese, zinc) to combat deficiencies

Key Players

  • Aenova Group
  • Fuji Capsule Co., Ltd
  • Catalent, Inc
  • EuroCaps Ltd
  • Guangdong Yichao Biotechnology Co., Ltd.
  • Captek Softgel International Inc
  • Soft Gel Technologies Inc.
  • Thermo Fisher Scientific Inc (Patheon)
  • Delpharm Evreux
  • Curtis Health Caps
  • Sirio Pharma Company Limited
  • Elnova Pharma
  • United Labs
  • Hunan Er-Kang Pharmaceutical Co., Ltd
  • Procaps Group (Softigel)
  • Softgel Healthcare
  • Medgel Pvt. Ltd

Top Segments Studied in the Softgel Capsules Market Research Report

By Product:

  • Gelatin Softgel Capsules
  • Vegetarian Softgel Capsules

By Raw Material:

  • Type-A Gelatin (Pork Skin)
  • Type-B Gelatin (Animal Bones & Skin)
  • Fish Bone Gelatin
  • Cellulose Derivatives
  • Starch Material

By Application:

  • Antacid & Antiflatulent Preparations
  • Antianemic Preparations Hematinic Preparations)
  • Anti-inflammatory Drugs
  • Antibiotic & Antibacterial Drugs
  • Cough & Cold Preparations
  • Cardiovascular Therapy Drugs
  • Health Supplements
  • Vitamin & Dietary Supplements
  • Other Therapeutic Applications

By End User:

  • In-house Manufacturing
  • Contract Manufacturing Organizations

By Route of Administration:

  • Oral Softgels
  • Suppositories
  • Pessaries
  • Twist off Softgels
  • Others

By Region:

  • North America
  • Latin America
  • Western Europe
  • Eastern Europe
  • East Asia
  • South Asia Pacific
  • Middle East and Africa

Table of Content

  1. Executive Summary
  2. Industry Introduction, including Taxonomy and Market Definition
  3. Market Trends and Success Factors, including Macro-economic Factors, Market Dynamics, and Recent Industry Developments
  4. Global Market Demand Analysis 2020 to 2024 and Forecast 2025 to 2035, including Historical Analysis and Future Projections
  5. Global Market Analysis 2020 to 2024 and Forecast 2025 to 2035
    • Product Type
    • Application
    • End-use
    • Route of Administration
    • Raw Material
  6. Global Market Analysis 2020 to 2024 and Forecast 2025 to 2035, By Product Type
    • Gelatin Softgel Capsules
    • Vegetarian Softgel Capsules
  7. Global Market Analysis 2020 to 2024 and Forecast 2025 to 2035, By Application
    • Antacid & Antiflatulent Preparations
    • Antianemic Preparations Hematinic Preparations
    • Anti-inflammatory Drugs
    • Antibiotic & Antibacterial Drugs
    • Cough & Cold Preparations
    • Cardiovascular Therapy Drugs
    • Health Supplements
    • Vitamin & Dietary Supplements
    • Other Therapeutic Applications
  8. Global Market Analysis 2020 to 2024 and Forecast 2025 to 2035, By End-use
    • In-house Manufacturing
    • Contract Manufacturing Organizations
  9. Global Market Analysis 2020 to 2024 and Forecast 2025 to 2035, By Route of Administration
    • Oral Softgels
    • Suppositories
    • Pessaries
    • Twist off Softgels
    • Others
  10. Global Market Analysis 2020 to 2024 and Forecast 2025 to 2035, By Raw Material
    • Type-A Gelatin (Pork Skin)
    • Type-B Gelatin (Animal Bones & Skin)
    • Fish Bone Gelatin
    • Cellulose Derivatives
    • Starch Material
  11. Global Market Analysis 2020 to 2024 and Forecast 2025 to 2035, By Region
    • North America
    • Latin America
    • Western Europe
    • Eastern Europe
    • East Asia
    • South Asia Pacific
    • Middle East and Africa
  12. North America Sales Analysis 2020 to 2024 and Forecast 2025 to 2035, by Key Segments and Countries
  13. Latin America Sales Analysis 2020 to 2024 and Forecast 2025 to 2035, by Key Segments and Countries
  14. Western Europe Sales Analysis 2020 to 2024 and Forecast 2025 to 2035, by Key Segments and Countries
  15. Eastern Europe Sales Analysis 2020 to 2024 and Forecast 2025 to 2035, by Key Segments and Countries
  16. East Asia Sales Analysis 2020 to 2024 and Forecast 2025 to 2035, by Key Segments and Countries
  17. South Asia Pacific Sales Analysis 2020 to 2024 and Forecast 2025 to 2035, by Key Segments and Countries
  18. Middle East and Africa Sales Analysis 2020 to 2024 and Forecast 2025 to 2035, by Key Segments and Countries
  19. Sales Forecast 2025 to 2035 by Product Type, Application, End-use, Route of Administration, and Raw Material for 30 Countries
  20. Competition Outlook, including Market Structure Analysis, Company Share Analysis by Key Players, and Competition Dashboard
  21. Company Profile
    • Aenova Group
    • Fuji Capsule Co., Ltd
    • Catalent, Inc
    • EuroCaps Ltd
    • Guangdong Yichao Biotechnology Co., Ltd.
    • Captek Softgel International Inc
    • Soft Gel Technologies Inc.
    • Thermo Fisher Scientific Inc (Patheon)
    • Delpharm Evreux
    • Curtis Health Caps
    • Sirio Pharma Company Limited
    • Elnova Pharma
    • United Labs
    • Hunan Er-Kang Pharmaceutical Co., Ltd
    • Procaps Group (Softigel)
    • Softgel Healthcare
    • Medgel Pvt. Ltd

List of Tables

  • Table 01: Global Market Value (USD Million) Analysis and Forecast 2020 to 2035, by Product
  • Table 02: Global Market Volume (Million Units) Analysis and Forecast 2020 to 2035, by Product
  • Table 03: Global Market Value (USD Million) Analysis and Forecast 2020 to 2035, by Raw Material
  • Table 04: Global Market Value (USD Million) Analysis and Forecast 2020 to 2035, by Application
  • Table 05: Global Market Value (USD Million) Analysis and Forecast 2020 to 2035, by End User
  • Table 06: Global Market Value (USD Million) Analysis and Forecast 2020 to 2035, by Route of Administration
  • Table 07: North America Market Value (USD Million) Analysis 2020 to 2024 and Forecast 2025 to 2035, by Country
  • Table 08: North America Market Value (USD Million) Analysis and Forecast 2020 to 2035, by Product
  • Table 09: North America Market Volume (Million Units) Analysis and Forecast 2020 to 2035, by Product
  • Table 10: North America Market Value (USD Million) Analysis and Forecast 2020 to 2035, by Raw Material
  • Table 11: North America Market Value (USD Million) Analysis and Forecast 2020 to 2035, by Application
  • Table 12: North America Market Value (USD Million) Analysis and Forecast 2020 to 2035, by End User
  • Table 13: North America Market Value (USD Million) Analysis and Forecast 2020 to 2035, by Route of Administration
  • Table 14: Latin America Market Value (USD Million) Analysis 2020 to 2024 and Forecast 2025 to 2035, by Country
  • Table 15: Latin America Market Value (USD Million) Analysis and Forecast 2020 to 2035, by Product
  • Table 16: Latin America Market Volume (Million Units) Analysis and Forecast 2020 to 2035, by Product
  • Table 17: Latin America Market Value (USD Million) Analysis and Forecast 2020 to 2035, by Raw Material
  • Table 18: Latin America Market Value (USD Million) Analysis and Forecast 2020 to 2035, by Application
  • Table 19: Latin America Market Value (USD Million) Analysis and Forecast 2020 to 2035, by End User
  • Table 20: Latin America Market Value (USD Million) Analysis and Forecast 2020 to 2035, by Route of Administration
  • Table 21: Europe Market Value (USD Million) Analysis 2020 to 2024 and Forecast 2025 to 2035, by Country
  • Table 22: Europe Market Value (USD Million) Analysis and Forecast 2020 to 2035, by Product
  • Table 23: Europe Market Volume (Million Units) Analysis and Forecast 2020 to 2035, by Product
  • Table 24: Europe Market Value (USD Million) Analysis and Forecast 2020 to 2035, by Raw Material
  • Table 25: Europe Market Value (USD Million) Analysis and Forecast 2020 to 2035, by Application
  • Table 26: Europe Market Value (USD Million) Analysis and Forecast 2020 to 2035, by End User
  • Table 27: Europe Market Value (USD Million) Analysis and Forecast 2020 to 2035, by Route of Administration
  • Table 28: South Asia Market Value (USD Million) Analysis 2020 to 2024 and Forecast 2025 to 2035, by Country
  • Table 29: South Asia Market Value (USD Million) Analysis and Forecast 2020 to 2035, by Product
  • Table 30: South Asia Market Volume (Million Units) Analysis and Forecast 2020 to 2035, by Product
  • Table 31: South Asia Market Value (USD Million) Analysis and Forecast 2020 to 2035, by Raw Material
  • Table 32: South Asia Market Value (USD Million) Analysis and Forecast 2020 to 2035, by Application
  • Table 33: South Asia Market Value (USD Million) Analysis and Forecast 2020 to 2035, by End User
  • Table 34: South Asia Market Value (USD Million) Analysis and Forecast 2020 to 2035, by Route of Administration
  • Table 35: East Asia Market Value (USD Million) Analysis 2020 to 2024 and Forecast 2025 to 2035, by Country
  • Table 36: East Asia Market Value (USD Million) Analysis and Forecast 2020 to 2035, by Product
  • Table 37: East Asia Market Volume (Million Units) Analysis and Forecast 2020 to 2035, by Product
  • Table 38: East Asia Market Value (USD Million) Analysis and Forecast 2020 to 2035, by Raw Material
  • Table 39: East Asia Market Value (USD Million) Analysis and Forecast 2020 to 2035, by Application
  • Table 40: East Asia Market Value (USD Million) Analysis and Forecast 2020 to 2035, by End User
  • Table 41: East Asia Market Value (USD Million) Analysis and Forecast 2020 to 2035, by Route of Administration
  • Table 42: Oceania Market Value (USD Million) Analysis 2020 to 2024 and Forecast 2025 to 2035, by Country
  • Table 43: Oceania Market Value (USD Million) Analysis and Forecast 2020 to 2035, by Product
  • Table 44: Oceania Market Volume (Million Units) Analysis and Forecast 2020 to 2035, by Product
  • Table 45: Oceania Market Value (USD Million) Analysis and Forecast 2020 to 2035, by Raw Material
  • Table 46: Oceania Market Value (USD Million) Analysis and Forecast 2020 to 2035, by Application
  • Table 47: Oceania Market Value (USD Million) Analysis and Forecast 2020 to 2035, by End User
  • Table 48: Oceania Market Value (USD Million) Analysis and Forecast 2020 to 2035, by Route of Administration
  • Table 49: Middle East and Africa(MEA) Market Value (USD Million) Analysis 2020 to 2024 and Forecast 2025 to 2035, by Country
  • Table 50: Middle East and Africa(MEA)Market Value (USD Million) Analysis and Forecast 2020 to 2035, by Product
  • Table 51: Middle East and Africa(MEA) Market Volume (Million Units) Analysis and Forecast 2020 to 2035, by Product
  • Table 52: Middle East and Africa(MEA) Market Value (USD Million) Analysis and Forecast 2020 to 2035, by Raw Material
  • Table 53: Middle East and Africa(MEA) Market Value (USD Million) Analysis and Forecast 2020 to 2035, by Application
  • Table 54: Middle East and Africa(MEA) Market Value (USD Million) Analysis and Forecast 2020 to 2035, by End User
  • Table 55: Middle East and Africa(MEA) Market Value (USD Million) Analysis and Forecast 2020 to 2035, by Route of Administration

List of Figures

  • Figure 1: Global Market Volume (Million Units), 2020 to 2024
  • Figure 2: Global Market Volume (Million Units) & Y-o-Y Growth (%) Analysis, 2025 to 2035
  • Figure 3: Pricing Analysis per unit (USD), in 2025
  • Figure 4: Pricing Forecast per unit (USD), in 2035
  • Figure 5: Global Market Value (USD Million) Analysis, 2020 to 2024
  • Figure 6: Global Market Forecast & Y-o-Y Growth, 2025 to 2035
  • Figure 7: Global Market Absolute $ Opportunity (USD Million) Analysis, 2025 to 2035
  • Figure 8: Global Market Value Share (%) Analysis 2025 to 2035, by Product
  • Figure 9: Global Market Y-o-Y Growth (%) Analysis 2025 to 2035, by Product
  • Figure 10: Global Market Attractiveness Analysis 2025 to 2035, by Product
  • Figure 11: Global Market Value Share (%) Analysis 2025 to 2035, by Raw Material
  • Figure 12: Global Market Y-o-Y Growth (%) Analysis 2025 to 2035, by Raw Material
  • Figure 13: Global Market Attractiveness Analysis 2025 to 2035, by Raw Material
  • Figure 14: Global Market Value Share (%) Analysis 2025 to 2035, by Application
  • Figure 15: Global Market Y-o-Y Growth (%) Analysis 2025 to 2035, by Application
  • Figure 16: Global Market Attractiveness Analysis 2025 to 2035, by Application
  • Figure 17: Global Market Value Share (%) Analysis 2025 to 2035, by End User
  • Figure 18: Global Market Y-o-Y Growth (%) Analysis 2025 to 2035, by End User
  • Figure 19: Global Market Attractiveness Analysis 2025 to 2035, by End User
  • Figure 20: Global Market Value Share (%) Analysis 2025 to 2035, by Route of Administration
  • Figure 21: Global Market Y-o-Y Growth (%) Analysis 2025 to 2035, by Route of Administration
  • Figure 22: Global Market Attractiveness Analysis 2025 to 2035, by Route of Administration
  • Figure 23: Global Market Value Share (%) Analysis 2025 to 2035, by Region
  • Figure 24: Global Market Y-o-Y Growth (%) Analysis 2025 to 2035, by Region
  • Figure 25: Global Market Attractiveness Analysis 2025 to 2035, by Region
  • Figure 26: North America Market Value (USD Million) Analysis, 2020 to 2024
  • Figure 27: North America Market Value (USD Million) Forecast, 2025 to 2035
  • Figure 28: North America Market Value Share, by Product (2025 E)
  • Figure 29: North America Market Value Share, by Raw Material (2025 E)
  • Figure 30: North America Market Value Share, by Application (2025 E)
  • Figure 31: North America Market Value Share, by End User (2025 E)
  • Figure 32: North America Market Value Share, by Route of Administration (2025 E)
  • Figure 33: North America Market Value Share, by Country (2025 E)
  • Figure 34: North America Market Attractiveness Analysis by Product, 2025 to 2035
  • Figure 35: North America Market Attractiveness Analysis by Raw Material, 2025 to 2035
  • Figure 36: North America Market Attractiveness Analysis by Application, 2025 to 2035
  • Figure 37: North America Market Attractiveness Analysis by End User, 2025 to 2035
  • Figure 38: North America Market Attractiveness Analysis by Route of Administration, 2025 to 2035
  • Figure 39: North America Market Attractiveness Analysis by Country, 2025 to 2035
  • Figure 40: USA Market Value Proportion Analysis, 2024
  • Figure 41: Global Vs. USA Growth Comparison
  • Figure 42: USA Market Share Analysis (%) by Product, 2025 to 2035
  • Figure 43: USA Market Share Analysis (%) by Raw Material, 2025 to 2035
  • Figure 44: USA Market Share Analysis (%) by Application, 2025 to 2035
  • Figure 45: USA Market Share Analysis (%) by End User, 2025 to 2035
  • Figure 46: USA Market Share Analysis (%) by Route of Administration, 2025 to 2035
  • Figure 47: Canada Market Value Proportion Analysis, 2024
  • Figure 48: Global Vs. Canada. Growth Comparison
  • Figure 49: Canada Market Share Analysis (%) by Product, 2025 to 2035
  • Figure 50: Canada Market Share Analysis (%) by Raw Material, 2025 to 2035
  • Figure 51: Canada Market Share Analysis (%) by Application, 2025 to 2035
  • Figure 52: Canada Market Share Analysis (%) by End User, 2025 to 2035
  • Figure 53: Canada Market Share Analysis (%) by Route of Administration, 2025 to 2035
  • Figure 54: Latin America Market Value (USD Million) Analysis, 2020 to 2024
  • Figure 55: Latin America Market Value (USD Million) Forecast, 2025 to 2035
  • Figure 56: Latin America Market Value Share, by Product (2025 E)
  • Figure 57: Latin America Market Value Share, by Raw Material (2025 E)
  • Figure 58: Latin America Market Value Share, by Application (2025 E)
  • Figure 59: Latin America Market Value Share, by End User (2025 E)
  • Figure 60: Latin America Market Value Share, by Route of Administration (2025 E)
  • Figure 61: Latin America Market Value Share, by Country (2025 E)
  • Figure 62: Latin America Market Attractiveness Analysis by Product, 2025 to 2035
  • Figure 63: Latin America Market Attractiveness Analysis by Raw Material, 2025 to 2035
  • Figure 64: Latin America Market Attractiveness Analysis by Application, 2025 to 2035
  • Figure 65: Latin America Market Attractiveness Analysis by End User, 2025 to 2035
  • Figure 66: Latin America Market Attractiveness Analysis by Route of Administration, 2025 to 2035
  • Figure 67: Latin America Market Attractiveness Analysis by Country, 2025 to 2035
  • Figure 68: Mexico Market Value Proportion Analysis, 2024
  • Figure 69: Global Vs Mexico Growth Comparison
  • Figure 70: Mexico Market Share Analysis (%) by Product, 2025 to 2035
  • Figure 71: Mexico Market Share Analysis (%) by Raw Material, 2025 to 2035
  • Figure 72: Mexico Market Share Analysis (%) by Application, 2025 to 2035
  • Figure 73: Mexico Market Share Analysis (%) by End User, 2025 to 2035
  • Figure 74: Mexico Market Share Analysis (%) by Route of Administration, 2025 to 2035
  • Figure 75: Brazil Market Value Proportion Analysis, 2024
  • Figure 76: Global Vs. Brazil. Growth Comparison
  • Figure 77: Brazil Market Share Analysis (%) by Product, 2025 to 2035
  • Figure 78: Brazil Market Share Analysis (%) by Raw Material, 2025 to 2035
  • Figure 79: Brazil Market Share Analysis (%) by Application, 2025 to 2035
  • Figure 80: Brazil Market Share Analysis (%) by End User, 2025 to 2035
  • Figure 81: Brazil Market Share Analysis (%) by Route of Administration, 2025 to 2035
  • Figure 82: Argentina Market Value Proportion Analysis, 2024
  • Figure 83: Global Vs Argentina Growth Comparison
  • Figure 84: Argentina Market Share Analysis (%) by Product, 2025 to 2035
  • Figure 85: Argentina Market Share Analysis (%) by Raw Material, 2025 to 2035
  • Figure 86: Argentina Market Share Analysis (%) by Application, 2025 to 2035
  • Figure 87: Argentina Market Share Analysis (%) by End User, 2025 to 2035
  • Figure 88: Argentina Market Share Analysis (%) by Route of Administration, 2025 to 2035
  • Figure 89: Europe Market Value (USD Million) Analysis, 2020 to 2024
  • Figure 90: Europe Market Value (USD Million) Forecast, 2025 to 2035
  • Figure 91: Europe Market Value Share, by Product (2025 E)
  • Figure 92: Europe Market Value Share, by Raw Material (2025 E)
  • Figure 93: Europe Market Value Share, by Application (2025 E)
  • Figure 94: Europe Market Value Share, by End User (2025 E)
  • Figure 95: Europe Market Value Share, by Route of Administration (2025 E)
  • Figure 96: Europe Market Value Share, by Country (2025 E)
  • Figure 97: Europe Market Attractiveness Analysis by Product, 2025 to 2035
  • Figure 98: Europe Market Attractiveness Analysis by Raw Material, 2025 to 2035
  • Figure 99: Europe Market Attractiveness Analysis by Application, 2025 to 2035
  • Figure 100: Europe Market Attractiveness Analysis by End User, 2025 to 2035
  • Figure 101: Europe Market Attractiveness Analysis by Route of Administration, 2025 to 2035
  • Figure 102: Europe Market Attractiveness Analysis by Country, 2025 to 2035
  • Figure 103: United KingdomMarket Value Proportion Analysis, 2024
  • Figure 104: Global Vs. United Kingdom Growth Comparison
  • Figure 105: United Kingdom Market Share Analysis (%) by Product, 2025 to 2035
  • Figure 106: United Kingdom Market Share Analysis (%) by Raw Material, 2025 to 2035
  • Figure 107: United Kingdom Market Share Analysis (%) by Application, 2025 to 2035
  • Figure 108: United Kingdom Market Share Analysis (%) by End User, 2025 to 2035
  • Figure 109: United Kingdom Market Share Analysis (%) by Route of Administration, 2025 to 2035
  • Figure 110: Nordic Countries Market Value Proportion Analysis, 2024
  • Figure 111: Global Vs. Nordic Countries Growth Comparison
  • Figure 112: Nordic Countries Market Share Analysis (%) by Product, 2025 to 2035
  • Figure 113: Nordic countries Market Share Analysis (%) by Raw Material, 2025 to 2035
  • Figure 114: Nordic Countries Market Share Analysis (%) by Application, 2025 to 2035
  • Figure 115: Nordic Countries Market Share Analysis (%) by End User, 2025 to 2035
  • Figure 116: Nordic Countries Market Share Analysis (%) by Route of Administration, 2025 to 2035
  • Figure 117: Germany Market Value Proportion Analysis, 2024
  • Figure 118: Global Vs. Germany Growth Comparison
  • Figure 119: Germany Market Share Analysis (%) by Product, 2025 to 2035
  • Figure 120: Germany Market Share Analysis (%) by Raw Material, 2025 to 2035
  • Figure 121: Germany Market Share Analysis (%) by Application, 2025 to 2035
  • Figure 122: Germany Market Share Analysis (%) by End User, 2025 to 2035
  • Figure 123: Germany Market Share Analysis (%) by Route of Administration, 2025 to 2035
  • Figure 124: Italy Market Value Proportion Analysis, 2024
  • Figure 125: Global Vs. Italy Growth Comparison
  • Figure 126: Italy Market Share Analysis (%) by Product, 2025 to 2035
  • Figure 127: Italy Market Share Analysis (%) by Raw Material, 2025 to 2035
  • Figure 128: Italy Market Share Analysis (%) by Application, 2025 to 2035
  • Figure 129: Italy Market Share Analysis (%) by End User, 2025 to 2035
  • Figure 130: Italy Market Share Analysis (%) by Route of Administration, 2025 to 2035
  • Figure 131: France Market Value Proportion Analysis, 2024
  • Figure 132: Global Vs France Growth Comparison
  • Figure 133: France Market Share Analysis (%) by Product, 2025 to 2035
  • Figure 134: France Market Share Analysis (%) by Raw Material, 2025 to 2035
  • Figure 135: France Market Share Analysis (%) by Application, 2025 to 2035
  • Figure 136: France Market Share Analysis (%) by End User, 2025 to 2035
  • Figure 137: France Market Share Analysis (%) by Route of Administration, 2025 to 2035
  • Figure 138: Spain Market Value Proportion Analysis, 2024
  • Figure 139: Global Vs Spain Growth Comparison
  • Figure 140: Spain Market Share Analysis (%) by Product, 2025 to 2035
  • Figure 141: Spain Market Share Analysis (%) by Raw Material, 2025 to 2035
  • Figure 142: Spain Market Share Analysis (%) by Application, 2025 to 2035
  • Figure 143: Spain Market Share Analysis (%) by End User, 2025 to 2035
  • Figure 144: Spain Market Share Analysis (%) by Route of Administration, 2025 to 2035
  • Figure 145: Russia Market Value Proportion Analysis, 2024
  • Figure 146: Global Vs Russia Growth Comparison
  • Figure 147: Russia Market Share Analysis (%) by Product, 2025 to 2035
  • Figure 148: Russia Market Share Analysis (%) by Raw Material, 2025 to 2035
  • Figure 149: Russia Market Share Analysis (%) by Application, 2025 to 2035
  • Figure 150: Russia Market Share Analysis (%) by End User, 2025 to 2035
  • Figure 151: Russia Market Share Analysis (%) by Route of Administration, 2025 to 2035
  • Figure 152: BENELUX Market Value Proportion Analysis, 2024
  • Figure 153: Global Vs BENELUX Growth Comparison
  • Figure 154: BENELUX Market Share Analysis (%) by Product, 2025 to 2035
  • Figure 155: BENELUX Market Share Analysis (%) by Raw Material, 2025 to 2035
  • Figure 156: BENELUX Market Share Analysis (%) by Application, 2025 to 2035
  • Figure 157: BENELUX Market Share Analysis (%) by End User, 2025 to 2035
  • Figure 158: BENELUX Market Share Analysis (%) by Route of Administration, 2025 to 2035
  • Figure 159: East Asia Market Value (USD Million) Analysis, 2020 to 2024
  • Figure 160: East Asia Market Value (USD Million) Forecast, 2025 to 2035
  • Figure 161: East Asia Market Value Share, by Product (2025 E)
  • Figure 162: East Asia Market Value Share, by Raw Material (2025 E)
  • Figure 163: East Asia Market Value Share, by Application (2025 E)
  • Figure 164: East Asia Market Value Share, by End User (2025 E)
  • Figure 165: East Asia Market Value Share, by Route of Administration (2025 E)
  • Figure 166: East Asia Market Value Share, by Country (2025 E)
  • Figure 167: East Asia Market Attractiveness Analysis by Product, 2025 to 2035
  • Figure 168: East Asia Market Attractiveness Analysis by Raw Material, 2025 to 2035
  • Figure 169: East Asia Market Attractiveness Analysis by Application, 2025 to 2035
  • Figure 170: East Asia Market Attractiveness Analysis by End User, 2025 to 2035
  • Figure 171: East Asia Market Attractiveness Analysis by Route of Administration, 2025 to 2035
  • Figure 172: East Asia Market Attractiveness Analysis by Country, 2025 to 2035
  • Figure 173: China Market Value Proportion Analysis, 2024
  • Figure 174: Global Vs. China Growth Comparison
  • Figure 175: China Market Share Analysis (%) by Product, 2025 to 2035
  • Figure 176: China Market Share Analysis (%) by Raw Material, 2025 to 2035
  • Figure 177: China Market Share Analysis (%) by Application, 2025 to 2035
  • Figure 178: China Market Share Analysis (%) by End User, 2025 to 2035
  • Figure 179: China Market Share Analysis (%) by Route of Administration, 2025 to 2035
  • Figure 180: Japan Market Value Proportion Analysis, 2024
  • Figure 181: Global Vs. Japan Growth Comparison
  • Figure 182: Japan Market Share Analysis (%) by Product, 2025 to 2035
  • Figure 183: Japan Market Share Analysis (%) by Raw Material, 2025 to 2035
  • Figure 184: Japan Market Share Analysis (%) by Application, 2025 to 2035
  • Figure 185: Japan Market Share Analysis (%) by End User, 2025 to 2035
  • Figure 186: Japan Market Share Analysis (%) by Route of Administration, 2025 to 2035
  • Figure 187: South Korea Market Value Proportion Analysis, 2024
  • Figure 188: Global Vs South Korea Growth Comparison
  • Figure 189: South Korea Market Share Analysis (%) by Product, 2025 to 2035
  • Figure 190: South Korea Market Share Analysis (%) by Raw Material, 2025 to 2035
  • Figure 191: South Korea Market Share Analysis (%) by Application, 2025 to 2035
  • Figure 192: South Korea Market Share Analysis (%) by End User, 2025 to 2035
  • Figure 193: South Korea Market Share Analysis (%) by Route of Administration, 2025 to 2035
  • Figure 194: South Asia Market Value (USD Million) Analysis, 2020 to 2024
  • Figure 195: South Asia Market Value (USD Million) Forecast, 2025 to 2035
  • Figure 196: South Asia Market Value Share, by Product (2025 E)
  • Figure 197: South Asia Market Value Share, by Raw Material (2025 E)
  • Figure 198: South Asia Market Value Share, by Application (2025 E)
  • Figure 199: South Asia Market Value Share, by End User (2025 E)
  • Figure 200: South Asia Market Value Share, by Route of Administration (2025 E)
  • Figure 201: South Asia Market Value Share, by Country (2025 E)
  • Figure 202: South Asia Market Attractiveness Analysis by Product, 2025 to 2035
  • Figure 203: South Asia Market Attractiveness Analysis by Raw Material, 2025 to 2035
  • Figure 204: South Asia Market Attractiveness Analysis by Application, 2025 to 2035
  • Figure 205: South Asia Market Attractiveness Analysis by End User, 2025 to 2035
  • Figure 206: South Asia Market Attractiveness Analysis by Route of Administration, 2025 to 2035
  • Figure 207: South Asia Market Attractiveness Analysis by Country, 2025 to 2035
  • Figure 208: India Market Value Proportion Analysis, 2024
  • Figure 209: Global Vs. India Growth Comparison
  • Figure 210: India Market Share Analysis (%) by Product, 2025 to 2035
  • Figure 211: India Market Share Analysis (%) by Raw Material, 2025 to 2035
  • Figure 212: India Market Share Analysis (%) by Application, 2025 to 2035
  • Figure 213: India Market Share Analysis (%) by End User, 2025 to 2035
  • Figure 214: India Market Share Analysis (%) by Route of Administration, 2025 to 2035
  • Figure 215: Indonesia Market Value Proportion Analysis, 2024
  • Figure 216: Global Vs. Indonesia Growth Comparison
  • Figure 217: Indonesia Market Share Analysis (%) by Product, 2025 to 2035
  • Figure 218: Indonesia Market Share Analysis (%) by Raw Material, 2025 to 2035
  • Figure 219: Indonesia Market Share Analysis (%) by Application, 2025 to 2035
  • Figure 220: Indonesia Market Share Analysis (%) by End User, 2025 to 2035
  • Figure 221: Indonesia Market Share Analysis (%) by Route of Administration, 2025 to 2035
  • Figure 222: Malaysia Market Value Proportion Analysis, 2024
  • Figure 223: Global Vs. Malaysia Growth Comparison
  • Figure 224: Malaysia Market Share Analysis (%) by Product, 2025 to 2035
  • Figure 225: Malaysia Market Share Analysis (%) by Raw Material, 2025 to 2035
  • Figure 226: Malaysia Market Share Analysis (%) by Application, 2025 to 2035
  • Figure 227: Malaysia Market Share Analysis (%) by End User, 2025 to 2035
  • Figure 228: Malaysia Market Share Analysis (%) by Route of Administration, 2025 to 2035
  • Figure 229: Thailand Market Value Proportion Analysis, 2024
  • Figure 230: Global Vs. Thailand Growth Comparison
  • Figure 231: Thailand Market Share Analysis (%) by Product, 2025 to 2035
  • Figure 232: Thailand Market Share Analysis (%) by Raw Material, 2025 to 2035
  • Figure 233: Thailand Market Share Analysis (%) by Application, 2025 to 2035
  • Figure 234: Thailand Market Share Analysis (%) by End User, 2025 to 2035
  • Figure 235: Thailand Market Share Analysis (%) by Route of Administration, 2025 to 2035
  • Figure 236: Oceania Market Value (USD Million) Analysis, 2020 to 2024
  • Figure 237: Oceania Market Value (USD Million) Forecast, 2025 to 2035
  • Figure 238: Oceania Market Value Share, by Product (2025 E)
  • Figure 239: Oceania Market Value Share, by Raw Material (2025 E)
  • Figure 240: Oceania Market Value Share, by Application (2025 E)
  • Figure 241: Oceania Market Value Share, by End User (2025 E)
  • Figure 242: Oceania Market Value Share, by Route of Administration (2025 E)
  • Figure 243: Oceania Market Value Share, by Country (2025 E)
  • Figure 244: Oceania Market Attractiveness Analysis by Product, 2025 to 2035
  • Figure 245: Oceania Market Attractiveness Analysis by Raw Material, 2025 to 2035
  • Figure 246: Oceania Market Attractiveness Analysis by Application, 2025 to 2035
  • Figure 247: Oceania Market Attractiveness Analysis by End User, 2025 to 2035
  • Figure 248: Oceania Market Attractiveness Analysis by Route of Administration, 2025 to 2035
  • Figure 249: Oceania Market Attractiveness Analysis by Country, 2025 to 2035
  • Figure 250: Australia Market Value Proportion Analysis, 2024
  • Figure 251: Global Vs. Australia Growth Comparison
  • Figure 252: Australia Market Share Analysis (%) by Product, 2025 to 2035
  • Figure 253: Australia Market Share Analysis (%) by Raw Material, 2025 to 2035
  • Figure 254: Australia Market Share Analysis (%) by Application, 2025 to 2035
  • Figure 255: Australia Market Share Analysis (%) by End User, 2025 to 2035
  • Figure 256: Australia Market Share Analysis (%) by Route of Administration, 2025 to 2035
  • Figure 257: New Zealand Market Value Proportion Analysis, 2024
  • Figure 258: Global Vs New Zealand Growth Comparison
  • Figure 259: New Zealand Market Share Analysis (%) by Product, 2025 to 2035
  • Figure 260: New Zealand Market Share Analysis (%) by Raw Material, 2025 to 2035
  • Figure 261: New Zealand Market Share Analysis (%) by Application, 2025 to 2035
  • Figure 262: New Zealand Market Share Analysis (%) by End User, 2025 to 2035
  • Figure 263: New Zealand Market Share Analysis (%) by Route of Administration, 2025 to 2035
  • Figure 264: Middle East & Africa Market Value (USD Million) Analysis, 2020 to 2024
  • Figure 265: Middle East & Africa Market Value (USD Million) Forecast, 2025 to 2035
  • Figure 266: Middle East & Africa Market Value Share, by Product (2025 E)
  • Figure 267: Middle East & Africa Market Value Share, by Raw Material (2025 E)
  • Figure 268: Middle East & Africa Market Value Share, by Application (2025 E)
  • Figure 269: Middle East & Africa Market Value Share, by End User (2025 E)
  • Figure 270: Middle East & Africa Market Value Share, by Route of Administration (2025 E)
  • Figure 271: Middle East & Africa Market Value Share, by Country (2025 E)
  • Figure 272: Middle East & Africa Market Attractiveness Analysis by Product, 2025 to 2035
  • Figure 273: Middle East & Africa Market Attractiveness Analysis by Raw Material, 2025 to 2035
  • Figure 274: Middle East & Africa Market Attractiveness Analysis by Application, 2025 to 2035
  • Figure 275: Middle East & Africa Market Attractiveness Analysis by End User, 2025 to 2035
  • Figure 276: Middle East & Africa Market Attractiveness Analysis by Route of Administration, 2025 to 2035
  • Figure 277: Middle East & Africa Market Attractiveness Analysis by Country, 2025 to 2035
  • Figure 278: GCC Countries Market Value Proportion Analysis, 2024
  • Figure 279: Global Vs GCC Countries Growth Comparison
  • Figure 280: GCC Countries Market Share Analysis (%) by Product, 2025 to 2035
  • Figure 281: GCC Countries Market Share Analysis (%) by Raw Material, 2025 to 2035
  • Figure 282: GCC Countries Market Share Analysis (%) by Application, 2025 to 2035
  • Figure 283: GCC Countries Market Share Analysis (%) by End User, 2025 to 2035
  • Figure 284: GCC Countries Market Share Analysis (%) by Route of Administration, 2025 to 2035
  • Figure 285: Turkey Market Value Proportion Analysis, 2024
  • Figure 286: Global Vs. Turkey Growth Comparison
  • Figure 287: Turkey Market Share Analysis (%) by Product, 2025 to 2035
  • Figure 288: Turkey Market Share Analysis (%) by Raw Material, 2025 to 2035
  • Figure 289: Turkey Market Share Analysis (%) by Application, 2025 to 2035
  • Figure 290: Turkey Market Share Analysis (%) by End User, 2025 to 2035
  • Figure 291: Turkey Market Share Analysis (%) by Route of Administration, 2025 to 2035
  • Figure 292: South Africa Market Value Proportion Analysis, 2024
  • Figure 293: Global Vs. South Africa Growth Comparison
  • Figure 294: South Africa Market Share Analysis (%) by Product, 2025 to 2035
  • Figure 295: South Africa Market Share Analysis (%) by Raw Material, 2025 to 2035
  • Figure 296: South Africa Market Share Analysis (%) by Application, 2025 to 2035
  • Figure 297: South Africa Market Share Analysis (%) by End User, 2025 to 2035
  • Figure 298: South Africa Market Share Analysis (%) by Route of Administration, 2025 to 2035
  • Figure 299: North Africa Market Value Proportion Analysis, 2024
  • Figure 300: Global Vs North Africa Growth Comparison
  • Figure 301: Israel Market Share Analysis (%) by Product, 2025 to 2035
  • Figure 302: Israel Market Share Analysis (%) by Raw Material, 2025 to 2035
  • Figure 303: Israel Market Share Analysis (%) by Application, 2025 to 2035
  • Figure 304: Israel Market Share Analysis (%) by End User, 2025 to 2035
  • Figure 305: Israel Market Share Analysis (%) by Route of Administration, 2025 to 2035

Frequently Asked Questions

What was the overall size of the softgel capsules market in 2025?

The overall market size for the softgel capsules market was USD 1,245.3 million in 2025.

How big is the softgel capsules market expected to be in 2035?

The softgel capsules market is expected to reach USD 2,209.2 million in 2035.

What will drive the demand for the softgel capsules market during the forecast period?

The increasing demand for easy-to-swallow drug delivery forms, rising adoption in nutraceuticals and pharmaceuticals, and growing use of gelatin-based softgels, especially type-B gelatin, fuel the softgel capsules market during the forecast period.

List the top 5 countries contributing to the softgel capsules market.

The top 5 countries driving the development of the softgel capsules market are the USA, UK, European Union, Japan, and South Korea.

Which segment in type is expected to lead in the softgel capsules market?

Gelatin-based softgels and type-B gelatin lead market growth to command a significant share over the assessment period.

Explore Similar Insights

Future Market Insights

Softgel Capsules Market