Cryogenic Capsules Market Size, Share & Forecast 2025 to 2035

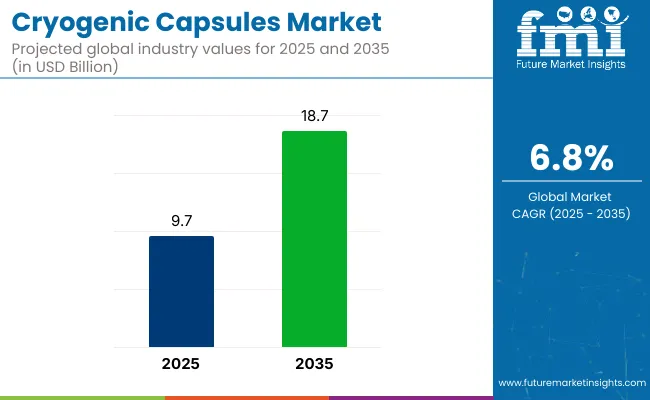
The cryogenic capsules market is projected to grow from USD 9.7 billion in 2025 to USD 18.7 billion by 2035, registering a CAGR of 6.8% during the forecast period. Sales in 2024 reached USD 9.0 billion, reflecting steady growth driven by increasing demand for efficient and secure storage solutions in various industries.
Quick Stats of Cryogenic Capsules Market

  • Market Value (2025): USD 9.7 billion
  • Forecast Value (2035): USD 18.7 billion
  • Forecast CAGR: 6.8%
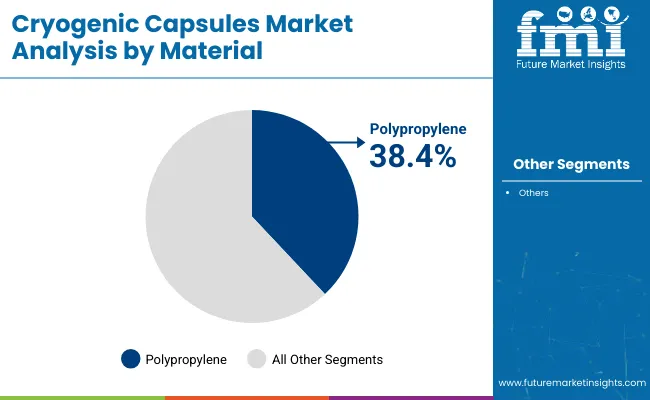
  • Material Leader in 2025: Polypropylene (PP) (38.4% market share)
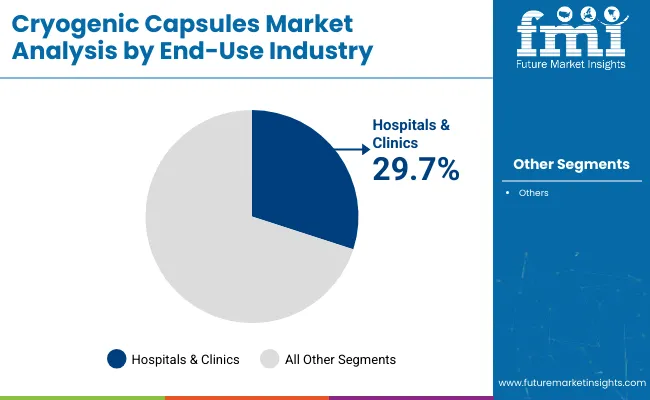
  • Top End-Use Industry: Hospitals and clinics (29.7% share)
  • Key Growth Region: North America (USA is the fastest-growing market with 9.3% CAGR)

Cryogenic Capsules Market

Metric Value
Industry Size (2025E) USD 9.7 billion
Industry Value (2035F) USD 18.7 billion
CAGR (2025 to 2035) 6.8%

This growth is attributed to advancements in cryopreservation technologies, wider application in biomedical research, and growing demand for long-term preservation of biological assets. The market's expansion is further supported by innovations in capsule designs and materials, enhancing their durability and appeal to various end-users.

In June 2025, Cryogenmash intends to expand its presence in China and introduce innovative gas equipment to the market. "More than 2000 expander units manufactured by Cryogenmash are already operating in 25 countries of the world - both as part of cryogenic units and as stand-alone equipment, and all of them have proven themselves from the best side.

We hope that the new products in the line of Cryogenmash turboexpanders will also be able to gain the trust of customers in the international market," said Evgeny Matveev, General Director of Cryogenmash JSC. He noted that today Cryogenmash presents a new type of product that is in demand on the world market - highly efficient turboexpander units created using its own technologies and manufactured at Russian production.

Environmental considerations are playing an increasingly important role in the cryogenic capsules market, prompting manufacturers to prioritize the use of recyclable and eco-friendly materials. Recent innovations feature the creation of lightweight yet robust capsules, the incorporation of smart technologies like temperature monitoring sensors, and ergonomic designs that improve user comfort.

These advancements align with global sustainability goals and regulatory requirements, making cryogenic capsules an attractive option for environmentally conscious consumers. Additionally, the development of modular and customizable storage solutions has enhanced efficiency and convenience for users, further driving market growth.

The cryogenic capsules market is set to experience substantial expansion, fueled by rising needs for reliable and efficient storage solutions across the healthcare, biotechnology, and aerospace sectors. Companies investing in innovative, eco-friendly technologies are expected to gain a competitive edge.

The market's expansion is further supported by the growing focus on regenerative medicine, personalized therapies, and space exploration. With continuous advancements in materials and manufacturing processes, the cryogenic capsules market is set to offer lucrative opportunities for stakeholders over the forecast period.

Analyzing Cryogenic Capsules Market by Top Investment Segment

The market is segmented by material, end-use industry, and region. By material, the market includes polypropylene, polyethylene, stainless steel, aluminum, borosilicate glass, and fluoropolymers such as PTFE-coated materials.

In terms of end-use industry, the market is categorized into hospitals & clinics, biobanks & cryo banks, research laboratories, pharmaceutical & biotech companies, academic institutes, and IVF & fertility centers. Regionally, the market is analyzed across North America, Latin America, East Asia, South Asia & Pacific, Eastern Europe, Western Europe, Oceania, and the Middle East & Africa.
Hospitals & Clinics Lead in Cryogenic Capsule Adoption for Patient Care

Cryogenic Capsules Market Analysis By End Use Industry

The hospitals and clinics sector has been projected to hold 29.7% of the global cryogenic capsules market by 2025, driven by the rising demand for cryogenic storage solutions in patient care, such as the preservation of biological samples, blood, and tissue for medical procedures.

Hospitals increasingly rely on cryogenic capsules for the safe transportation and long-term storage of critical biological specimens used in diagnostics, organ transplants, and fertility treatments. The convenience of cryogenic capsules in providing secure, temperature-stable environments has made them the preferred choice for sensitive medical applications. These solutions have been integrated into tissue banks, organ preservation programs, and fertility clinics, where maintaining sample viability is critical for successful outcomes.

Growing emphasis on personalized medicine and regenerative therapies has further increased the demand for cryogenic storage in hospitals, particularly for stem cell research and gene therapy applications. Technological advancements in capsule materials and sealing mechanisms have also contributed to increased reliability and ease of use in healthcare facilities.

Hospitals and clinics have responded to regulatory pressures for stringent quality controls by incorporating more sophisticated cryogenic capsule technologies, aligning with accreditation requirements in the medical and healthcare industries.
Polypropylene Preferred for Cost-Effective and High-Performance Cryogenic Storage

Cryogenic Capsules Market Analysis By Material

Polypropylene (PP) cryogenic capsules have been estimated to account for 38.4% of the global cryogenic capsules market by 2025, driven by their high chemical resistance, low moisture absorption, and ability to withstand extreme temperatures. PP's ability to maintain structural integrity in low-temperature environments has made it a popular choice for cryogenic storage applications in both medical and scientific sectors.

Polypropylene capsules are widely used for the storage and transportation of biological samples, stem cells, and vaccines, benefiting from their high strength-to-weight ratio and ease of molding into various formats, such as vials and ampoules. These features enable cost-efficient production, especially in high-volume settings.

The pharmaceutical, biotechnology, and healthcare sectors have increasingly adopted PP capsules due to their versatility, non-reactivity with stored samples, and ability to maintain sample stability for extended periods. They have also been preferred for their compatibility with standard cryogenic storage systems, which has contributed to their widespread use across hospitals, research laboratories, and biobanks.

Environmental considerations have driven the adoption of recyclable polypropylene formulations, further enhancing sustainability in the cryogenic storage sector. Investment in high-throughput cryopreservation facilities has also spurred demand for polypropylene capsules, as their affordability and durability meet the needs of both clinical and research-based cryogenic applications.

Challenges and Opportunities

Challenge

Structural Integrity at Ultra-Low Temperatures

Structural integrity at cryogenic temperatures is the primary challenge in the manufacture of cryogenic capsules. Thermal shock induces material expansion and contraction and creates microfractures in capsules. It is harmful to the safety of stored biological material, especially in long-duration space missions and deep-freeze medicine applications. Nano-reinforced composite materials are being researched by manufacturers that not only reinforce them but also reduce the thermal stress effect.

Opportunity

Smart Cryogenic Capsule Design

The greatest market opportunity of the industry is building cryogenic capsules intelligent with real-time tracking. Space-based or pharmaceutical cold chain cryogenic storage is the ideal use of the capsules because heavy demand exists for accuracy tracking on these.

Capsules of the future are constructed from IoT sensors that monitor real-time internal pressure, temperature, and integrity of samples. Such companies as BioPreserve Innovations and CryoTech Solutions are paving the way for the introduction of AI-regulated cryogenic management systems for storage condition improvement and temperature fluctuation evasion.

Country Wise Outlook

United States

The United States has also experienced continuous growth in the field of cryogenic capsules since industries have opened within the pharmaceutical industry as well as the biotechnology industry. Growing interest in the business of personalized medicine and regenerative therapy has developed a new demand in the field of cryogenic storage. Hydrogen fuel and LNG and LNG pressure have also compelled the energy sector to be fashionable in the direction of demand for cryogenic storage with high-end.

The USA biopharmaceutical industry, which has approximately USD 625 billion, depends on cryogenic capsules to store medicine and biological samples. Hydrogen infrastructure investments following the nation's embrace of renewable resources have boosted the industry of cryogenic capsules in capacity. NASA Artemis mission aims to reinstate human beings onto the Moon, too, again prompting more cryogenic fuel space storage technology.

Country CAGR (2025 to 2035)
USA 6.2%

United Kingdom

A strong healthcare economy and research culture have driven UK demand for the cryogenic capsule market. Demand for regenerative medicine and biobanking generated a need to possess cutting-edge cryogenic storage technology. The UK's carbon footprint reduction drive also spurred LNG and hydrogen energy plans, which demand effective cryogenic storage.

UK's biobanking industry, with more than 20 million biological samples in storage, needs reliable cryogenic capsules. The government's aspiration to be net-zero carbon by 2050 has triggered unprecedented investment in hydrogen power, propelling the market further. UK Space Agency's plans for pioneering commercial spaceflight also generate demand for cryogenic fuel storage.

Country CAGR (2025 to 2035)
UK 6.8%

European Union

Stringent environmental laws and high sustainability demands drive the European Union cryogenic capsule market. Healthcare sector growth and efforts towards alternative energy have boosted demand for innovative cryogenic storage. France and Germany are at the forefront of market growth as pioneers of biotechnology advancements and LNG network expansion.

The Horizon Europe program of EU funding puts €95.5 billion into research and innovation to advance cryogenic storage to the vanguard of science. The EU's climate strategy, with a 55% cut in greenhouse gases by 2030, has been propelling hydrogen energy initiatives, and they are the strongest driver of higher levels of hydrogen demand for cryogenic storage. Mars and the European Space Agency's far-side mission also demands established cryogenic fuel storage.

Region CAGR (2025 to 2035)
European Union 6.5%

Japan

The Japanese market for cryogenic capsules has expanded with increased medical research and more focus on clean energy. Japanese investment in hydrogen as an energy source without pollution has resulted in greater demand for advanced cryogenic storage technology. Japanese space exploration is also the cause for the expansion of the market.

The strategy of Japan in developing Basic Hydrogen is to construct a hydrogen society, and, therefore, the massive investment will be on the production and storage of hydrogen-like cryogenic capsules. The lunar missions by the Japanese Aerospace Exploration Agency (JAXA) necessitate upper-class technology in cryogenic fuel storage. Otherwise, the age problem of the Japanese population results in the generation of regenerative medicine, thereby demanding the use of cryogenic storage for biological samples.

Country CAGR (2025 to 2035)
Japan 6.6%

Competitive Outlook

The cryogenic capsule market is a competitive arena dominated by massive global industry players and regional manufacturers fulfilling their share in technological advancement and industrial growth. Some massive players have dominating market shares with emphasis on long-term cryopreservation, bio-storage technology, and uses in space travel.

They are concentrated on material stability, high-end insulation technology, and compliance with regulations to emerge as market leaders. The sector consists of start-ups and incumbents, both of which are shaping the future of the industry through investments in research and product development.

Key Players

  • Thermo Fisher Scientific Inc.
  • Panasonic Healthcare Holdings Co., Ltd.
  • Worthington Industries
  • BioCision LLC
  • Haier Biomedical
  • Praxair Technology Inc.
  • Custom Biogenic Systems

Key Segmentation

By Type:

  • Open Cryogenic Capsules
  • Closed/Sealed Cryogenic Capsule
  • Programmable Cryogenic Capsules
  • Smart Capsule Systems (with sensors or trackers)

By Material:

  • Polypropylene
  • Polyethylene
  • Stainless Steel
  • Aluminum
  • Borosilicate Glass
  • Fluoropolymers (e.g., PTFE-coated)

By Storage Temperature:

  • Ultra-Low (-80°C to -196°C)
  • Liquid Nitrogen (-196°C)
  • Vapor Phase Cryogenic

By End-Use Industry:

  • Hospitals & Clinics
  • Biobanks & Cryobanks
  • Research Laboratories
  • Pharmaceutical & Biotech Companies
  • Academic Institutes
  • IVF & Fertility Centers

By Region:

  • North America
  • Latin America
  • East Asia
  • South Asia & Pacific
  • Eastern Europe
  • Western Europe
  • Oceania
  • Middle East & Africa

Table of Content

  1. Executive Summary
    • Global Market Outlook
    • Demand-side Trends
    • Supply-side Trends
    • Technology Roadmap Analysis
    • Analysis and Recommendations
  2. Market Overview
    • Market Coverage/Taxonomy
    • Market Definition/Scope/Limitations
  3. Market Background
    • Market Dynamics
      • Drivers
      • Restraints
      • Opportunity
      • Trends
    • Scenario Forecast
      • Demand in Optimistic Scenario
      • Demand in Likely Scenario
      • Demand in Conservative Scenario
    • Opportunity Map Analysis
    • Product Life Cycle Analysis
    • Supply Chain Analysis
      • Supply Side Participants and their Roles
        • Producers
        • Mid-Level Participants (Traders/ Agents/ Brokers)
        • Wholesalers and Distributors
      • Value Added and Value Created at Node in the Supply Chain
      • List of Raw Material Suppliers
      • List of Existing and Potential Buyer’s
    • Investment Feasibility Matrix
    • Value Chain Analysis
      • Profit Margin Analysis
      • Wholesalers and Distributors
      • Retailers
    • PESTLE and Porter’s Analysis
    • Regulatory Landscape
      • By Key Regions
      • By Key Countries
    • Regional Parent Market Outlook
    • Production and Consumption Statistics
    • Import and Export Statistics
  4. Global Market Analysis 2020 to 2024 and Forecast, 2025 to 2035
    • Historical Market Size Value (USD Billion) & Volume (Units) Analysis, 2020 to 2024
    • Current and Future Market Size Value (USD Billion) & Volume (Units) Projections, 2025 to 2035
      • Y-o-Y Growth Trend Analysis
      • Absolute $ Opportunity Analysis
  5. Global Market Pricing Analysis 2020 to 2024 and Forecast 2025 to 2035
  6. Global Market Analysis 2020 to 2024 and Forecast 2025 to 2035, By Type
    • Introduction/Key Findings
    • Historical Market Size Value (USD Billion) & Volume (Units) Analysis By Type, 2020 to 2024
    • Current and Future Market Size Value (USD Billion) & Volume (Units) Analysis and Forecast By Type, 2025 to 2035
      • Open Cryogenic Capsules
      • Closed/Sealed Cryogenic Capsule
      • Programmable Cryogenic Capsules
      • Smart Capsule Systems (with sensors or trackers)
    • Y-o-Y Growth Trend Analysis By Type, 2020 to 2024
    • Absolute $ Opportunity Analysis By Type, 2025 to 2035
  7. Global Market Analysis 2020 to 2024 and Forecast 2025 to 2035, By Material
    • Introduction/Key Findings
    • Historical Market Size Value (USD Billion) & Volume (Units) Analysis By Material, 2020 to 2024
    • Current and Future Market Size Value (USD Billion) & Volume (Units) Analysis and Forecast By Material, 2025 to 2035
      • Polypropylene
      • Polyethylene
      • Stainless Steel
      • Aluminum
      • Borosilicate Glass
      • Fluoropolymers (e.g., PTFE-coated)
    • Y-o-Y Growth Trend Analysis By Material, 2020 to 2024
    • Absolute $ Opportunity Analysis By Material, 2025 to 2035
  8. Global Market Analysis 2020 to 2024 and Forecast 2025 to 2035, By Storage Temperature
    • Introduction/Key Findings
    • Historical Market Size Value (USD Billion) & Volume (Units) Analysis By Storage Temperature, 2020 to 2024
    • Current and Future Market Size Value (USD Billion) & Volume (Units) Analysis and Forecast By Storage Temperature, 2025 to 2035
      • Ultra-Low (-80°C to -196°C)
      • Liquid Nitrogen (-196°C)
      • Vapor Phase Cryogenic
    • Y-o-Y Growth Trend Analysis By Storage Temperature, 2020 to 2024
    • Absolute $ Opportunity Analysis By Storage Temperature, 2025 to 2035
  9. Global Market Analysis 2020 to 2024 and Forecast 2025 to 2035, By End-Use Industry
    • Introduction/Key Findings
    • Historical Market Size Value (USD Billion) & Volume (Units) Analysis By End-Use Industry, 2020 to 2024
    • Current and Future Market Size Value (USD Billion) & Volume (Units) Analysis and Forecast By End-Use Industry, 2025 to 2035
      • Hospitals & Clinics
      • Biobanks & Cryobanks
      • Research Laboratories
      • Pharmaceutical & Biotech Companies
      • Academic Institutes
      • IVF & Fertility Centers
    • Y-o-Y Growth Trend Analysis By End-Use Industry, 2020 to 2024
    • Absolute $ Opportunity Analysis By End-Use Industry, 2025 to 2035
  10. Global Market Analysis 2020 to 2024 and Forecast 2025 to 2035, By Region
    • Introduction
    • Historical Market Size Value (USD Billion) & Volume (Units) Analysis By Region, 2020 to 2024
    • Current Market Size Value (USD Billion) & Volume (Units) Analysis and Forecast By Region, 2025 to 2035
      • North America
      • Latin America
      • Europe
      • East Asia
      • South Asia
      • Oceania
      • MEA
    • Market Attractiveness Analysis By Region
  11. North America Market Analysis 2020 to 2024 and Forecast 2025 to 2035, By Country
    • Historical Market Size Value (USD Billion) & Volume (Units) Trend Analysis By Market Taxonomy, 2020 to 2024
    • Market Size Value (USD Billion) & Volume (Units) Forecast By Market Taxonomy, 2025 to 2035
      • By Country
        • USA
        • Canada
      • By Type
      • By Material
      • By Storage Temperature
      • By End-Use Industry
    • Market Attractiveness Analysis
      • By Country
      • By Type
      • By Material
      • By Storage Temperature
      • By End-Use Industry
    • Key Takeaways
  12. Latin America Market Analysis 2020 to 2024 and Forecast 2025 to 2035, By Country
    • Historical Market Size Value (USD Billion) & Volume (Units) Trend Analysis By Market Taxonomy, 2020 to 2024
    • Market Size Value (USD Billion) & Volume (Units) Forecast By Market Taxonomy, 2025 to 2035
      • By Country
        • Brazil
        • Mexico
        • Argentina
        • Chile
        • Peru
        • Rest of Latin America
      • By Type
      • By Material
      • By Storage Temperature
      • By End-Use Industry
    • Market Attractiveness Analysis
      • By Country
      • By Type
      • By Material
      • By Storage Temperature
      • By End-Use Industry
    • Key Takeaways
  13. Europe Market Analysis 2020 to 2024 and Forecast 2025 to 2035, By Country
    • Historical Market Size Value (USD Billion) & Volume (Units) Trend Analysis By Market Taxonomy, 2020 to 2024
    • Market Size Value (USD Billion) & Volume (Units) Forecast By Market Taxonomy, 2025 to 2035
      • By Country
        • Germany
        • Italy
        • France
        • UK
        • Spain
        • Russia
        • BENELUX
        • Rest of Europe
      • By Type
      • By Material
      • By Storage Temperature
      • By End-Use Industry
    • Market Attractiveness Analysis
      • By Country
      • By Type
      • By Material
      • By Storage Temperature
      • By End-Use Industry
    • Key Takeaways
  14. East Asia Market Analysis 2020 to 2024 and Forecast 2025 to 2035, By Country
    • Historical Market Size Value (USD Billion) & Volume (Units) Trend Analysis By Market Taxonomy, 2020 to 2024
    • Market Size Value (USD Billion) & Volume (Units) Forecast By Market Taxonomy, 2025 to 2035
      • By Country
        • China
        • Japan
        • South Korea
      • By Type
      • By Material
      • By Storage Temperature
      • By End-Use Industry
    • Market Attractiveness Analysis
      • By Country
      • By Type
      • By Material
      • By Storage Temperature
      • By End-Use Industry
    • Key Takeaways
  15. South Asia Market Analysis 2020 to 2024 and Forecast 2025 to 2035, By Country
    • Historical Market Size Value (USD Billion) & Volume (Units) Trend Analysis By Market Taxonomy, 2020 to 2024
    • Market Size Value (USD Billion) & Volume (Units) Forecast By Market Taxonomy, 2025 to 2035
      • By Country
        • India
        • Thailand
        • Malaysia
        • Indonesia
        • Rest of South Asia
      • By Type
      • By Material
      • By Storage Temperature
      • By End-Use Industry
    • Market Attractiveness Analysis
      • By Country
      • By Type
      • By Material
      • By Storage Temperature
      • By End-Use Industry
    • Key Takeaways
  16. Oceania Market Analysis 2020 to 2024 and Forecast 2025 to 2035, By Country
    • Historical Market Size Value (USD Billion) & Volume (Units) Trend Analysis By Market Taxonomy, 2020 to 2024
    • Market Size Value (USD Billion) & Volume (Units) Forecast By Market Taxonomy, 2025 to 2035
      • By Country
        • Australia
        • New Zealand
      • By Type
      • By Material
      • By Storage Temperature
      • By End-Use Industry
    • Market Attractiveness Analysis
      • By Country
      • By Type
      • By Material
      • By Storage Temperature
      • By End-Use Industry
    • Key Takeaways
  17. MEA Market Analysis 2020 to 2024 and Forecast 2025 to 2035, By Country
    • Historical Market Size Value (USD Billion) & Volume (Units) Trend Analysis By Market Taxonomy, 2020 to 2024
    • Market Size Value (USD Billion) & Volume (Units) Forecast By Market Taxonomy, 2025 to 2035
      • By Country
        • GCC
        • Rest of MEA
      • By Type
      • By Material
      • By Storage Temperature
      • By End-Use Industry
    • Market Attractiveness Analysis
      • By Country
      • By Type
      • By Material
      • By Storage Temperature
      • By End-Use Industry
    • Key Takeaways
  18. Key Countries Market Analysis
    • USA
      • Pricing Analysis
      • Market Share Analysis, 2024
        • By Type
        • By Material
        • By Storage Temperature
        • By End-Use Industry
    • Canada
      • Pricing Analysis
      • Market Share Analysis, 2024
        • By Type
        • By Material
        • By Storage Temperature
        • By End-Use Industry
    • Brazil
      • Pricing Analysis
      • Market Share Analysis, 2024
        • By Type
        • By Material
        • By Storage Temperature
        • By End-Use Industry
    • Mexico
      • Pricing Analysis
      • Market Share Analysis, 2024
        • By Type
        • By Material
        • By Storage Temperature
        • By End-Use Industry
    • Argentina
      • Pricing Analysis
      • Market Share Analysis, 2024
        • By Type
        • By Material
        • By Storage Temperature
        • By End-Use Industry
  19. Market Structure Analysis
    • Competition Dashboard
    • Competition Benchmarking
    • Market Share Analysis of Top Players
      • By Regional
      • By Type
      • By Material
      • By Storage Temperature
      • By End-Use Industry
  20. Competition Analysis
    • Competition Deep Dive
      • Thermo Fisher Scientific
        • Overview
        • Product Portfolio
        • Profitability by Market Segments (Product/Age /Sales Channel/Region)
        • Sales Footprint
        • Strategy Overview
          • Marketing Strategy
          • Product Strategy
          • Channel Strategy
      • Corning Incorporated
        • Overview
        • Product Portfolio
        • Profitability by Market Segments (Product/Age /Sales Channel/Region)
        • Sales Footprint
        • Strategy Overview
          • Marketing Strategy
          • Product Strategy
          • Channel Strategy
      • Sigma-Aldrich Corporation
        • Overview
        • Product Portfolio
        • Profitability by Market Segments (Product/Age /Sales Channel/Region)
        • Sales Footprint
        • Strategy Overview
          • Marketing Strategy
          • Product Strategy
          • Channel Strategy
      • Heathrow Scientific
        • Overview
        • Product Portfolio
        • Profitability by Market Segments (Product/Age /Sales Channel/Region)
        • Sales Footprint
        • Strategy Overview
          • Marketing Strategy
          • Product Strategy
          • Channel Strategy
      • Globe Scientific
        • Overview
        • Product Portfolio
        • Profitability by Market Segments (Product/Age /Sales Channel/Region)
        • Sales Footprint
        • Strategy Overview
          • Marketing Strategy
          • Product Strategy
          • Channel Strategy
      • Starlab International GmbH
        • Overview
        • Product Portfolio
        • Profitability by Market Segments (Product/Age /Sales Channel/Region)
        • Sales Footprint
        • Strategy Overview
          • Marketing Strategy
          • Product Strategy
          • Channel Strategy
      • Sumitomo Bakelite
        • Overview
        • Product Portfolio
        • Profitability by Market Segments (Product/Age /Sales Channel/Region)
        • Sales Footprint
        • Strategy Overview
          • Marketing Strategy
          • Product Strategy
          • Channel Strategy
      • E and K Scientific Products
        • Overview
        • Product Portfolio
        • Profitability by Market Segments (Product/Age /Sales Channel/Region)
        • Sales Footprint
        • Strategy Overview
          • Marketing Strategy
          • Product Strategy
          • Channel Strategy
      • Capp ApS
        • Overview
        • Product Portfolio
        • Profitability by Market Segments (Product/Age /Sales Channel/Region)
        • Sales Footprint
        • Strategy Overview
          • Marketing Strategy
          • Product Strategy
          • Channel Strategy
      • Argos Technologies
        • Overview
        • Product Portfolio
        • Profitability by Market Segments (Product/Age /Sales Channel/Region)
        • Sales Footprint
        • Strategy Overview
          • Marketing Strategy
          • Product Strategy
          • Channel Strategy
  21. Assumptions & Acronyms Used
  22. Research Methodology

List of Tables

  • Table 1: Global Market Value (USD Billion) Forecast by Region, 2020-2035
  • Table 2: Global Market Volume (Units) Forecast by Region, 2020-2035
  • Table 3: Global Market Value (USD Billion) Forecast by Type, 2020-2035
  • Table 4: Global Market Volume (Units) Forecast by Type, 2020-2035
  • Table 5: Global Market Value (USD Billion) Forecast by Material, 2020-2035
  • Table 6: Global Market Volume (Units) Forecast by Material, 2020-2035
  • Table 7: Global Market Value (USD Billion) Forecast by Storage Temperature, 2020-2035
  • Table 8: Global Market Volume (Units) Forecast by Storage Temperature, 2020-2035
  • Table 9: Global Market Value (USD Billion) Forecast by End-Use Industry, 2020-2035
  • Table 10: Global Market Volume (Units) Forecast by End-Use Industry, 2020-2035
  • Table 11: North America Market Value (USD Billion) Forecast by Country, 2020-2035
  • Table 12: North America Market Volume (Units) Forecast by Country, 2020-2035
  • Table 13: North America Market Value (USD Billion) Forecast by Type, 2020-2035
  • Table 14: North America Market Volume (Units) Forecast by Type, 2020-2035
  • Table 15: North America Market Value (USD Billion) Forecast by Material, 2020-2035
  • Table 16: North America Market Volume (Units) Forecast by Material, 2020-2035
  • Table 17: North America Market Value (USD Billion) Forecast by Storage Temperature, 2020-2035
  • Table 18: North America Market Volume (Units) Forecast by Storage Temperature, 2020-2035
  • Table 19: North America Market Value (USD Billion) Forecast by End-Use Industry, 2020-2035
  • Table 20: North America Market Volume (Units) Forecast by End-Use Industry, 2020-2035
  • Table 21: Latin America Market Value (USD Billion) Forecast by Country, 2020-2035
  • Table 22: Latin America Market Volume (Units) Forecast by Country, 2020-2035
  • Table 23: Latin America Market Value (USD Billion) Forecast by Type, 2020-2035
  • Table 24: Latin America Market Volume (Units) Forecast by Type, 2020-2035
  • Table 25: Latin America Market Value (USD Billion) Forecast by Material, 2020-2035
  • Table 26: Latin America Market Volume (Units) Forecast by Material, 2020-2035
  • Table 27: Latin America Market Value (USD Billion) Forecast by Storage Temperature, 2020-2035
  • Table 28: Latin America Market Volume (Units) Forecast by Storage Temperature, 2020-2035
  • Table 29: Latin America Market Value (USD Billion) Forecast by End-Use Industry, 2020-2035
  • Table 30: Latin America Market Volume (Units) Forecast by End-Use Industry, 2020-2035
  • Table 31: Europe Market Value (USD Billion) Forecast by Country, 2020-2035
  • Table 32: Europe Market Volume (Units) Forecast by Country, 2020-2035
  • Table 33: Europe Market Value (USD Billion) Forecast by Type, 2020-2035
  • Table 34: Europe Market Volume (Units) Forecast by Type, 2020-2035
  • Table 35: Europe Market Value (USD Billion) Forecast by Material, 2020-2035
  • Table 36: Europe Market Volume (Units) Forecast by Material, 2020-2035
  • Table 37: Europe Market Value (USD Billion) Forecast by Storage Temperature, 2020-2035
  • Table 38: Europe Market Volume (Units) Forecast by Storage Temperature, 2020-2035
  • Table 39: Europe Market Value (USD Billion) Forecast by End-Use Industry, 2020-2035
  • Table 40: Europe Market Volume (Units) Forecast by End-Use Industry, 2020-2035
  • Table 41: East Asia Market Value (USD Billion) Forecast by Country, 2020-2035
  • Table 42: East Asia Market Volume (Units) Forecast by Country, 2020-2035
  • Table 43: East Asia Market Value (USD Billion) Forecast by Type, 2020-2035
  • Table 44: East Asia Market Volume (Units) Forecast by Type, 2020-2035
  • Table 45: East Asia Market Value (USD Billion) Forecast by Material, 2020-2035
  • Table 46: East Asia Market Volume (Units) Forecast by Material, 2020-2035
  • Table 47: East Asia Market Value (USD Billion) Forecast by Storage Temperature, 2020-2035
  • Table 48: East Asia Market Volume (Units) Forecast by Storage Temperature, 2020-2035
  • Table 49: East Asia Market Value (USD Billion) Forecast by End-Use Industry, 2020-2035
  • Table 50: East Asia Market Volume (Units) Forecast by End-Use Industry, 2020-2035
  • Table 51: South Asia Market Value (USD Billion) Forecast by Country, 2020-2035
  • Table 52: South Asia Market Volume (Units) Forecast by Country, 2020-2035
  • Table 53: South Asia Market Value (USD Billion) Forecast by Type, 2020-2035
  • Table 54: South Asia Market Volume (Units) Forecast by Type, 2020-2035
  • Table 55: South Asia Market Value (USD Billion) Forecast by Material, 2020-2035
  • Table 56: South Asia Market Volume (Units) Forecast by Material, 2020-2035
  • Table 57: South Asia Market Value (USD Billion) Forecast by Storage Temperature, 2020-2035
  • Table 58: South Asia Market Volume (Units) Forecast by Storage Temperature, 2020-2035
  • Table 59: South Asia Market Value (USD Billion) Forecast by End-Use Industry, 2020-2035
  • Table 60: South Asia Market Volume (Units) Forecast by End-Use Industry, 2020-2035
  • Table 61: Oceania Market Value (USD Billion) Forecast by Country, 2020-2035
  • Table 62: Oceania Market Volume (Units) Forecast by Country, 2020-2035
  • Table 63: Oceania Market Value (USD Billion) Forecast by Type, 2020-2035
  • Table 64: Oceania Market Volume (Units) Forecast by Type, 2020-2035
  • Table 65: Oceania Market Value (USD Billion) Forecast by Material, 2020-2035
  • Table 66: Oceania Market Volume (Units) Forecast by Material, 2020-2035
  • Table 67: Oceania Market Value (USD Billion) Forecast by Storage Temperature, 2020-2035
  • Table 68: Oceania Market Volume (Units) Forecast by Storage Temperature, 2020-2035
  • Table 69: Oceania Market Value (USD Billion) Forecast by End-Use Industry, 2020-2035
  • Table 70: Oceania Market Volume (Units) Forecast by End-Use Industry, 2020-2035
  • Table 71: MEA Market Value (USD Billion) Forecast by Country, 2020-2035
  • Table 72: MEA Market Volume (Units) Forecast by Country, 2020-2035
  • Table 73: MEA Market Value (USD Billion) Forecast by Type, 2020-2035
  • Table 74: MEA Market Volume (Units) Forecast by Type, 2020-2035
  • Table 75: MEA Market Value (USD Billion) Forecast by Material, 2020-2035
  • Table 76: MEA Market Volume (Units) Forecast by Material, 2020-2035
  • Table 77: MEA Market Value (USD Billion) Forecast by Storage Temperature, 2020-2035
  • Table 78: MEA Market Volume (Units) Forecast by Storage Temperature, 2020-2035
  • Table 79: MEA Market Value (USD Billion) Forecast by End-Use Industry, 2020-2035
  • Table 80: MEA Market Volume (Units) Forecast by End-Use Industry, 2020-2035

List of Figures

  • Figure 1: Global Market Volume (Units) Forecast 2020-2035
  • Figure 2: Global Market Pricing Analysis
  • Figure 3: Global Market Value (USD Billion) Forecast 2020-2035
  • Figure 4: Global Market Value Share and BPS Analysis by Type, 2025 and 2035
  • Figure 5: Global Market Y-o-Y Growth Comparison by Type, 2025-2035
  • Figure 6: Global Market Attractiveness Analysis by Type
  • Figure 7: Global Market Value Share and BPS Analysis by Material, 2025 and 2035
  • Figure 8: Global Market Y-o-Y Growth Comparison by Material, 2025-2035
  • Figure 9: Global Market Attractiveness Analysis by Material
  • Figure 10: Global Market Value Share and BPS Analysis by Storage Temperature, 2025 and 2035
  • Figure 11: Global Market Y-o-Y Growth Comparison by Storage Temperature, 2025-2035
  • Figure 12: Global Market Attractiveness Analysis by Storage Temperature
  • Figure 13: Global Market Value Share and BPS Analysis by End-Use Industry, 2025 and 2035
  • Figure 14: Global Market Y-o-Y Growth Comparison by End-Use Industry, 2025-2035
  • Figure 15: Global Market Attractiveness Analysis by End-Use Industry
  • Figure 16: Global Market Value (USD Billion) Share and BPS Analysis by Region, 2025 and 2035
  • Figure 17: Global Market Y-o-Y Growth Comparison by Region, 2025-2035
  • Figure 18: Global Market Attractiveness Analysis by Region
  • Figure 19: North America Market Incremental $ Opportunity, 2025-2035
  • Figure 20: Latin America Market Incremental $ Opportunity, 2025-2035
  • Figure 21: Europe Market Incremental $ Opportunity, 2025-2035
  • Figure 22: East Asia Market Incremental $ Opportunity, 2025-2035
  • Figure 23: South Asia Market Incremental $ Opportunity, 2025-2035
  • Figure 24: Oceania Market Incremental $ Opportunity, 2025-2035
  • Figure 25: MEA Market Incremental $ Opportunity, 2025-2035
  • Figure 26: North America Market Value Share and BPS Analysis by Country, 2025 and 2035
  • Figure 27: North America Market Value Share and BPS Analysis by Type, 2025 and 2035
  • Figure 28: North America Market Y-o-Y Growth Comparison by Type, 2025-2035
  • Figure 29: North America Market Attractiveness Analysis by Type
  • Figure 30: North America Market Value Share and BPS Analysis by Material, 2025 and 2035
  • Figure 31: North America Market Y-o-Y Growth Comparison by Material, 2025-2035
  • Figure 32: North America Market Attractiveness Analysis by Material
  • Figure 33: North America Market Value Share and BPS Analysis by Storage Temperature, 2025 and 2035
  • Figure 34: North America Market Y-o-Y Growth Comparison by Storage Temperature, 2025-2035
  • Figure 35: North America Market Attractiveness Analysis by Storage Temperature
  • Figure 36: North America Market Value Share and BPS Analysis by End-Use Industry, 2025 and 2035
  • Figure 37: North America Market Y-o-Y Growth Comparison by End-Use Industry, 2025-2035
  • Figure 38: North America Market Attractiveness Analysis by End-Use Industry
  • Figure 39: Latin America Market Value Share and BPS Analysis by Country, 2025 and 2035
  • Figure 40: Latin America Market Value Share and BPS Analysis by Type, 2025 and 2035
  • Figure 41: Latin America Market Y-o-Y Growth Comparison by Type, 2025-2035
  • Figure 42: Latin America Market Attractiveness Analysis by Type
  • Figure 43: Latin America Market Value Share and BPS Analysis by Material, 2025 and 2035
  • Figure 44: Latin America Market Y-o-Y Growth Comparison by Material, 2025-2035
  • Figure 45: Latin America Market Attractiveness Analysis by Material
  • Figure 46: Latin America Market Value Share and BPS Analysis by Storage Temperature, 2025 and 2035
  • Figure 47: Latin America Market Y-o-Y Growth Comparison by Storage Temperature, 2025-2035
  • Figure 48: Latin America Market Attractiveness Analysis by Storage Temperature
  • Figure 49: Latin America Market Value Share and BPS Analysis by End-Use Industry, 2025 and 2035
  • Figure 50: Latin America Market Y-o-Y Growth Comparison by End-Use Industry, 2025-2035
  • Figure 51: Latin America Market Attractiveness Analysis by End-Use Industry
  • Figure 52: Europe Market Value Share and BPS Analysis by Country, 2025 and 2035
  • Figure 53: Europe Market Value Share and BPS Analysis by Type, 2025 and 2035
  • Figure 54: Europe Market Y-o-Y Growth Comparison by Type, 2025-2035
  • Figure 55: Europe Market Attractiveness Analysis by Type
  • Figure 56: Europe Market Value Share and BPS Analysis by Material, 2025 and 2035
  • Figure 57: Europe Market Y-o-Y Growth Comparison by Material, 2025-2035
  • Figure 58: Europe Market Attractiveness Analysis by Material
  • Figure 59: Europe Market Value Share and BPS Analysis by Storage Temperature, 2025 and 2035
  • Figure 60: Europe Market Y-o-Y Growth Comparison by Storage Temperature, 2025-2035
  • Figure 61: Europe Market Attractiveness Analysis by Storage Temperature
  • Figure 62: Europe Market Value Share and BPS Analysis by End-Use Industry, 2025 and 2035
  • Figure 63: Europe Market Y-o-Y Growth Comparison by End-Use Industry, 2025-2035
  • Figure 64: Europe Market Attractiveness Analysis by End-Use Industry
  • Figure 65: East Asia Market Value Share and BPS Analysis by Country, 2025 and 2035
  • Figure 66: East Asia Market Value Share and BPS Analysis by Type, 2025 and 2035
  • Figure 67: East Asia Market Y-o-Y Growth Comparison by Type, 2025-2035
  • Figure 68: East Asia Market Attractiveness Analysis by Type
  • Figure 69: East Asia Market Value Share and BPS Analysis by Material, 2025 and 2035
  • Figure 70: East Asia Market Y-o-Y Growth Comparison by Material, 2025-2035
  • Figure 71: East Asia Market Attractiveness Analysis by Material
  • Figure 72: East Asia Market Value Share and BPS Analysis by Storage Temperature, 2025 and 2035
  • Figure 73: East Asia Market Y-o-Y Growth Comparison by Storage Temperature, 2025-2035
  • Figure 74: East Asia Market Attractiveness Analysis by Storage Temperature
  • Figure 75: East Asia Market Value Share and BPS Analysis by End-Use Industry, 2025 and 2035
  • Figure 76: East Asia Market Y-o-Y Growth Comparison by End-Use Industry, 2025-2035
  • Figure 77: East Asia Market Attractiveness Analysis by End-Use Industry
  • Figure 78: South Asia Market Value Share and BPS Analysis by Country, 2025 and 2035
  • Figure 79: South Asia Market Value Share and BPS Analysis by Type, 2025 and 2035
  • Figure 80: South Asia Market Y-o-Y Growth Comparison by Type, 2025-2035
  • Figure 81: South Asia Market Attractiveness Analysis by Type
  • Figure 82: South Asia Market Value Share and BPS Analysis by Material, 2025 and 2035
  • Figure 83: South Asia Market Y-o-Y Growth Comparison by Material, 2025-2035
  • Figure 84: South Asia Market Attractiveness Analysis by Material
  • Figure 85: South Asia Market Value Share and BPS Analysis by Storage Temperature, 2025 and 2035
  • Figure 86: South Asia Market Y-o-Y Growth Comparison by Storage Temperature, 2025-2035
  • Figure 87: South Asia Market Attractiveness Analysis by Storage Temperature
  • Figure 88: South Asia Market Value Share and BPS Analysis by End-Use Industry, 2025 and 2035
  • Figure 89: South Asia Market Y-o-Y Growth Comparison by End-Use Industry, 2025-2035
  • Figure 90: South Asia Market Attractiveness Analysis by End-Use Industry
  • Figure 91: Oceania Market Value Share and BPS Analysis by Country, 2025 and 2035
  • Figure 92: Oceania Market Value Share and BPS Analysis by Type, 2025 and 2035
  • Figure 93: Oceania Market Y-o-Y Growth Comparison by Type, 2025-2035
  • Figure 94: Oceania Market Attractiveness Analysis by Type
  • Figure 95: Oceania Market Value Share and BPS Analysis by Material, 2025 and 2035
  • Figure 96: Oceania Market Y-o-Y Growth Comparison by Material, 2025-2035
  • Figure 97: Oceania Market Attractiveness Analysis by Material
  • Figure 98: Oceania Market Value Share and BPS Analysis by Storage Temperature, 2025 and 2035
  • Figure 99: Oceania Market Y-o-Y Growth Comparison by Storage Temperature, 2025-2035
  • Figure 100: Oceania Market Attractiveness Analysis by Storage Temperature
  • Figure 101: Oceania Market Value Share and BPS Analysis by End-Use Industry, 2025 and 2035
  • Figure 102: Oceania Market Y-o-Y Growth Comparison by End-Use Industry, 2025-2035
  • Figure 103: Oceania Market Attractiveness Analysis by End-Use Industry
  • Figure 104: MEA Market Value Share and BPS Analysis by Country, 2025 and 2035
  • Figure 105: MEA Market Value Share and BPS Analysis by Type, 2025 and 2035
  • Figure 106: MEA Market Y-o-Y Growth Comparison by Type, 2025-2035
  • Figure 107: MEA Market Attractiveness Analysis by Type
  • Figure 108: MEA Market Value Share and BPS Analysis by Material, 2025 and 2035
  • Figure 109: MEA Market Y-o-Y Growth Comparison by Material, 2025-2035
  • Figure 110: MEA Market Attractiveness Analysis by Material
  • Figure 111: MEA Market Value Share and BPS Analysis by Storage Temperature, 2025 and 2035
  • Figure 112: MEA Market Y-o-Y Growth Comparison by Storage Temperature, 2025-2035
  • Figure 113: MEA Market Attractiveness Analysis by Storage Temperature
  • Figure 114: MEA Market Value Share and BPS Analysis by End-Use Industry, 2025 and 2035
  • Figure 115: MEA Market Y-o-Y Growth Comparison by End-Use Industry, 2025-2035
  • Figure 116: MEA Market Attractiveness Analysis by End-Use Industry
  • Figure 117: Global Market - Tier Structure Analysis
  • Figure 118: Global Market - Company Share Analysis

Frequently Asked Questions

What was the overall size of the cryogenic capsules market in 2025?

The overall market size for the cryogenic capsules market was USD 9.7 billion in 2025.

How big is the cryogenic capsules market expected in 2035?

The cryogenic capsules market is expected to reach USD 18.7 billion in 2035.

What will drive the demand for the cryogenic capsules market during the forecast period?

The increasing adoption of cryopreservation techniques in medical research, organ transplantation, and long-term biological sample storage fuels the Cryogenic Capsules Market during the forecast period.

List the top 5 countries contributing to the cryogenic capsules market?

The top 5 countries which drive the development of the Cryogenic Capsules Market are the USA, Germany, China, Japan, and South Korea.

Which is the leading segment in the cryogenic capsules market?

On the basis of application, medical research and biobanking are expected to command a significant share over the forecast period.

Explore Similar Insights

Future Market Insights

Cryogenic Capsules Market