The global cryogenic label market is valued at USD 1,847 million in 2025 and is set to reach USD 3,426 million by 2035, growing at a CAGR of 6.4%. The market stands at the forefront of a transformative decade that promises to redefine ultra-low temperature identification infrastructure and specialized labeling excellence across pharmaceutical storage, biomedical research, industrial gas applications, and laboratory management sectors. The market's journey from USD 1,847 million in 2025 to USD 3,426 million by 2035 represents substantial growth, demonstrating the accelerating adoption of extreme temperature-resistant labeling solutions and sophisticated identification systems across sample storage, specimen tracking, medical device marking, and critical application environments.
The first half of the decade (2025-2030) will witness the market climbing from USD 1,847 million to approximately USD 2,412 million, adding USD 565 million in value, which constitutes 36% of the total forecast growth period. This phase will be characterized by the rapid adoption of advanced adhesive technologies, driven by increasing demand for reliable identification at temperatures as low as -196°C and enhanced durability requirements in laboratory environments worldwide. Superior adhesive performance and temperature resistance will become standard expectations rather than premium options.
The latter half (2030-2035) will witness sustained growth from USD 2,412 million to USD 3,426 million, representing an addition of USD 1,014 million or 64% of the decade's expansion. This period will be defined by mass market penetration of specialized cryogenic labeling systems, integration with comprehensive laboratory management platforms, and seamless compatibility with existing sample storage and tracking infrastructure. The market trajectory signals fundamental shifts in how pharmaceutical companies and research institutions approach ultra-low temperature identification solutions, with participants positioned to benefit from sustained demand across multiple application segments.
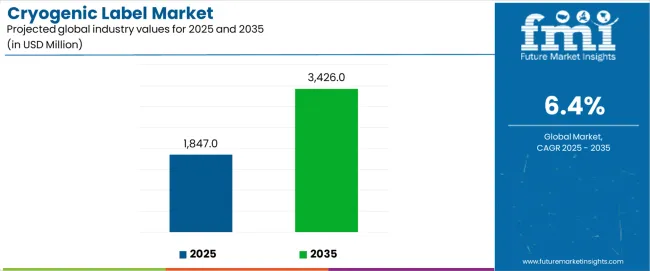
The cryogenic label market demonstrates distinct growth phases with varying market characteristics and competitive dynamics. Between 2025 and 2030, the market progresses through its specialized adhesive adoption phase, expanding from USD 1,847 million to USD 2,412 million with steady annual increments averaging 5.5% growth. This period showcases the transition from standard temperature-resistant labels to advanced cryogenic systems with enhanced adhesive performance and integrated tracking compatibility becoming mainstream features.
The 2025-2030 phase adds USD 565 million to market value, representing 36% of total decade expansion. Market maturation factors include standardization of adhesive specifications, declining material costs for specialized production, and increasing laboratory awareness of cryogenic label benefits reaching 70-75% effectiveness in sample storage applications. Competitive landscape evolution during this period features established manufacturers like Brady Corporation and 3M Company expanding their product portfolios while new entrants focus on specialized polyimide solutions and enhanced temperature resistance technology.
From 2030 to 2035, market dynamics shift toward advanced customization and multi-sector deployment, with growth accelerating from USD 2,412 million to USD 3,426 million, adding USD 1,014 million or 64% of total expansion. This phase transition logic centers on universal cryogenic labeling systems, integration with automated sample management equipment, and deployment across diverse application scenarios, becoming standard rather than specialized identification formats. The competitive environment matures with focus shifting from basic temperature resistance to comprehensive durability performance and compatibility with high-throughput laboratory operations.
At-a-Glance Metrics
| Metric | Value |
|---|---|
| Market Value (2025) | USD 1,847 million |
| Market Forecast (2035) | USD 3,426 million |
| Growth Rate | 6.40% CAGR |
| Leading Material Type | Polyimide |
| Primary Application | Pharmaceutical Segment |
The market demonstrates strong fundamentals with polyimide systems capturing a dominant share through superior temperature resistance and reliable adhesive performance capabilities. Pharmaceutical applications drive primary demand, supported by increasing biobanking requirements and laboratory sample management solutions. Geographic expansion remains concentrated in developed markets with established research infrastructure, while emerging economies show accelerating adoption rates driven by biotechnology development projects and rising pharmaceutical research activity.
The cryogenic label market represents a compelling intersection of ultra-low temperature resistance innovation, identification reliability enhancement, and sample management optimization. With robust growth projected from USD 1,847 million in 2025 to USD 3,426 million by 2035 at a 6.40% CAGR, this market is driven by increasing pharmaceutical research expansion trends, biobanking requirements, and commercial demand for reliable ultra-low temperature identification formats.
The market's expansion reflects a fundamental shift in how pharmaceutical companies and research institutions approach laboratory identification infrastructure. Strong growth opportunities exist across diverse applications, from pharmaceutical storage requiring specimen tracking to research facilities demanding comprehensive sample management solutions. Geographic expansion is particularly pronounced in Asia-Pacific markets, led by China (7.8% CAGR) and India (7.5% CAGR), while established markets in North America and Europe drive innovation and specialized segment development.
The dominance of polyimide systems and pharmaceutical applications underscores the importance of proven temperature resistance technology and adhesive reliability in driving adoption. Material cost and application complexity remain key challenges, creating opportunities for companies that can deliver consistent performance while maintaining operational efficiency.
Market expansion rests on three fundamental shifts driving adoption across pharmaceutical and research sectors. Pharmaceutical research growth creates compelling advantages through cryogenic labeling systems that provide comprehensive sample identification with reliable performance at extreme temperatures, enabling research facilities to maintain specimen traceability and reduce identification errors while maintaining data integrity and justifying investment over standard adhesive labels. Biobanking expansion accelerates as pharmaceutical companies worldwide seek specialized identification systems that deliver sample management directly to laboratory environments, enabling research optimization that aligns with regulatory requirements and maximizes specimen tracking capabilities.
Temperature reliability drives adoption from research institutions requiring ultra-low temperature labeling solutions that maintain adhesive performance while providing clear identification during long-term storage and research operations.
The growth faces headwinds from material cost variations that differ across production facilities regarding specialized substrate requirements and adhesive formulations, potentially limiting performance reliability in cost-sensitive research categories. Application complexity also persists regarding label placement and surface preparation that may increase installation requirements in facilities with demanding operational standards.
Primary Classification: The market segments by material type into Polyimide, Vinyl, Paper, Polyethylene, and Others categories, representing the evolution from standard temperature-resistant materials to ultra-low temperature identification formats for comprehensive laboratory operations.
Secondary Breakdown: Application segmentation divides the market into Pharmaceutical, Industrial Gas, Food & Beverage, Biomedical Research, and Others sectors, reflecting distinct requirements for temperature resistance, adhesive durability, and identification clarity.
Regional Classification: Geographic distribution covers North America, Europe, Asia Pacific, Latin America, and the Middle East & Africa, with developed markets leading innovation while emerging economies show accelerating growth patterns driven by pharmaceutical development programs.
The segmentation structure reveals technology progression from standard temperature-resistant materials toward integrated ultra-low temperature platforms with enhanced adhesive and identification capabilities, while application diversity spans from pharmaceutical storage to research facilities requiring comprehensive sample management and reliable identification solutions.
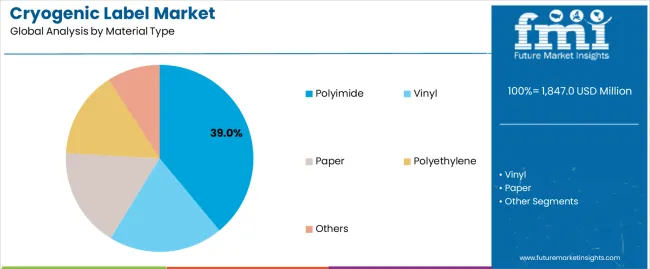
Polyimide segment is estimated to account for 39% of the cryogenic label market share in 2025. The segment's leading position stems from its fundamental role as a critical component in ultra-low temperature applications and its extensive use across multiple pharmaceutical and research sectors. Polyimide's dominance is attributed to its superior temperature resistance properties, including dimensional stability, excellent adhesive compatibility, and proven durability characteristics that make it indispensable for cryogenic storage operations.
Market Position: Polyimide systems command the leading position in the cryogenic label market through advanced substrate technologies, including comprehensive temperature tolerance, uniform surface properties, and reliable adhesive performance that enable manufacturers to deploy identification solutions across diverse laboratory environments.
Value Drivers: The segment benefits from research facility preference for proven material specifications that provide exceptional temperature resistance without requiring specialized application procedures. Efficient material performance enables deployment in pharmaceutical storage, biobanking applications, and industrial operations where identification reliability and temperature durability represent critical selection requirements.
Competitive Advantages: Polyimide systems differentiate through excellent dimensional stability, proven chemical resistance, and compatibility with standard printing equipment that enhance identification capabilities while maintaining economical material profiles suitable for diverse cryogenic applications.
Key market characteristics:
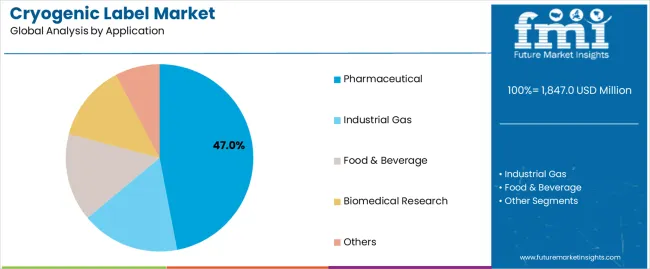
Pharmaceutical segment is projected to hold 47% of the cryogenic label market share in 2025. The segment's market leadership is driven by the extensive use of cryogenic labels in sample storage, specimen identification, vaccine storage, and laboratory tracking, where specialized labels serve as both identification components and regulatory compliance tools. The pharmaceutical industry's consistent investment in sample management systems supports the segment's dominant position.
Market Context: Pharmaceutical applications dominate the market due to widespread adoption of ultra-low temperature storage and increasing focus on sample traceability, specimen tracking, and regulatory compliance that enhance research capabilities while maintaining identification integrity.
Appeal Factors: Pharmaceutical companies prioritize temperature reliability, adhesive durability, and integration with laboratory management systems that enable coordinated deployment across multiple research facilities. The segment benefits from substantial biobanking growth and regulatory standards that emphasize reliable identification for sample storage and research applications.
Growth Drivers: Biotechnology expansion programs incorporate cryogenic labels as standard components for specimen storage and research tracking. At the same time, pharmaceutical initiatives are increasing demand for specialized identification systems that comply with laboratory standards and enhance sample management protocols.
Market Challenges: Material cost variations and application complexity may limit deployment flexibility in ultra-high-volume storage or extreme cost-sensitive scenarios.
Application dynamics include:
Growth Accelerators: Pharmaceutical research expansion drives primary adoption as cryogenic labeling systems provide exceptional identification capabilities that enable sample tracking without adhesive failure, supporting research efficiency and regulatory compliance that require ultra-low temperature identification formats. Biobanking innovation accelerates market growth as research institutions seek specialized labeling solutions that maintain specimen identification during storage while enhancing sample management through reliable adhesive performance. Laboratory modernization increases worldwide, creating sustained demand for temperature-resistant identification systems that complement research operations and provide competitive advantages in sample tracking capabilities.
Growth Inhibitors: Material cost premium challenges differ across production facilities regarding specialized substrate requirements and adhesive formulations, which may limit market penetration and deployment in high-volume categories with demanding cost specifications. Application complexity persists regarding surface preparation and label placement that may increase total installation requirements in temperature-sensitive applications with demanding operational standards. Market fragmentation across multiple material types and adhesive specifications creates compatibility concerns between different laboratory equipment and existing identification infrastructure.
Market Evolution Patterns: Adoption accelerates in pharmaceutical and research sectors where specimen tracking justifies material investments, with geographic concentration in developed markets transitioning toward mainstream adoption in emerging economies driven by biotechnology development and pharmaceutical research expansion. Technology development focuses on enhanced temperature tolerance, improved adhesive reliability, and integration with automated identification systems that optimize sample management and laboratory efficiency. The market could face disruption if alternative identification technologies or labeling innovations significantly challenge cryogenic label advantages in ultra-low temperature applications.
The cryogenic label market demonstrates varied regional dynamics with Growth Leaders including China (7.8% CAGR) and India (7.5% CAGR) driving expansion through pharmaceutical research growth and biotechnology development. Steady Performers encompass the USA (7.2% CAGR), Germany (6.5% CAGR), and Japan (6.1% CAGR), benefiting from established pharmaceutical sectors and research institution adoption.
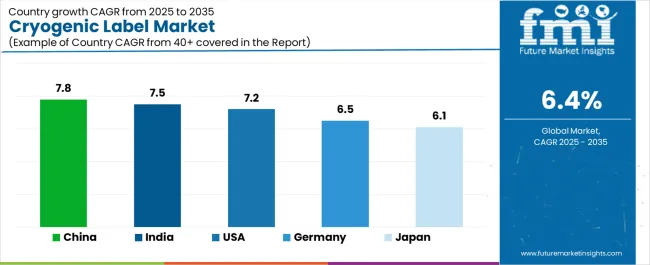
| Country | CAGR (2025-2035) |
|---|---|
| China | 7.8% |
| India | 7.5% |
| USA | 7.2% |
| Germany | 6.5% |
| Japan | 6.1% |
Regional synthesis reveals Asia-Pacific markets leading growth through pharmaceutical expansion and research development, while European countries maintain steady expansion supported by specialized biomedical applications and laboratory modernization requirements. North American markets show strong growth driven by biotechnology research and pharmaceutical storage applications.
China establishes regional leadership through explosive pharmaceutical research expansion and comprehensive biotechnology modernization, integrating advanced cryogenic labeling systems as standard components in sample storage and research tracking applications. The country's 7.8% CAGR through 2035 reflects pharmaceutical investment growth promoting biobanking development and domestic research activity that mandate the use of ultra-low temperature identification systems in laboratory operations. Growth concentrates in major pharmaceutical hubs, including Beijing, Shanghai, and Guangzhou, where research networks showcase integrated cryogenic labeling systems that appeal to domestic institutions seeking enhanced sample management and international laboratory standards.
Chinese manufacturers are developing innovative cryogenic labeling solutions that combine local production advantages with international temperature specifications, including high-performance adhesives and advanced chemical-resistant capabilities.
Strategic Market Indicators:
The Indian market emphasizes pharmaceutical applications, including rapid research development and comprehensive laboratory expansion that increasingly incorporates cryogenic labels for sample storage and specimen tracking applications. The country is projected to show a 7.5% CAGR through 2035, driven by massive pharmaceutical research activity under biotechnology initiatives and commercial demand for reliable, cost-effective identification systems. Indian research institutions prioritize cost-effectiveness with cryogenic labels delivering sample management through economical material usage and efficient temperature performance.
Technology deployment channels include major pharmaceutical companies, research institutions, and biotechnology facilities that support high-volume usage for domestic and export applications.
Performance Metrics:
The USA market emphasizes advanced cryogenic label features, including innovative adhesive technologies and integration with comprehensive laboratory management platforms that manage sample storage, specimen tracking, and research identification applications through unified identification systems. The country is projected to show a 7.2% CAGR through 2035, driven by pharmaceutical research expansion under biotechnology trends and commercial demand for premium, ultra-low temperature identification systems. American research institutions prioritize sample management with cryogenic labels delivering comprehensive identification through refined adhesive performance and temperature innovation.
Technology deployment channels include major pharmaceutical companies, research institutions, and specialty biotechnology facilities that support custom development for premium operations.
Performance Metrics:
In Munich, Hamburg, and Frankfurt, German pharmaceutical companies and research institutions are implementing advanced cryogenic labeling systems to enhance identification capabilities and support sample management that aligns with quality protocols and regulatory standards. The German market demonstrates sustained growth with a 6.5% CAGR through 2035, driven by pharmaceutical innovation programs and biotechnology investments that emphasize specialized identification systems for research and laboratory applications. German laboratory facilities are prioritizing cryogenic labeling systems that provide exceptional temperature reliability while maintaining compliance with environmental standards and minimizing material waste, particularly important in pharmaceutical storage and specialty research operations.
Market expansion benefits from research quality programs that mandate enhanced identification in laboratory specifications, creating sustained demand across Germany's pharmaceutical and biotechnology sectors, where temperature performance and adhesive reliability represent critical requirements.
Strategic Market Indicators:
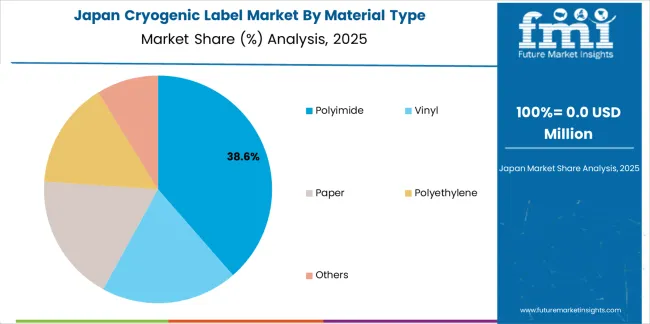
Japan's sophisticated pharmaceutical market demonstrates meticulous cryogenic label deployment, growing at 6.1% CAGR, with documented operational excellence in sample identification and laboratory management applications through integration with existing research systems and quality assurance infrastructure. The country leverages engineering expertise in material science and adhesive precision to maintain market leadership. Research centers, including Tokyo, Osaka, and Kyoto, showcase advanced installations where cryogenic labeling systems integrate with comprehensive sample management platforms and identification systems to optimize research tracking and laboratory efficiency.
Japanese research institutions prioritize identification precision and material consistency in system development, creating demand for premium cryogenic labeling systems with advanced features, including ultra-reliable adhesives and integration with automated laboratory protocols. The market benefits from established research infrastructure and willingness to invest in specialized identification technologies that provide superior temperature performance and regulatory compliance.
Market Intelligence Brief:
The cryogenic label market in Europe is projected to grow from USD 487 million in 2025 to USD 803 million by 2035, registering a CAGR of 5.1% over the forecast period. Germany is expected to maintain its leadership position with a 35.4% market share in 2025, declining slightly to 35.1% by 2035, supported by its pharmaceutical excellence and major research centers, including Baden-Württemberg and Bavaria.
France follows with a 24.8% share in 2025, projected to reach 25.2% by 2035, driven by comprehensive pharmaceutical research and biotechnology initiatives. The United Kingdom holds a 18.9% share in 2025, expected to maintain 19.1% by 2035 through established pharmaceutical sectors and laboratory adoption. Italy commands a 12.7% share, while Spain accounts for 6.4% in 2025. The Rest of Europe region is anticipated to gain momentum, expanding its collective share from 1.8% to 2.1% by 2035, attributed to increasing pharmaceutical development in Eastern European countries and emerging Nordic biotechnology companies implementing specialized identification programs.
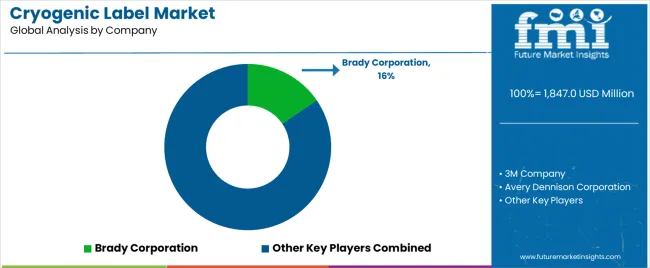
The cryogenic label market operates with moderate concentration, featuring approximately 18-25 participants, where leading companies control roughly 42-48% of the global market share through established manufacturing networks and comprehensive temperature resistance capabilities. Competition emphasizes adhesive reliability, material durability, and temperature performance rather than price-based rivalry.
Market leaders encompass Brady Corporation, 3M Company, and Avery Dennison Corporation, which maintain competitive advantages through extensive material science expertise, global production networks, and comprehensive technical support capabilities that create customer loyalty and support application requirements. These companies leverage decades of specialty labeling experience and ongoing adhesive technology investments to develop advanced cryogenic systems with exceptional temperature resistance and identification features. Brady Corporation leads with 16% share.
Specialty challengers include CCL Industries, UPM Raflatac, and Multi-Color Corporation, which compete through specialized pharmaceutical application focus and efficient identification solutions that appeal to research institutions seeking reliable temperature performance and custom identification flexibility. These companies differentiate through material engineering emphasis and specialized application focus.
Market dynamics favor participants that combine reliable temperature performance with advanced adhesive support, including chemical resistance and durability capabilities. Competitive pressure intensifies as traditional label manufacturers expand into cryogenic systems while specialized material companies challenge established players through innovative substrate treatments and cost-effective production targeting emerging pharmaceutical segments.
| Item | Value |
|---|---|
| Quantitative Units | USD 1,847 million |
| Material Type | Polyimide, Vinyl, Paper, Polyethylene, Others |
| Application | Pharmaceutical, Industrial Gas, Food & Beverage, Biomedical Research, Others |
| Regions Covered | North America, Europe, Asia Pacific, Latin America, Middle East & Africa |
| Countries Covered | U.S., Germany, Japan, China, India, and 25+ additional countries |
| Key Companies Profiled | Brady Corporation, 3M Company, Avery Dennison Corporation, CCL Industries, UPM Raflatac, Multi-Color Corporation |
| Additional Attributes | Dollar sales by material type and application categories, regional adoption trends across North America, Europe, and Asia-Pacific, competitive landscape with specialized manufacturers and material suppliers, research institution preferences for temperature reliability and adhesive performance, integration with laboratory equipment and identification systems, innovations in adhesive technology and substrate materials, and development of specialized ultra-low temperature solutions with enhanced durability capabilities and sample management features |
The global cryogenic label market is estimated to be valued at USD 1,847.0 million in 2025.
The market size for the cryogenic label market is projected to reach USD 3,426.0 million by 2035.
The cryogenic label market is expected to grow at a 6.4% CAGR between 2025 and 2035.
The key product types in cryogenic label market are polyimide , vinyl, paper, polyethylene and others.
In terms of application, pharmaceutical segment to command 47.0% share in the cryogenic label market in 2025.


Full Research Suite comprises of:
Market outlook & trends analysis
Interviews & case studies
Strategic recommendations
Vendor profiles & capabilities analysis
5-year forecasts
8 regions and 60+ country-level data splits
Market segment data splits
12 months of continuous data updates
DELIVERED AS:
PDF EXCEL ONLINE
Market Share Distribution Among Cryogenic Label Providers
North America Cryogenic Label Printer Market Size and Share Forecast Outlook 2025 to 2035
Cryogenic Vial Market Size and Share Forecast Outlook 2025 to 2035
Cryogenic Temperature Controller Market Size and Share Forecast Outlook 2025 to 2035
Cryogenic Vaporizer Market Size and Share Forecast Outlook 2025 to 2035
Cryogenic Air Separation Unit Market Size and Share Forecast Outlook 2025 to 2035
Cryogenic Freezers Market Size and Share Forecast Outlook 2025 to 2035
Cryogenic Systems Market Size and Share Forecast Outlook 2025 to 2035
Cryogenic Boxes Market Size and Share Forecast Outlook 2025 to 2035
Cryogenic Tanks Market Size and Share Forecast Outlook 2025 to 2035
Cryogenic Ampoules Market Size and Share Forecast Outlook 2025 to 2035
Cryogenic Capsules Market Growth - Demand & Forecast 2025 to 2035
Cryogenic Vials and Tubes Market Size and Share Forecast Outlook 2025 to 2035
Cryogenic Pump Market Size & Trends 2025 to 2035
Cryogenic Valves Market Growth - Trends & Forecast 2025 to 2035
Competitive Overview of Cryogenic Insulation Films Companies
Cryogenic Insulation Films Market Report – Demand, Trends & Industry Forecast 2025-2035
Analyzing Cryogenic Ampoules Market Share & Industry Leaders
Cryogenic Technology Market
Cryogenic vial rack Market

Thank you!
You will receive an email from our Business Development Manager. Please be sure to check your SPAM/JUNK folder too.
Chat With
MaRIA