Gellan Gum Market Size, Share, and Forecast Outlook 2025 to 2035

The global gellan gum market is anticipated to experience steady growth, expanding from an estimated USD 63.2 million in 2025 to USD 95.4 million by 2035, at a CAGR of 4.2%. Gellan gum, a high-performance polysaccharide derived primarily from Sphingomonas elodea through microbial fermentation, has established itself as a versatile hydrocolloid across multiple industries.
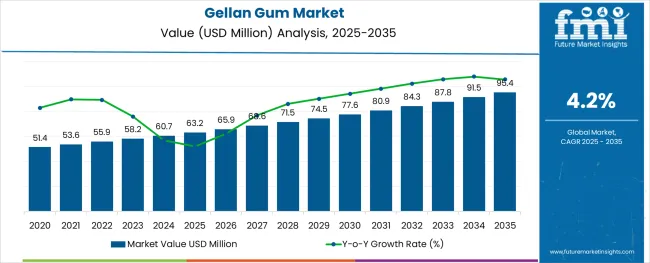
Quick Stats of the Gellan Gum Market

  • Gellan Gum Industry Value (2025): USD 63.2 million
  • Projected Gellan Gum Value (2035): USD 95.4 million
  • Forecast CAGR of Gellan Gum (2025 to 2035): 4.2%
  • Leading Segment of Gellan Gum (2025): Low acyl (59% share)
  • Key Growth Region of Gellan Gum: Asia Pacific (India, 5.1% CAGR)
  • Key Players of Gellan Gum: CP Kelco, Dancheng Caixin Sugar Industry Co., Ltd., Zhejiang Tech-Way Biochemical Co., Ltd., Zhejiang DSM Zhongken Biotechnology Co., Ltd., Hangzhou Gellan Solutions Biotec Co., Ltd.

Gellan Gum Market Market Value Analysis

Attributes Description
Estimated Global Gellan Gum Market Size (2025E) USD 63.2 million
Projected Global Gellan Gum Market Value (2035F) USD 95.4 million
Value-based CAGR (2025 to 2035) 4.2%

Its natural origin and superior gelling, thickening, and stabilizing capabilities make it a preferred alternative to synthetic additives. The steady rise in demand is closely linked to the growing global appetite for plant-based, clean-label, and allergen-free ingredients in processed foods, beverages, personal care items, and pharmaceuticals.

Its adaptability to diverse pH conditions and temperature ranges further enhances its utility across applications, allowing formulators to optimize product consistency and shelf life.

Gellan gum accounts for a relatively niche share within its parent markets due to its specialized use and premium positioning. In the global hydrocolloids market, which is valued in the multi-billion-dollar range, gellan gum accounts for less than 1% due to competition from widely used agents like xanthan and guar gum. Within the food additives market, its share is also below 1%, reflecting its selective application in high-performance formulations.

In the functional food ingredients and texturizing agents markets, it captures a modest 1-2% share, driven by its superior gelling and stabilizing properties. Its role is more pronounced in the clean-label ingredients market, where it holds around 3% share, benefiting from rising demand for plant-based, non-GMO, and allergen-free components.

The supply chain begins with microbial fermentation using carbohydrate feedstocks such as glucose or lactose, which are then inoculated with Sphingomonas elodea cultures. Post-fermentation, the broth is clarified, filtered, and precipitated, usually using alcohol, before drying and milling into a fine powder. Raw material availability and fermentation efficiency are critical to maintaining production yields and cost-effectiveness.

Suppliers must adhere to stringent food-grade and pharmaceutical-grade quality standards, necessitating consistent process controls and certification compliance. Distributors then supply products in various grades, low acyl and high acyl, to manufacturers in food, beverage, pharma, personal care, and industrial sectors

End users incorporate the ingredient in formulations based on required textural and functional attributes, often blending it with other hydrocolloids. As traceability gains prominence, supply chain transparency, clean processing techniques, and responsible sourcing are becoming central to stakeholder expectations across the ecosystem.

Analyzing Gellan Gum Market by Top Investment Segments

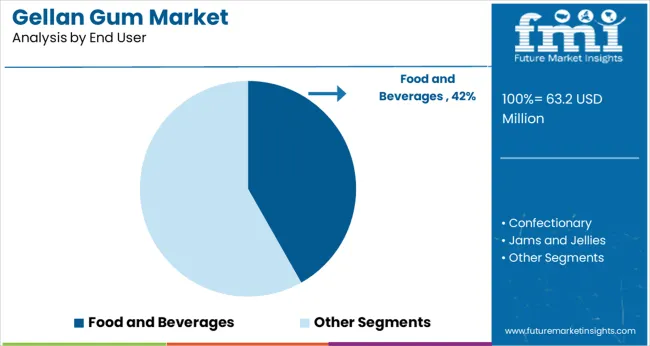
Low acyl gellan gum leads the market with a 59% share in 2025, favored for its firm gel formation, stability in acidic and calcium-rich products, and cost-efficiency. The food and beverages segment dominates end-use applications with a 42% share, driven by growing demand for clean-label, plant-based, and functional ingredients across dairy alternatives, jams, and low-sugar products.
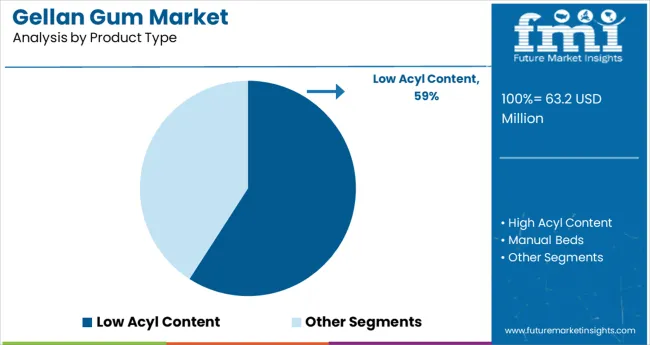
By Product Type, Low Acyl Content Segment Accounts for Over 59%

Gellan Gum Market Analysis By Product Type

In the market, low acyl content is the leading product type segment, accounting for 59% of the total market share in 2025. This dominance is largely attributed to its ability to form firm, brittle gels that are highly suitable for a broad range of food and beverage applications.
  • Superior stabilization properties, particularly in calcium-rich or acidic formulations such as flavored waters, dairy alternatives, and ready-to-drink beverages, make it the preferred choice for manufacturers.
  • Low acyl content provides better performance at lower concentrations, enhancing cost-efficiency without compromising quality.
  • The compatibility with other hydrocolloids also makes it a versatile ingredient for texture and mouthfeel customization, further solidifying its lead in both mainstream and specialty product formulations.

Food and Beverages Drive Major Demand Across End-Use Segments

Gellan Gum Market Analysis By End User

The food and beverages segment stands as the largest end-user of gellan gum, commanding a leading 42% share of the market in 2025. This dominance is primarily due to gellan gum’s exceptional functionality as a gelling, stabilizing, and thickening agent in a wide variety of food applications.

  • From improving the texture of non-dairy beverages and plant-based dairy products to stabilizing pie fillings, puddings, and jams, its clean-label appeal and plant-based origin make it increasingly desirable among health-conscious consumers.
  • Food brands race to meet evolving preferences for vegan, GMO-free, and low-sugar options, and products are being embraced not only for their technical performance but also for their alignment with transparency and ingredient simplicity, key trends driving change in global food systems.

Top Gellan Gum Market Dynamics

Gellan gum is increasingly adopted for clean-label reformulations, replacing synthetic agents in over 200 SKUs and benefiting from E418 labeling clarity in APAC. Its use in nutritional beverages is rising, with 35% of new plant-protein drinks in Europe using it to improve stability and reduce sedimentation.

Label-friendly Reformulation Fuels Clean-Ingredient Uptake

Amid rising consumer demand for simplified ingredient lists, food and beverage manufacturers are increasingly choosing products to replace synthetic gelling agents and emulsifiers. Gellan gum’s compatibility with clean-label standards has made it a preferred choice in plant-based, gluten-free, and allergen-free products.

Large-scale processors in the USA and Europe reformulated over 200 SKUs in 2024 using low acyl content, replacing carrageenan and modified starches. This shift is reinforced by retailer pressure to align with “natural origin” standards, leading to higher product shelf presence. Regulatory clarity on E418 labeling in APAC has also accelerated uptake across multi-national F&B portfolios.

  • 200+ SKUs reformulated in 2024 across major F&B companies
  • Retailers allocate more shelf space to gellan gum-based clean-label products
  • E418 labeling alignment boosts demand across Asia-Pacific markets

Functional Ingredient Demand Rises in Nutritional Beverages

Gellan gum is gaining traction in nutritional beverage applications, particularly protein drinks, fortified waters, and low-pH juices that demand suspension stability and visual appeal. Its superior dispersion and anti-settling properties help preserve consistency in high-protein formulations without affecting taste or mouthfeel.

In 2025, over 35% of newly launched plant-protein drinks in Europe listed product as a key stabilizer. RTD beverage startups in South Korea and Canada reported a 21% decline in product returns due to sedimentation after switching to gellan gum. These formulation gains are crucial for beverage brands targeting athletes, seniors, and meal-replacement users seeking functional, convenient, and label-friendly options.
  • Used in 35% of new plant-protein drinks launched in Europe in 2025
  • 21% drop in product returns tied to sedimentation after reformulation
  • Strong adoption by RTD startups serving sports and senior nutrition markets

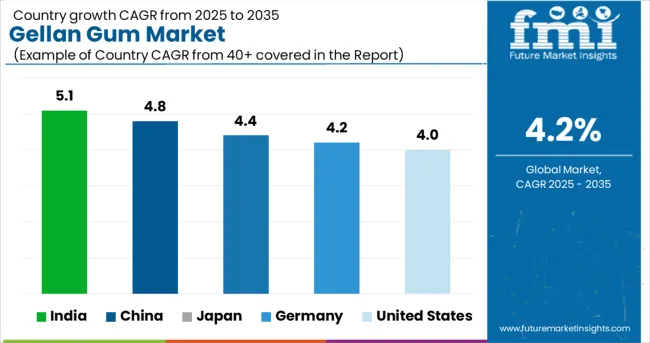
Top Countries Driving the Gellan Gum Market (2025 to 2035)

Gellan Gum Market Cagr Analysis By Country

Country CAGR (2025 to 2035)
United States 4.0%
Germany 4.2%
Japan 4.4%
China 4.8%
India 5.1%

The global gellan gum market is projected to grow at a 4.2% CAGR from 2025 to 2035, with BRICS nations leading the acceleration. India records the highest CAGR among key countries at 5.1%, outperforming the global average by nearly one percentage point.

Growth is fueled by increasing demand from plant-based dairy, confectionery, and personal care formulations, along with localized production of food-grade hydrocolloids. China follows at 4.8%, driven by expanded use in beverages, jellies, and pharmaceutical suspensions, supported by vertically integrated fermentation units.

In OECD countries, Japan posts 4.4%, slightly above the global average, as its aging population boosts demand for soft-textured functional foods and supplements. Germany grows in line at 4.2%, while the United States trails slightly at 4.0%, constrained by formulation conservatism in traditional food brands.

ASEAN countries like Thailand and Indonesia are emerging contributors, with growing applications in vegan beverages and texturizing agents for localized processed foods.

Market Evolution of Gellan Gum in the United States

The CAGR for the USA gellan gum market was 2.7% during 2020 to 2024, but is expected to rise to 4.0% for the 2025 to 2035 period, signaling a marked acceleration in adoption. The previous phase of modest growth was attributed to the limited uptake of clean-label additives in conventional processed food sectors and slower regulatory momentum around ingredient transparency.

However, from 2025 onward, regulatory clarity and rising consumer preferences for plant-based, allergen-free, and gluten-free ingredients have shifted the trajectory upward. Food processors increasingly reformulated SKUs using products to eliminate synthetic emulsifiers like carrageenan, especially in dairy alternatives and low-sugar desserts.

Meanwhile, beverage brands targeting seniors and wellness-focused millennials adopted low acyl gellan gum to address visual separation and enhance mouthfeel.

  • Over 80 large USA F&B companies reformulated products with gellan gum between 2023 to 2025.
  • Shelf space for clean-label desserts and puddings increased by 24% in major retail chains.
  • Plant-based beverage launches with gellan gum grew 17% YoY in 2024.

Strengthening Performance of Gellan Gum Market in Germany

Germany’s gellan gum market has evolved from a CAGR of around 3.1% during 2020 to 2024 to a stronger 4.2% from 2025 to 2035, driven by the country’s maturing clean-label food segment and the strong influence of EU-wide ingredient reform regulations. The earlier years saw moderate growth due to tight cost controls among local food manufacturers and preference for traditional gelling agents.

However, the introduction of EU clean-label compliance frameworks in 2024 catalyzed a wave of formulation overhauls, especially among private-label organic brands. German retailers began prioritizing products using naturally derived hydrocolloids, with gellan gum being favored for its superior stability in acidic and high-calcium beverages.

The rising consumption of vegetarian and flexitarian diets has further reinforced its utility across jams, yogurt drinks, and confectionery.

  • EU label regulation reforms led to 60+ new gellan gum-based products launched in Germany by 2026.
  • Organic dairy-alternative launches using gellan gum rose 32% from 2025 to 2027.
  • National supermarket chains increased procurement of E418-certified gellan gum by 19%.

Rising Demand Trajectory in the Chinese Gellan Gum Market

The Chinese gellan gum market has seen a significant increase in momentum, with CAGR improving from 3.6% in 2020 to 2024 to 4.8% in 2025 to 2035, surpassing the global average. This boost is primarily driven by China’s intensified regulatory push toward phasing out synthetic food additives in processed products and the rapid growth of its health-conscious middle class.

Government incentives for localized ingredient manufacturing helped increase domestic gellan gum output, which reduced import dependency and stabilized pricing for food manufacturers. Major beverage and jelly-based snack brands capitalized on this by formulating new product lines using low acyl gellan gum, particularly in fortified drinks and children’s nutrition products. Clean-label initiatives tied to e-commerce platforms like JD.com and Tmall boosted visibility and uptake among urban consumers.

  • Local production rose by 22% between 2022 and 2025 due to policy support.
  • Children's jelly snacks using the product grew 41% in urban China from 2025 to 2026.
  • Major e-commerce platforms featured over 300 gellan gum-based SKUs by 2027.

Upsurge in Gellan Gum Utilization in Japan

Japan’s gellan gum market has shifted from a CAGR of 2.9% in 2020 to 2024 to 4.4% during 2025 to 2035, thanks to evolving consumer preferences and the strong influence of domestic food clusters. In earlier years, market growth was constrained by the dominance of traditional gelling agents like agar and konjac.

However, Japan’s premium functional food sector, particularly meal replacements, senior nutrition drinks, and beauty-enhancing beverages, has embraced gellan gum for its stability, clarity, and biocompatible properties. Its wide adoption in probiotic drinks and health-oriented desserts has made it a central feature in next-gen convenience products. Leading beverage formulators in Tokyo and Osaka also favor gellan gum for its mouthfeel control in high-acid and low-pH drinks.

  • Gellan gum-based formulations grew 27% YoY in Japan’s senior nutrition category in 2025.
  • Tokyo-based food R&D startups launched 50+ product functional food products post-2024.
  • Domestic jelly dessert segment using the product grew 31% in 2026 alone.

India’s Gellan Gum Market Shows Strong Acceleration

India has witnessed a significant jump in its gellan gum market performance, moving from a CAGR of 3.8% during 2020 to 2024 to a projected 5.1% between 2025 to 2035, marking one of the highest growth rates among developing nations. Initially, limited adoption was tied to cost-sensitivity and the dominance of traditional thickeners in domestic food industries.

However, rising demand for fortified beverages, nutritional puddings, and clean-label confections has shifted the market outlook. Tier-1 food manufacturers are incorporating low acyl content into beverages like protein shakes and children's drinks, while the growing influence of modern retail chains is increasing consumer access to value-added packaged foods. Regulatory upgrades under FSSAI and rising exports of Indian plant-based products are also contributing to stronger local demand.
  • Indian beverage firms launched 120+ fortified drink SKUs with gellan gum by 2025.
  • Organized retail expansion led to 28% higher shelf availability of gellan gum-based desserts.
  • FSSAI issued updated product guidance, fast-tracking product approvals in 2026.

Leading Companies Shaping the Gellan Gum Market Landscape

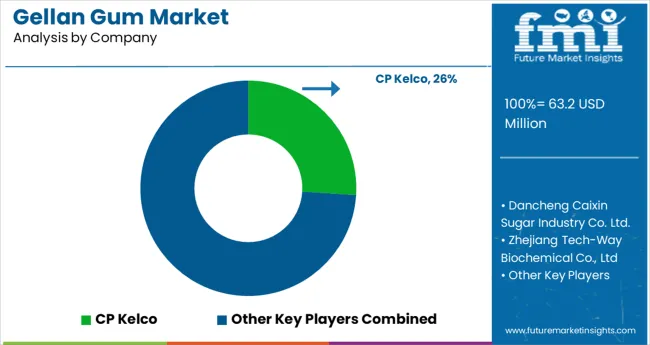
Gellan Gum Market Analysis By Company

In the gellan gum market, key manufacturers are capitalizing on demand for clean-label, plant-based stabilizers across food, personal care, and pharmaceutical sectors. Industry leader CP Kelco dominates with its broad portfolio and global reach, supplying high-quality low and high-acyl variants. Other major players such as Dancheng Caixin Sugar Industry Co., Ltd., Zhejiang Tech-Way Biochemical Co., Ltd, and Zhejiang DSM Zhongken Biotechnology Co., Ltd play pivotal roles in scaling production and driving hydrocolloid formulations.

Chinese companies like Hangzhou Gellan Solutions Biotec, Hebei Xinhe Biochemical, and Inner Mongolia Rainbow Biotech are expanding their presence in APAC markets, while Meron Group, Fufeng Group, and others support growing global demand through competitive pricing, technical customization, and diversified product offerings. These firms are essential in improving the accessibility and affordability of products across varied end-use industries.

Leading Company - CP Kelco

Industry Share - 26%

Recent Industry News

  • In 2024, CP Kelco (IFF) launched Nurica™ Gel 100, a breakthrough dual-function gellan gum that reduces dairy-alternative formulation costs by 15% by eliminating extra thickeners. This innovation strengthens its lead in plant-based foods, while DSM-Firmenich’s Gellaneer® HS and Fufeng’s USD 120 Million expansion intensify competition in high-performance and cost-driven markets.

Leading Players in the Gellan Gum Market

  • CP Kelco
  • Dancheng Caixin Sugar Industry Co. Ltd.
  • Zhejiang Tech-Way Biochemical Co., Ltd
  • Zhejiang DSM Zhongken Biotechnology Co., Ltd
  • Hangzhou Gellan Solutions Biotec Co., Ltd
  • Hebei Xinhe Biochemical Co., Ltd.
  • Meron Group
  • Inner Mongolia Rainbow Biotech Co., Ltd.
  • Fufeng Group

Research Coverage and Scope Summary

Report Attributes Details
Industry Size (2025) USD 63.2 million
Projected Industry Size (2035) USD 95.4 million
CAGR (2025 to 2035) 4.2%
Base Year for Estimation 2024
Historical Period 2020 to 2024
Projections Period 2025 to 2035
Quantitative Units USD million for value and volume in tons
Product Type Analyzed (Segment 1) High Acyl Content, Low Acyl Content, and Manual Beds.
End User Analyzed (Segment 2) Food And Beverages, Confectionery, Jams and Jellies, Fabricated Foods, Water-Based Gels, Pie Fillings and Puddings, Dairy Products, Processed Meat, Personal Care and Cosmetics, Industrial and Household Cleaners, Pharmaceuticals.
Regions Covered North America, Latin America, Western Europe, Eastern Europe, East Asia, South Asia & Pacific
Countries Covered United States, Canada, Germany, United Kingdom, France, Italy, Spain, China, India, Japan, South Korea, Australia, Brazil, Mexico, Argentina, Saudi Arabia, UAE, South Africa
Key Players CP Kelco, Dancheng Caixin Sugar Industry Co., Ltd., Zhejiang Tech-Way Biochemical Co., Ltd., Zhejiang DSM Zhongken Biotechnology Co., Ltd., Hangzhou Gellan Solutions Biotec Co., Ltd., Hebei Xinhe Biochemical Co., Ltd., Meron Group, Inner Mongolia Rainbow Biotech Co., Ltd., Fufeng Group, Others.
Additional Attributes Dollar sales, share, regional demand trends, clean-label adoption, end-use sector growth (food, pharma, cosmetics), pricing dynamics, competitor positioning, and regulatory developments.

Key Segmentation

By Product Type:

The industry includes high acyl content, low acyl content, and manual beds.

By End User:

The industry is segmented into food and beverages, confectionery, jams and jellies, fabricated foods, water-based gels, pie fillings and puddings, dairy products, processed meat, personal care and cosmetics, industrial and household cleaners, and pharmaceuticals.

By Region:

The industry is segmented as North America, Latin America, Western Europe, Eastern Europe, East Asia, South Asia & Pacific.

Table of Content

  1. Executive Summary
    • Global Market Outlook
    • Demand-side Trends
    • Supply-side Trends
    • Technology Roadmap Analysis
    • Analysis and Recommendations
  2. Market Overview
    • Market Coverage / Taxonomy
    • Market Definition / Scope / Limitations
  3. Market Background
    • Market Dynamics
      • Drivers
      • Restraints
      • Opportunity
      • Trends
    • Scenario Forecast
      • Demand in Optimistic Scenario
      • Demand in Likely Scenario
      • Demand in Conservative Scenario
    • Opportunity Map Analysis
    • Product Life Cycle Analysis
    • Supply Chain Analysis
      • Supply Side Participants and their Roles
        • Producers
        • Mid-Level Participants (Traders/ Agents/ Brokers)
        • Wholesalers and Distributors
      • Value Added and Value Created at Node in the Supply Chain
      • List of Raw Material Suppliers
      • List of Existing and Potential Buyer’s
    • Investment Feasibility Matrix
    • Value Chain Analysis
      • Profit Margin Analysis
      • Wholesalers and Distributors
      • Retailers
    • PESTLE and Porter’s Analysis
    • Regulatory Landscape
      • By Key Regions
      • By Key Countries
    • Regional Parent Market Outlook
    • Production and Consumption Statistics
    • Import and Export Statistics
  4. Global Market Analysis 2020 to 2024 and Forecast, 2025 to 2035
    • Historical Market Size Value (USD Million) & Volume (tons) Analysis, 2020 to 2024
    • Current and Future Market Size Value (USD Million) & Volume (tons) Projections, 2025 to 2035
      • Y-o-Y Growth Trend Analysis
      • Absolute $ Opportunity Analysis
  5. Global Market Pricing Analysis 2020 to 2024 and Forecast 2025 to 2035
  6. Global Market Analysis 2020 to 2024 and Forecast 2025 to 2035, By Product Type
    • Introduction / Key Findings
    • Historical Market Size Value (USD Million) & Volume (tons) Analysis By Product Type, 2020 to 2024
    • Current and Future Market Size Value (USD Million) & Volume (tons) Analysis and Forecast By Product Type, 2025 to 2035
      • High Acyl Content
      • Low Acyl Content
      • Manual Beds
    • Y-o-Y Growth Trend Analysis By Product Type, 2020 to 2024
    • Absolute $ Opportunity Analysis By Product Type, 2025 to 2035
  7. Global Market Analysis 2020 to 2024 and Forecast 2025 to 2035, By End User
    • Introduction / Key Findings
    • Historical Market Size Value (USD Million) & Volume (tons) Analysis By End User, 2020 to 2024
    • Current and Future Market Size Value (USD Million) & Volume (tons) Analysis and Forecast By End User, 2025 to 2035
      • Food and Beverages
      • Confectionary
      • Jams and Jellies
      • Fabricated Foods
      • Water-based Gels
      • Pie Fillings and Puddings
      • Dairy Products
      • Processed Meat
      • Personal Care and Cosmetics
      • Industrial and Household Cleaners
      • Pharmaceuticals
    • Y-o-Y Growth Trend Analysis By End User, 2020 to 2024
    • Absolute $ Opportunity Analysis By End User, 2025 to 2035
  8. Global Market Analysis 2020 to 2024 and Forecast 2025 to 2035, By Region
    • Introduction
    • Historical Market Size Value (USD Million) & Volume (tons) Analysis By Region, 2020 to 2024
    • Current Market Size Value (USD Million) & Volume (tons) Analysis and Forecast By Region, 2025 to 2035
      • North America
      • Latin America
      • Western Europe
      • Eastern Europe
      • East Asia
      • South Asia & Pacific
      • Middle East and Africa
    • Market Attractiveness Analysis By Region
  9. North America Market Analysis 2020 to 2024 and Forecast 2025 to 2035, By Country
    • Historical Market Size Value (USD Million) & Volume (tons) Trend Analysis By Market Taxonomy, 2020 to 2024
    • Market Size Value (USD Million) & Volume (tons) Forecast By Market Taxonomy, 2025 to 2035
      • By Country
        • USA
        • Canada
        • Mexico
      • By Product Type
      • By End User
    • Market Attractiveness Analysis
      • By Country
      • By Product Type
      • By End User
    • Key Takeaways
  10. Latin America Market Analysis 2020 to 2024 and Forecast 2025 to 2035, By Country
    • Historical Market Size Value (USD Million) & Volume (tons) Trend Analysis By Market Taxonomy, 2020 to 2024
    • Market Size Value (USD Million) & Volume (tons) Forecast By Market Taxonomy, 2025 to 2035
      • By Country
        • Brazil
        • Argentina
        • Rest of LATAM
      • By Product Type
      • By End User
    • Market Attractiveness Analysis
      • By Country
      • By Product Type
      • By End User
    • Key Takeaways
  11. Western Europe Market Analysis 2020 to 2024 and Forecast 2025 to 2035, By Country
    • Historical Market Size Value (USD Million) & Volume (tons) Trend Analysis By Market Taxonomy, 2020 to 2024
    • Market Size Value (USD Million) & Volume (tons) Forecast By Market Taxonomy, 2025 to 2035
      • By Country
        • Germany
        • Italy
        • France
        • UK
        • Spain
        • BENELUX
        • Nordic
        • Rest of W.Europe
      • By Product Type
      • By End User
    • Market Attractiveness Analysis
      • By Country
      • By Product Type
      • By End User
    • Key Takeaways
  12. Eastern Europe Market Analysis 2020 to 2024 and Forecast 2025 to 2035, By Country
    • Historical Market Size Value (USD Million) & Volume (tons) Trend Analysis By Market Taxonomy, 2020 to 2024
    • Market Size Value (USD Million) & Volume (tons) Forecast By Market Taxonomy, 2025 to 2035
      • By Country
        • Russia
        • Hungary
        • Poland
        • Balkan & Baltics
        • Rest of E. Europe
      • By Product Type
      • By End User
    • Market Attractiveness Analysis
      • By Country
      • By Product Type
      • By End User
    • Key Takeaways
  13. East Asia Market Analysis 2020 to 2024 and Forecast 2025 to 2035, By Country
    • Historical Market Size Value (USD Million) & Volume (tons) Trend Analysis By Market Taxonomy, 2020 to 2024
    • Market Size Value (USD Million) & Volume (tons) Forecast By Market Taxonomy, 2025 to 2035
      • By Country
        • China
        • Japan
        • South Korea
      • By Product Type
      • By End User
    • Market Attractiveness Analysis
      • By Country
      • By Product Type
      • By End User
    • Key Takeaways
  14. South Asia & Pacific Market Analysis 2020 to 2024 and Forecast 2025 to 2035, By Country
    • Historical Market Size Value (USD Million) & Volume (tons) Trend Analysis By Market Taxonomy, 2020 to 2024
    • Market Size Value (USD Million) & Volume (tons) Forecast By Market Taxonomy, 2025 to 2035
      • By Country
        • India
        • Australia & New Zealand
        • ASEAN
        • Rest of SAP
      • By Product Type
      • By End User
    • Market Attractiveness Analysis
      • By Country
      • By Product Type
      • By End User
    • Key Takeaways
  15. Middle East and Africa Market Analysis 2020 to 2024 and Forecast 2025 to 2035, By Country
    • Historical Market Size Value (USD Million) & Volume (tons) Trend Analysis By Market Taxonomy, 2020 to 2024
    • Market Size Value (USD Million) & Volume (tons) Forecast By Market Taxonomy, 2025 to 2035
      • By Country
        • GCC Countries
        • Northern Africa
        • South Africa
        • Turkiye
        • Rest of MEA
      • By Product Type
      • By End User
    • Market Attractiveness Analysis
      • By Country
      • By Product Type
      • By End User
    • Key Takeaways
  16. Key Countries Market Analysis
    • USA
      • Pricing Analysis
      • Market Share Analysis, 2024
        • By Product Type
        • By End User
    • Canada
      • Pricing Analysis
      • Market Share Analysis, 2024
        • By Product Type
        • By End User
    • Brazil
      • Pricing Analysis
      • Market Share Analysis, 2024
        • By Product Type
        • By End User
    • Mexico
      • Pricing Analysis
      • Market Share Analysis, 2024
        • By Product Type
        • By End User
    • Argentina
      • Pricing Analysis
      • Market Share Analysis, 2024
        • By Product Type
        • By End User
  17. Market Structure Analysis
    • Competition Dashboard
    • Competition Benchmarking
    • Market Share Analysis of Top Players
      • By Regional
      • By Product Type
      • By End User
  18. Competition Analysis
    • Competition Deep Dive
      • CP Kelco
        • Overview
        • Product Portfolio
        • Profitability by Market Segments (Product/Age /Sales Channel/Region)
        • Sales Footprint
        • Strategy Overview
          • Marketing Strategy
          • Product Strategy
          • Channel Strategy
      • Dancheng Caixin Sugar Industry Co. Ltd.
        • Overview
        • Product Portfolio
        • Profitability by Market Segments (Product/Age /Sales Channel/Region)
        • Sales Footprint
        • Strategy Overview
          • Marketing Strategy
          • Product Strategy
          • Channel Strategy
      • Zhejiang Tech-Way Biochemical Co., Ltd
        • Overview
        • Product Portfolio
        • Profitability by Market Segments (Product/Age /Sales Channel/Region)
        • Sales Footprint
        • Strategy Overview
          • Marketing Strategy
          • Product Strategy
          • Channel Strategy
      • Zhejiang DSM Zhongken Biotechnology Co., Ltd
        • Overview
        • Product Portfolio
        • Profitability by Market Segments (Product/Age /Sales Channel/Region)
        • Sales Footprint
        • Strategy Overview
          • Marketing Strategy
          • Product Strategy
          • Channel Strategy
      • Hangzhou Gellan Solutions Biotec Co., Ltd
        • Overview
        • Product Portfolio
        • Profitability by Market Segments (Product/Age /Sales Channel/Region)
        • Sales Footprint
        • Strategy Overview
          • Marketing Strategy
          • Product Strategy
          • Channel Strategy
      • Hebei Xinhe Biochemical Co., Ltd.
        • Overview
        • Product Portfolio
        • Profitability by Market Segments (Product/Age /Sales Channel/Region)
        • Sales Footprint
        • Strategy Overview
          • Marketing Strategy
          • Product Strategy
          • Channel Strategy
      • Meron Group
        • Overview
        • Product Portfolio
        • Profitability by Market Segments (Product/Age /Sales Channel/Region)
        • Sales Footprint
        • Strategy Overview
          • Marketing Strategy
          • Product Strategy
          • Channel Strategy
      • Inner Mongolia Rainbow Biotech Co. Ltd.
        • Overview
        • Product Portfolio
        • Profitability by Market Segments (Product/Age /Sales Channel/Region)
        • Sales Footprint
        • Strategy Overview
          • Marketing Strategy
          • Product Strategy
          • Channel Strategy
      • Fufeng Group
        • Overview
        • Product Portfolio
        • Profitability by Market Segments (Product/Age /Sales Channel/Region)
        • Sales Footprint
        • Strategy Overview
          • Marketing Strategy
          • Product Strategy
          • Channel Strategy
      • Others
        • Overview
        • Product Portfolio
        • Profitability by Market Segments (Product/Age /Sales Channel/Region)
        • Sales Footprint
        • Strategy Overview
          • Marketing Strategy
          • Product Strategy
          • Channel Strategy
  19. Assumptions & Acronyms Used
  20. Research Methodology

List of Tables

  • Table 1: Global Market Value (USD Million) Forecast by Region, 2020-2035
  • Table 2: Global Market Volume (tons) Forecast by Region, 2020-2035
  • Table 3: Global Market Value (USD Million) Forecast by Product Type, 2020-2035
  • Table 4: Global Market Volume (tons) Forecast by Product Type, 2020-2035
  • Table 5: Global Market Value (USD Million) Forecast by End User, 2020-2035
  • Table 6: Global Market Volume (tons) Forecast by End User, 2020-2035
  • Table 7: North America Market Value (USD Million) Forecast by Country, 2020-2035
  • Table 8: North America Market Volume (tons) Forecast by Country, 2020-2035
  • Table 9: North America Market Value (USD Million) Forecast by Product Type, 2020-2035
  • Table 10: North America Market Volume (tons) Forecast by Product Type, 2020-2035
  • Table 11: North America Market Value (USD Million) Forecast by End User, 2020-2035
  • Table 12: North America Market Volume (tons) Forecast by End User, 2020-2035
  • Table 13: Latin America Market Value (USD Million) Forecast by Country, 2020-2035
  • Table 14: Latin America Market Volume (tons) Forecast by Country, 2020-2035
  • Table 15: Latin America Market Value (USD Million) Forecast by Product Type, 2020-2035
  • Table 16: Latin America Market Volume (tons) Forecast by Product Type, 2020-2035
  • Table 17: Latin America Market Value (USD Million) Forecast by End User, 2020-2035
  • Table 18: Latin America Market Volume (tons) Forecast by End User, 2020-2035
  • Table 19: Western Europe Market Value (USD Million) Forecast by Country, 2020-2035
  • Table 20: Western Europe Market Volume (tons) Forecast by Country, 2020-2035
  • Table 21: Western Europe Market Value (USD Million) Forecast by Product Type, 2020-2035
  • Table 22: Western Europe Market Volume (tons) Forecast by Product Type, 2020-2035
  • Table 23: Western Europe Market Value (USD Million) Forecast by End User, 2020-2035
  • Table 24: Western Europe Market Volume (tons) Forecast by End User, 2020-2035
  • Table 25: Eastern Europe Market Value (USD Million) Forecast by Country, 2020-2035
  • Table 26: Eastern Europe Market Volume (tons) Forecast by Country, 2020-2035
  • Table 27: Eastern Europe Market Value (USD Million) Forecast by Product Type, 2020-2035
  • Table 28: Eastern Europe Market Volume (tons) Forecast by Product Type, 2020-2035
  • Table 29: Eastern Europe Market Value (USD Million) Forecast by End User, 2020-2035
  • Table 30: Eastern Europe Market Volume (tons) Forecast by End User, 2020-2035
  • Table 31: East Asia Market Value (USD Million) Forecast by Country, 2020-2035
  • Table 32: East Asia Market Volume (tons) Forecast by Country, 2020-2035
  • Table 33: East Asia Market Value (USD Million) Forecast by Product Type, 2020-2035
  • Table 34: East Asia Market Volume (tons) Forecast by Product Type, 2020-2035
  • Table 35: East Asia Market Value (USD Million) Forecast by End User, 2020-2035
  • Table 36: East Asia Market Volume (tons) Forecast by End User, 2020-2035
  • Table 37: South Asia & Pacific Market Value (USD Million) Forecast by Country, 2020-2035
  • Table 38: South Asia & Pacific Market Volume (tons) Forecast by Country, 2020-2035
  • Table 39: South Asia & Pacific Market Value (USD Million) Forecast by Product Type, 2020-2035
  • Table 40: South Asia & Pacific Market Volume (tons) Forecast by Product Type, 2020-2035
  • Table 41: South Asia & Pacific Market Value (USD Million) Forecast by End User, 2020-2035
  • Table 42: South Asia & Pacific Market Volume (tons) Forecast by End User, 2020-2035
  • Table 43: Middle East and Africa Market Value (USD Million) Forecast by Country, 2020-2035
  • Table 44: Middle East and Africa Market Volume (tons) Forecast by Country, 2020-2035
  • Table 45: Middle East and Africa Market Value (USD Million) Forecast by Product Type, 2020-2035
  • Table 46: Middle East and Africa Market Volume (tons) Forecast by Product Type, 2020-2035
  • Table 47: Middle East and Africa Market Value (USD Million) Forecast by End User, 2020-2035
  • Table 48: Middle East and Africa Market Volume (tons) Forecast by End User, 2020-2035

List of Figures

  • Figure 1: Global Market Volume (tons) Forecast 2020-2035
  • Figure 2: Global Market Pricing Analysis
  • Figure 3: Global Market Value (USD Million) Forecast 2020-2035
  • Figure 4: Global Market Value Share and BPS Analysis by Product Type, 2025 and 2035
  • Figure 5: Global Market Y-o-Y Growth Comparison by Product Type, 2025-2035
  • Figure 6: Global Market Attractiveness Analysis by Product Type
  • Figure 7: Global Market Value Share and BPS Analysis by End User, 2025 and 2035
  • Figure 8: Global Market Y-o-Y Growth Comparison by End User, 2025-2035
  • Figure 9: Global Market Attractiveness Analysis by End User
  • Figure 10: Global Market Value (USD Million) Share and BPS Analysis by Region, 2025 and 2035
  • Figure 11: Global Market Y-o-Y Growth Comparison by Region, 2025-2035
  • Figure 12: Global Market Attractiveness Analysis by Region
  • Figure 13: North America Market Incremental $ Opportunity, 2025-2035
  • Figure 14: Latin America Market Incremental $ Opportunity, 2025-2035
  • Figure 15: Western Europe Market Incremental $ Opportunity, 2025-2035
  • Figure 16: Eastern Europe Market Incremental $ Opportunity, 2025-2035
  • Figure 17: East Asia Market Incremental $ Opportunity, 2025-2035
  • Figure 18: South Asia & Pacific Market Incremental $ Opportunity, 2025-2035
  • Figure 19: Middle East and Africa Market Incremental $ Opportunity, 2025-2035
  • Figure 20: North America Market Value Share and BPS Analysis by Country, 2025 and 2035
  • Figure 21: North America Market Value Share and BPS Analysis by Product Type, 2025 and 2035
  • Figure 22: North America Market Y-o-Y Growth Comparison by Product Type, 2025-2035
  • Figure 23: North America Market Attractiveness Analysis by Product Type
  • Figure 24: North America Market Value Share and BPS Analysis by End User, 2025 and 2035
  • Figure 25: North America Market Y-o-Y Growth Comparison by End User, 2025-2035
  • Figure 26: North America Market Attractiveness Analysis by End User
  • Figure 27: Latin America Market Value Share and BPS Analysis by Country, 2025 and 2035
  • Figure 28: Latin America Market Value Share and BPS Analysis by Product Type, 2025 and 2035
  • Figure 29: Latin America Market Y-o-Y Growth Comparison by Product Type, 2025-2035
  • Figure 30: Latin America Market Attractiveness Analysis by Product Type
  • Figure 31: Latin America Market Value Share and BPS Analysis by End User, 2025 and 2035
  • Figure 32: Latin America Market Y-o-Y Growth Comparison by End User, 2025-2035
  • Figure 33: Latin America Market Attractiveness Analysis by End User
  • Figure 34: Western Europe Market Value Share and BPS Analysis by Country, 2025 and 2035
  • Figure 35: Western Europe Market Value Share and BPS Analysis by Product Type, 2025 and 2035
  • Figure 36: Western Europe Market Y-o-Y Growth Comparison by Product Type, 2025-2035
  • Figure 37: Western Europe Market Attractiveness Analysis by Product Type
  • Figure 38: Western Europe Market Value Share and BPS Analysis by End User, 2025 and 2035
  • Figure 39: Western Europe Market Y-o-Y Growth Comparison by End User, 2025-2035
  • Figure 40: Western Europe Market Attractiveness Analysis by End User
  • Figure 41: Eastern Europe Market Value Share and BPS Analysis by Country, 2025 and 2035
  • Figure 42: Eastern Europe Market Value Share and BPS Analysis by Product Type, 2025 and 2035
  • Figure 43: Eastern Europe Market Y-o-Y Growth Comparison by Product Type, 2025-2035
  • Figure 44: Eastern Europe Market Attractiveness Analysis by Product Type
  • Figure 45: Eastern Europe Market Value Share and BPS Analysis by End User, 2025 and 2035
  • Figure 46: Eastern Europe Market Y-o-Y Growth Comparison by End User, 2025-2035
  • Figure 47: Eastern Europe Market Attractiveness Analysis by End User
  • Figure 48: East Asia Market Value Share and BPS Analysis by Country, 2025 and 2035
  • Figure 49: East Asia Market Value Share and BPS Analysis by Product Type, 2025 and 2035
  • Figure 50: East Asia Market Y-o-Y Growth Comparison by Product Type, 2025-2035
  • Figure 51: East Asia Market Attractiveness Analysis by Product Type
  • Figure 52: East Asia Market Value Share and BPS Analysis by End User, 2025 and 2035
  • Figure 53: East Asia Market Y-o-Y Growth Comparison by End User, 2025-2035
  • Figure 54: East Asia Market Attractiveness Analysis by End User
  • Figure 55: South Asia & Pacific Market Value Share and BPS Analysis by Country, 2025 and 2035
  • Figure 56: South Asia & Pacific Market Value Share and BPS Analysis by Product Type, 2025 and 2035
  • Figure 57: South Asia & Pacific Market Y-o-Y Growth Comparison by Product Type, 2025-2035
  • Figure 58: South Asia & Pacific Market Attractiveness Analysis by Product Type
  • Figure 59: South Asia & Pacific Market Value Share and BPS Analysis by End User, 2025 and 2035
  • Figure 60: South Asia & Pacific Market Y-o-Y Growth Comparison by End User, 2025-2035
  • Figure 61: South Asia & Pacific Market Attractiveness Analysis by End User
  • Figure 62: Middle East and Africa Market Value Share and BPS Analysis by Country, 2025 and 2035
  • Figure 63: Middle East and Africa Market Value Share and BPS Analysis by Product Type, 2025 and 2035
  • Figure 64: Middle East and Africa Market Y-o-Y Growth Comparison by Product Type, 2025-2035
  • Figure 65: Middle East and Africa Market Attractiveness Analysis by Product Type
  • Figure 66: Middle East and Africa Market Value Share and BPS Analysis by End User, 2025 and 2035
  • Figure 67: Middle East and Africa Market Y-o-Y Growth Comparison by End User, 2025-2035
  • Figure 68: Middle East and Africa Market Attractiveness Analysis by End User
  • Figure 69: Global Market - Tier Structure Analysis
  • Figure 70: Global Market - Company Share Analysis

Frequently Asked Questions

What is the estimated market size of the gellan gum industry in 2025?

The industry is valued at USD 63.2 million in 2025.

What is the projected industry size of the gellan gum industry by 2035?

It is forecasted to reach USD 95.4 million by 2035.

What is the expected CAGR for the gellan gum industry between 2025 and 2035?

The industry is anticipated to grow at a CAGR of 4.2% during this period.

Which segment is expected to lead the gellan gum market in 2035?

Low acyl content is projected to lead the market with a 59% share in 2035.

Which region is expected to witness the highest growth in the gellan gum market?

Asia Pacific, particularly India, is expected to be the key growth region with a projected growth rate of 5.1%.

Explore Similar Insights

Future Market Insights

Gellan Gum Market