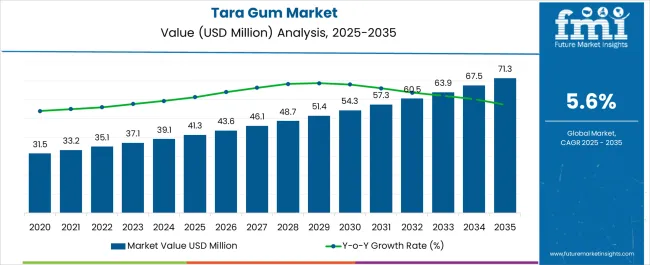
The Tara Gum Market is estimated to be valued at USD 41.3 million in 2025 and is projected to reach USD 71.3 million by 2035, registering a compound annual growth rate (CAGR) of 5.6% over the forecast period.
| Metric | Value |
|---|---|
| Tara Gum Market Estimated Value in (2025 E) | USD 41.3 million |
| Tara Gum Market Forecast Value in (2035 F) | USD 71.3 million |
| Forecast CAGR (2025 to 2035) | 5.6% |
The tara gum market is experiencing steady expansion, driven by increasing demand for clean-label, plant-based hydrocolloids in food and beverage applications. Regulatory preference for natural additives and rising consumer scrutiny of ingredient lists have enhanced adoption in formulations requiring viscosity and texture stability.
Tara gum’s functional performance as a stabilizer, thickener, and emulsifier, combined with its gluten-free and allergen-free properties, has positioned it as a favorable alternative to synthetic thickeners. Industry investments in natural gum extraction and improved traceability across Latin American supply chains are strengthening supply assurance for manufacturers.
Additionally, growing awareness of tara gum’s compatibility with vegan and organic product lines is expected to support its inclusion in reformulation strategies. The market is poised to benefit from clean-label positioning and increased uptake in dairy alternatives, sauces, and bakery systems seeking additive transparency and performance reliability.
The market is segmented by End Use Application and region. By End Use Application, the market is divided into Bakery, Beverages, Confectionary, Dairy, Jams, Soups, Sauces, Dressings & Condiments, Processed Food & Beverages, Infant Formula, Beauty and Personal Care, Animal Feed, and Pharmaceuticals. Regionally, the market is classified into North America, Latin America, Western Europe, Eastern Europe, Balkan & Baltic Countries, Russia & Belarus, Central Asia, East Asia, South Asia & Pacific, and the Middle East & Africa.
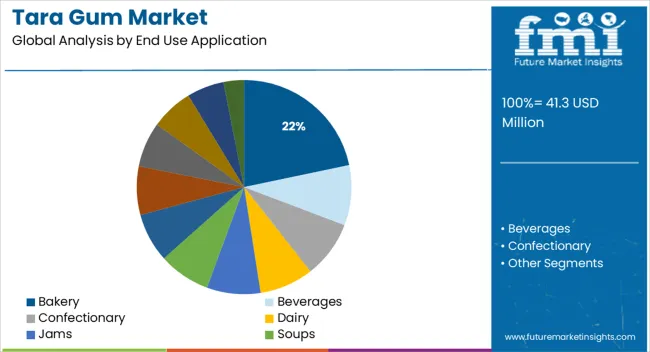
The bakery segment is projected to hold 21.7% of the total revenue share in the tara gum market by 2025, making it the leading end use application. This leadership is being driven by the gum’s ability to improve dough consistency, retain moisture, and enhance shelf stability in baked goods.
Its performance in preventing staling and improving crumb structure has made it a preferred functional additive among clean-label bakery producers. As demand rises for gluten-free, vegan, and allergen-conscious bakery formulations, tara gum has emerged as a cost-effective, natural alternative to traditional gums and starches.
Its synergy with other hydrocolloids further supports its role in complex baking systems. Additionally, consumer preference for soft textures and extended freshness in bread, cakes, and pastries is accelerating its incorporation in both artisanal and industrial-scale baking operations.
The market grew with a CAGR of 3.7% between 2020 and 21, global demand for tara gum is rising as low-fat and low-calorie food products become more and more popular, and tara gum has been regarded as a potential replacement for guar gum, it has been observed that growing guar gum costs are the primary cause responsible for the expansion of the worldwide tara gum market.
Due to the growing need for low-fat and low-calorie meals, tara gum is in high demand in all major regional markets. Guar gum is frequently replaced with good results by tara gum. Rising guar gum prices are a crucial factor driving the growth of the global tara gum market because it has been identified as a viable guar gum substitute. In addition, the rapidly expanding need for tara gum in the global food and beverage industry is anticipated to boost tara gum demand and assist the expansion of the tara gum market.
In addition, consumer concerns about eating healthily to prevent diseases are boosting demand for tara gum, which is used by the food industry to make low-calorie products. Tara gums appeal to food makers since they are frequently utilized in fat replacement systems. Additionally, these natural additives are used in cosmetic applications because more and more cosmetic products are using natural ingredients. The global tara gum market is predicted to grow as a result of these factors.
Clean-label products are defined as products that contain fewer artificial ingredients and more natural ingredients. Claims essentially rely on complete transparency concerning the manufacturing process and the ingredients used in products. Consumers are increasingly preferring such products due to growing distrust of artificial ingredients and lax governmental regulations.
The Tara Gum has the potential to be an ideal ingredient for clean-label products. The use of grain-based flours and ingredients and flavors derived from plant-based sources ensures a strong natural claim, and also provides the underlying bakery product with a favorable aroma and structural integrity.
In addition, tara gums are used for their functional qualities in the beauty and personal care business because there are no synthetic substitutes available. Complex carbohydrates and considerable amounts of vitamins B and C are present in the final product. As a result, tara gum is much more than just a thickening agent and is recognized for its moisturizing and protecting qualities. In the cosmetic and personal care sector, it can also considerably increase a product's efficacy.
Another important factor projected to drive the global tara gum market is the use of tara gum in the animal feed industry to increase cattle and poultry growth and prevent animal illnesses. Additionally, it is anticipated that throughout the forecast period, the pharmaceutical industry's need for tara gum to make a variety of pharmaceutical supplements will encourage the growth of the worldwide tara gum market.
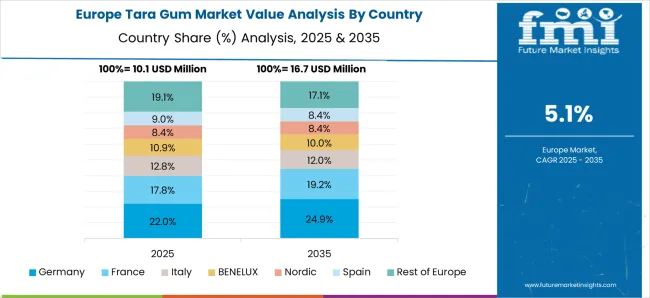
Germany is anticipated to account for 32.1% of the European market's total revenue value shares by the end of 2035. Market expansion is anticipated to be fuelled by consumers' increasing adoption of a healthy lifestyle in the region and the presence of a well-established food and beverage industry.
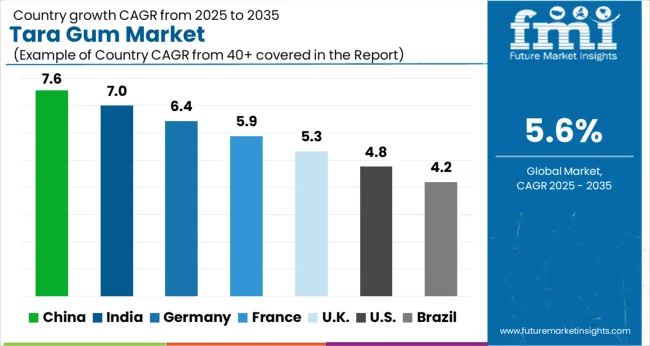
The global tara gum market is anticipated to expand significantly throughout the forecast period, particularly in Asia Pacific countries like China and India. Over the anticipated period, the regional market is likely to be driven by rising demand for low-fat food products, high demand for natural ingredient medicines, and rising disposable income in emerging nations.
Furthermore, to gain market, share in these untapped regions, the key businesses active in the global tara gum market concentrate primarily on emerging markets.
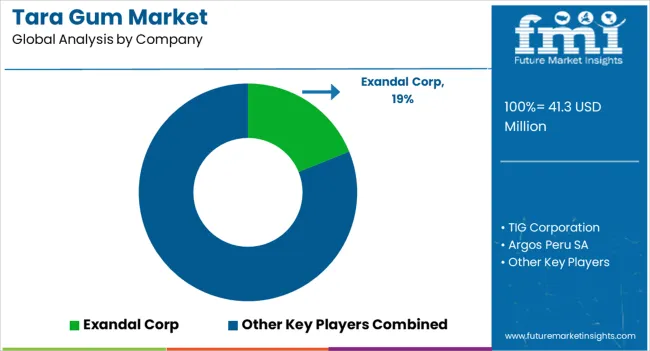
Argos Peru SA, TIG Corporation, Molinos Asociados S.A.C., Gomas y Taninos, Priya International, and KALYS are the market's top competitors for tara gum. There are numerous worldwide and regional competitors in the extremely competitive global tara gum market. Market participants also place a lot of emphasis on offering consumers unique products that incorporate useful qualities.
| Attribute | Details |
|---|---|
| Market Size Value in 2025 | USD 35.1 Million |
| Market Forecast Value in 2035 | USD 57.8 Million |
| Global Growth Rate | 5.1% CAGR |
| Forecast Period | 2025 to 2035 |
| Historical Data Available for | 2020 to 2024 |
| Market Analysis | MT for Volume and USD Million for Value |
| Key Regions Covered | North America; Latin America; Europe; East Asia; South Asia; Oceania; and Middle East & Africa (MEA) |
| Key Countries Covered | United States, Canada, Brazil, Mexico, Argentina, Chile, Peru, Germany, France, Italy, Spain, UK, Netherlands, Belgium, Nordic, Russia, China, Japan, South Korea, India, Thailand, Malaysia, Indonesia, Singapore, Australia, New Zealand, GCC Countries, South Africa, Central Africa, North Africa, and others |
| Key Market Segments Covered | End Use Application |
| Key Companies Profiled | TIG corporation; Argos Peru SA; Molinos Asociados S.A.C.; Gomas y Taninos S.A.C.; Priya International; Innova Export Ltd.; AgriExport SRL; KALYS; Gelymar; Silvateam; Exandal Corp; Ingredients Solutions; UNIPEKTIN INGREDIENTS; Amstel Products; IHC Chempharm; HSH Chemie; Others |
| Pricing | Available upon Request |
The global tara gum market is estimated to be valued at USD 41.3 million in 2025.
The market size for the tara gum market is projected to reach USD 71.3 million by 2035.
The tara gum market is expected to grow at a 5.6% CAGR between 2025 and 2035.
The key product types in tara gum market are bakery, beverages, confectionary, dairy, jams, soups, sauces, dressings & condiments, processed food & beverages, infant formula, beauty and personal care, animal feed and pharmaceuticals.
In terms of , segment to command 0.0% share in the tara gum market in 2025.


Our Research Products

The "Full Research Suite" delivers actionable market intel, deep dives on markets or technologies, so clients act faster, cut risk, and unlock growth.

The Leaderboard benchmarks and ranks top vendors, classifying them as Established Leaders, Leading Challengers, or Disruptors & Challengers.

Locates where complements amplify value and substitutes erode it, forecasting net impact by horizon

We deliver granular, decision-grade intel: market sizing, 5-year forecasts, pricing, adoption, usage, revenue, and operational KPIs—plus competitor tracking, regulation, and value chains—across 60 countries broadly.

Spot the shifts before they hit your P&L. We track inflection points, adoption curves, pricing moves, and ecosystem plays to show where demand is heading, why it is changing, and what to do next across high-growth markets and disruptive tech

Real-time reads of user behavior. We track shifting priorities, perceptions of today’s and next-gen services, and provider experience, then pace how fast tech moves from trial to adoption, blending buyer, consumer, and channel inputs with social signals (#WhySwitch, #UX).

Partner with our analyst team to build a custom report designed around your business priorities. From analysing market trends to assessing competitors or crafting bespoke datasets, we tailor insights to your needs.
Supplier Intelligence
Discovery & Profiling
Capacity & Footprint
Performance & Risk
Compliance & Governance
Commercial Readiness
Who Supplies Whom
Scorecards & Shortlists
Playbooks & Docs
Category Intelligence
Definition & Scope
Demand & Use Cases
Cost Drivers
Market Structure
Supply Chain Map
Trade & Policy
Operating Norms
Deliverables
Buyer Intelligence
Account Basics
Spend & Scope
Procurement Model
Vendor Requirements
Terms & Policies
Entry Strategy
Pain Points & Triggers
Outputs
Pricing Analysis
Benchmarks
Trends
Should-Cost
Indexation
Landed Cost
Commercial Terms
Deliverables
Brand Analysis
Positioning & Value Prop
Share & Presence
Customer Evidence
Go-to-Market
Digital & Reputation
Compliance & Trust
KPIs & Gaps
Outputs
Full Research Suite comprises of:
Market outlook & trends analysis
Interviews & case studies
Strategic recommendations
Vendor profiles & capabilities analysis
5-year forecasts
8 regions and 60+ country-level data splits
Market segment data splits
12 months of continuous data updates
DELIVERED AS:
PDF EXCEL ONLINE
Gum Rosin Market Size and Share Forecast Outlook 2025 to 2035
Gummed Tape Market Size and Share Forecast Outlook 2025 to 2035
Gummy Supplements Market Size and Share Forecast Outlook 2025 to 2035
Gum Arabic Market Analysis – Size, Share, and Forecast Outlook 2025 to 2035
Gummy Market Analysis by Product, Ingredient, End-Use, Distribution Channel, and Region - Forecast through 2025 to 2035
Gum Turpentine Oil Market Growth - Trends & Forecast 2025 to 2035
Gum Hydrocolloid Market Analysis by Product Type, Source, and Region through 2035
Key Companies & Market Share in the Gummed Tape Sector
Evaluating Gum Fiber Market Share & Provider Insights
Gum Content Tester Market
Cataract Surgery Device Market Analysis – Growth & Forecast 2024-2034
Glutaraldehyde Market Growth - Trends & Forecast 2025 to 2035
CBD Gummies Market Analysis - Size, Share and Forecast Outlook 2025 to 2035
Pre-Gummed Labels Market Growth - Demand & Forecast 2025 to 2035
Guar Gum Market Size and Share Forecast Outlook 2025 to 2035
Guar Gum for Construction Market Size and Share Forecast Outlook 2025 to 2035
Sleep Gummy Market Analysis by Primary Ingredient, Customer Orientation, Pack Size and Product Claim Through 2035
Paper Gummed Tape Market Growth - Demand & Forecast 2025 to 2035
CoQ10 Gummies Market Analysis by Source, Distribution Channels, and Key Regions Through 2035
Ester Gums Market Growth – Trends & Forecast 2025 to 2035

Thank you!
You will receive an email from our Business Development Manager. Please be sure to check your SPAM/JUNK folder too.
Chat With
MaRIA