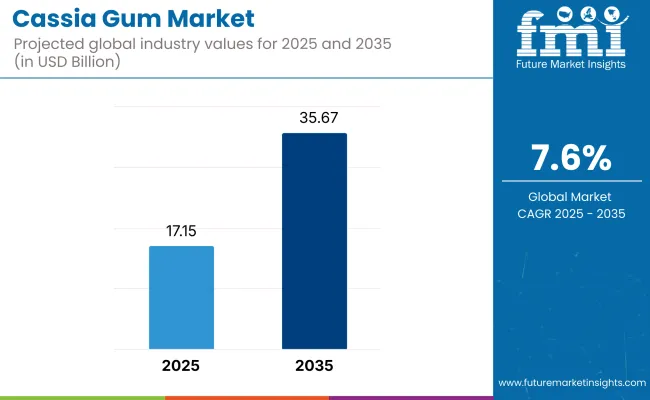
The demand for global Cassia Gum market is expected to be valued at USD 17.15 Billion in 2025, forecasted at a CAGR of 7.6% to have an estimated value of USD 35.67 Billion from 2025 to 2035. From 2020 to 2024 a CAGR of 4.1% was registered for the market.

| Attributes | Description |
|---|---|
| Estimated Global Industry Size (2025E) | USD 17.15 Billion |
| Projected Global Industry Value (2035F) | USD 35.67 Billion |
| Value-based CAGR (2025 to 2035) | 7.6% |
In order to achieve scale in the cassia gum industry businesses may use a number of strategic approaches. Diversifying product offerings allows for the expansion into new markets such as those for medications cosmetics and pet care while also increasing revenue streams.
As vertical integration manages the entire supply chain from farming to processing it ensures dependable supply and constant quality. Through acquisitions distribution contracts and strategic alliances that allow market penetration in unexplored areas global demand can be increased. Players may strengthen their position against rivals and spur market expansion in cassia gum by employing these tactics.
Its many uses as a thickener emulsifier foam stabilizer moisture retention agent and texturizing agent in food and beverage pharmaceutical and personal care products are responsible for the markets expansion. The market is also being driven by favorable regulatory guidelines.

| Segment | Value Share (2025) |
|---|---|
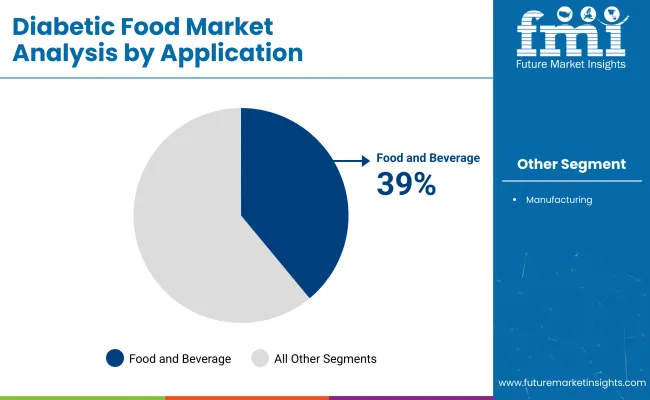
| Food and Beverages (Application) | 39% |
With its many applications as thickeners stabilizers and emulsifiers cassia gum has increased its market share to 39% in 2025. In response to consumer demands for natural and transparent ingredient lists they offer clean label solutions.
This gum broad use in food and beverage applications can be attributed to its compatibility with special diets such as vegetarian vegan and gluten-free diets. In places where traditional ingredients are important they satisfy specific cultural preferences. Their appeal to discerning consumers seeking luxury or wellness-focused goods is increased by their suitability for niche product categories like organic non-GMO or functional foods and drinks.
Increase in use of Bakery Products is Driving the Market Growth
It is utilized in desserts for texture enhancement moisture retention foam stabilization and emulsification. Due to the rise in demand for novel goods with a refreshing flavor and ongoing improvements in the bakery and confectionery industries.
Processing and freezing technology as well as developed ingredients like cassia gum have led to an increase in the import of bakery goods considerable growth in this market over the years. Also, the fast-paced lifestyle has led to the rise in popularity of convenience foods and busy lives ease of product availability quick preparation affordable prices and long shelf life.
During the period 2020 to 2024, the sales grew at a CAGR of 4.1%, and it is predicted to continue to grow at a CAGR of 7.6% during the forecast period of 2025 to 2035.
One recent advancement in the industry is the use of cassia gum in plant-based meat substitutes. As the demand for vegetarian and vegan options grows cassia gums natural binder improves the texture and juiciness of meat substitutes.
This revolutionary innovation offers producers a clean label way to improve the sensory experience of plant-based meat products while also satisfying the needs of consumers looking for ethical and sustainable protein sources.
Tier 1 companies comprises industry leaders acquiring a 60% share in the global business market. These leaders are distinguished by their extensive product portfolio and high production capacity. These industry leaders stand out due to their broad geographic reach, in-depth knowledge of manufacturing and reconditioning across various formats and strong customer base. They offer a variety of services and manufacturing with the newest technology while adhering to legal requirements for the best quality.
Tier 2 companies comprises of mid-size players having a presence in some regions and highly influencing the local commerce and has a market share of 30%. These are distinguished by their robust global presence and solid business acumen. These industry participants may not have cutting-edge technology or a broad global reach but they do have good technology and guarantee regulatory compliance.
Tier 3 companies comprises mostly of small-scale businesses serving niche economies and serving at the local presence having a market share of 10%. Due to their notable focus on meeting local needs these businesses are categorized as belonging to the tier 3 share segment, they are minor players with a constrained geographic scope. As an unorganized ecosystem Tier 3 in this context refers to a sector that in contrast to its organized competitors, lacks extensive structure and formalization.

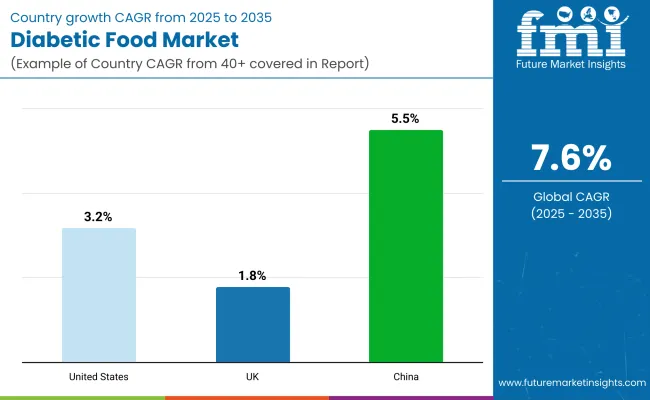
The following table shows the forecasted growth rates of the significant three geographies revenues. USA, UK and China come under the exhibit of high consumption, recording CAGRs of 3.2%, 1.8% and 5.5%, respectively, through 2035.
| Countries | CAGR (2025 to 2035) |
|---|---|
| United States | 3.2% |
| UK | 1.8% |
| China | 5.5% |
Growing consumer preference for gluten-free products is a key driver of the USA cassia gum market which is expected to grow at a 3.2% CAGR through 2035. Cassia gum is a helpful ingredient in gluten-free formulations because it has a texture and viscosity similar to ingredients that contain gluten. Due to dietary choices or health concerns more consumers are adopting gluten-free diets which is driving up demand for cassia gums as a suitable alternative in gluten-free food products in the USA market.
One of the unique factors propelling the demand for cassia gums in China is the growing focus on natural ingredients and food safety which has helped the industry reach a 5.5% CAGR through 2035. Because they are concerned about artificial ingredients and food adulteration Chinese consumers are increasingly seeking out natural and clean label foods.
This trend is reinforced by cassia gum a naturally occurring thickening and stabilizing agent that is highly sought after for use in a range of food applications in Chinas rapidly expanding food and beverage industry.
One of the unique elements propelling cassia gum sales in the UK is the expanding trend of sustainable and eco-friendly products. Cassia gum is a natural product made from the seeds of the cassia tree which makes it ideal for the growing demand from consumers for environmentally friendly goods.
Businesses in Britain are increasingly using cassia gum in their food and beverage formulations to satisfy consumer demand for clean label and sustainable products. By 2035 this is helping cassia gums gain a 1.8% compound annual growth rate in the UK.
Participants in the global cassia gum market have a variety of objectives. In a variety of industries such as food medicine and cosmetics they hope to take advantage of the rising demand for natural and plant-based products. They diligently seek to develop new applications for cassia gum in order to expand its utility and commercial reach.
Businesses work hard to meet stringent standards for product quality and ensure reliable supply chains in order to consistently meet customer demands. Through distribution contracts acquisitions and strategic alliances, they focus on expanding their market share and obtaining a competitive edge in the global cassia gum industry.
By application, methods industry has been categorized into Food and Beverages and Manufacturing Segment
The market spans North America, Latin America, Western Europe, Eastern Europe, South Asia & Pacific, East Asia, Central Asia, Balkan and Baltic Countries, Russia and Belarus, and The Middle East & Africa.
The market is expected to grow at a CAGR of 7.6% throughout the forecast period.
By 2035, the sales value is expected to be worth USD 35.67 Billion.
Increase in bakery products is increasing demand for Cassia Gum Market.
North America is expected to dominate the global consumption.
Some of the key players in manufacturing include Agro Gums, Altrafine Gums, Avlast Hydrocolloids and more.


Full Research Suite comprises of:
Market outlook & trends analysis
Interviews & case studies
Strategic recommendations
Vendor profiles & capabilities analysis
5-year forecasts
8 regions and 60+ country-level data splits
Market segment data splits
12 months of continuous data updates
DELIVERED AS:
PDF EXCEL ONLINE
Food Grade Cassia Gum Powder Market Size and Share Forecast Outlook 2025 to 2035
Cassia Seed Extract Market Analysis by Application, Distribution Channel, and Region through 2035
Gum Rosin Market Size and Share Forecast Outlook 2025 to 2035
Gummed Tape Market Size and Share Forecast Outlook 2025 to 2035
Gummy Supplements Market Size and Share Forecast Outlook 2025 to 2035
Gum Arabic Market Analysis – Size, Share, and Forecast Outlook 2025 to 2035
Gummy Market Analysis by Product, Ingredient, End-Use, Distribution Channel, and Region - Forecast through 2025 to 2035
Gum Turpentine Oil Market Growth - Trends & Forecast 2025 to 2035
Gum Hydrocolloid Market Analysis by Product Type, Source, and Region through 2035
Key Companies & Market Share in the Gummed Tape Sector
Evaluating Gum Fiber Market Share & Provider Insights
Gum Content Tester Market
CBD Gummies Market Analysis - Size, Share and Forecast Outlook 2025 to 2035
Pre-Gummed Labels Market Growth - Demand & Forecast 2025 to 2035
Guar Gum Market Size and Share Forecast Outlook 2025 to 2035
Guar Gum for Construction Market Size and Share Forecast Outlook 2025 to 2035
Tara Gum Market Size and Share Forecast Outlook 2025 to 2035
Sleep Gummy Market Analysis by Primary Ingredient, Customer Orientation, Pack Size and Product Claim Through 2035
Paper Gummed Tape Market Growth - Demand & Forecast 2025 to 2035
CoQ10 Gummies Market Analysis by Source, Distribution Channels, and Key Regions Through 2035

Thank you!
You will receive an email from our Business Development Manager. Please be sure to check your SPAM/JUNK folder too.
Chat With
MaRIA