Mouth Freshener Market
Market Insights on Mouth Freshener covering sales outlook, demand forecast & up-to-date key trends
Mouth Freshener Market By Type, Distribution Channel & Region - Forecast 2022-2032
Mouth Freshener Market Outlook (2022-2032)
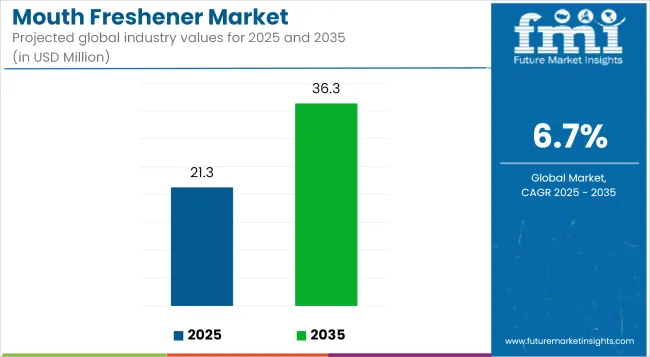
[324 Pages Report] The global mouth freshener market size is projected to be valued at US$ 18,150.3 Mn in 2022 and is anticipated to reach US$ 33,436.16 Mn by 2032, with a CAGR of 6.3% from 2022 to 2032.
Increasing awareness about oral care, rising tobacco, and alcohol consumption are major factors anticipated to boost the demand for mouth freshener during the forecast period. This aspect is expected to elevate the sales of mouth fresheners, which is expected to fuel the mouth freshener market growth.
Attributes |
Details |
Mouth Freshener Market CAGR (2022-2032) |
6.3% |
Mouth Freshener Market Value (2022) |
US$ 18,150.3 Mn |
Mouth Freshener Market Value (2032) |
US$ 33,436.16 Mn |
The rise in oral hygiene awareness among adults and youth globally is driving the global mouth freshener market share. Tobacco, smoking, and alcohol usage all contribute to mouth disorders such as bad breath and stained teeth. These are significant factors influencing the demand for mouth freshener, which in turn is projected to accelerate the sales of mouth fresheners in the future.
Furthermore, advanced packaging designs and materials, such as flip-top base packaging or sliding door type packaging, are some of the latest trends in the mouth freshener market.
Increased product portfolios and the use of various marketing tactics are likely to improve the demand for mouth freshener in the forecast period. Furthermore, sugar-free mouth fresheners from mouth freshener manufacturers are popular among health-conscious customers and are expected to enhance the sales of mouth fresheners. Caffeine, ginseng, and guarana, among other compounds, have been added to gum, breath fresheners, and mint which are acting as growth propellers in the mouth freshener market.
Customers in countries such as India prefer to use mouth freshener after meals as well. In the near future, the availability of a varied range of mouth fresheners is projected to boost mouth freshener market expansion. However, government regulations and interventions are anticipated to restrain the mouth freshener market growth in the forecast period of 2022-2032. While negative effects associated with mouth freshener consumption are anticipated to act as challenges in mouth freshener market.
Furthermore, the development of advanced packaging designs, as well as the use of marketing strategies such as ads and celebrity endorsements, are likely to provide growth opportunities for the mouth freshener market during the projection period.
Let us know your requirement to get
100% FREE customization
What are the Key Mouth Freshener Market Dynamics?
The global mouth freshener market size is predicted to expand as people become more conscious of the implications of oral hygiene. The availability of a wide variety of mouth fresheners is projected to boost demand development in the near future.
Mouth freshener manufacturers gain from changing consumer habits, modernization, and increased disposable money. Conversely, the appearance of counterfeit goods is anticipated to reduce the demand for mouth fresheners.
The sales of mouth fresheners are projected to grow as they are used in oral hygiene to prevent or minimize odor in the mouth. Mouth fresheners come in a variety of flavors, tastes, and other characteristics. These are also available in sugar-free varieties.
Due to the sheer increased demand for mouth fresheners, market participants are introducing new flavors such as mint, fruit, menthol, herbs, and spices. The sales of mouth fresheners are being driven due to alcohol and cigarette addiction. These factors present lucrative opportunity for the global mouth freshener market.
People who are addicted to cigarettes or alcohol frequently seek out mouth fresheners to refresh their breath. Given the prevalence of such habits among consumers, the demand for mouth freshener is anticipated to grow by 2032.
What are the Challenges in the Mouth Freshener Market?
The most significant restraint in the mouth freshener market is rising consumer concern about chemicals being consumed and chewed down into the throat. This rising awareness is impeding the mouth freshener market’s ability to offer its items to 100% of its customers.
As a result of this challenge, the global mouth freshener market is likely to face a steady decline. However, the mouth freshener market key players in the production of non-chemical mouth fresheners are raising awareness and dispelling myths in order to balance the sales of mouth freshener during the forecast period.
Find your sweet spots for generating winning opportunities in this market.
Talk to AnalystComparative View of Adjacent Mouth Freshener Market
Mouth Freshener Market:
Attributes |
Mouth Freshener Market |
CAGR (2022-2032) |
6.3% |
Market Value (2032) |
US$ 33,436.16 Mn |
Growth Factor |
The global mouth freshener market is expected to grow as people become more aware of the importance of oral hygiene. |
Opportunity |
During the forecast period, the development of improved package designs, as well as the utilisation of marketing methods are projected to present growth opportunities for the mouth freshener market. |
Key Trends |
Innovative packaging designs and materials, such as flip-top base packaging or sliding door type packaging, are among the most recent trends in the mouth freshener industry. |
Oral Spray Market:
Attributes |
Oral Spray Market |
CAGR (2022-2032) |
7% |
Market Value (2032) |
US$ 32 Bn |
Growth Factor |
Oral spray market share is being driven mostly by changing lifestyle preferences and increased consumer awareness about oral care worldwide. |
Opportunity |
The rising frequency of chronic diseases such as diabetes and asthma has increased global demand for medication oral sprays creating lucrative opportunities for the key players in the oral spray market. |
Key Trends |
Rising occurrences of dental caries and other tooth-related disorders, increased demand for aesthetic dentistry procedures, and technical improvements in the oral care products industry are all key trends in oral spray market. |
Oral Care Market:
Attributes |
Oral Care Market |
CAGR (2022-2032) |
3% |
Market Value (2032) |
US$ 45.39 Bn |
Growth Factor |
The introduction of electric brushes, charcoal-based teeth cleansers, and dental whitening products is expected to boost the expansion of the oral care industry. |
Opportunity |
Rising public awareness of health and oral hygiene, an increase in the number of dental clinics and oral cosmetic businesses, and rising population income will all have a favourable impact on the market's growth. |
Key Trends |
Recent advancements in the design of numerous dental and gum care mainstays is likely to benefit market expansion. |
Mouth fresheners are gaining popularity around the world as people become more aware of the necessity of maintaining proper oral hygiene. Some of the benefits of mouth fresheners include the generation of fresh breath, and the prevention of bacterial infection.
Increased oral hygiene programs around the world are propelling the mouth fresheners market's expansion. According to the FDI World Dental Association statistics issue, the 2018 World Oral Health Day campaign was expected to be one of the most fruitful efforts till date, reaching out to more than 700 million people worldwide.
Furthermore, the increased demand for mouth fresheners, especially in hotels, benefits product growth.
The increased global spending on dental care products has made a significant contribution to sales of mouth fresheners. According to the American Dental Association's dental industry study, the United States' spending on dental care is expected to be USD136 billion in 2018.
The increasing use of mouth fresheners by those suffering from halitosis as a result of poor breathing medical conditions is contributing to the increased demand for mouth fresheners.
Segmentation Outlook for the Mouth Freshener Market
Which Segment is Likely to Lead the Mouth Freshener Market by Type?
Mint candy is one of the most popular forms of mouth fresheners, accounting for 39 percent of the market in 2021. The product's easy availability in many nations is one of the major elements fuelling the segment's rise.
Demand for mint candy mouth fresheners is being driven by the availability of several taste and packaging varieties. For example, producers have created regional flavours, such as Paan flavour candies in India, which are accessible in several regions.
During the forecast period, the spray is expected to have the fastest CAGR of 6 percent in the mouth fresheners market. The segment is expected to develop due to widespread acceptability in nations where weapons are prohibited. Advertisement and brand personification have also been significant drivers of segment growth in the mouth fresheners market.
Which Segment is Likely to Dominate the Mouth Freshener Market by Distribution Channel?
In terms of market share, the retail outlets segment is expected to maintain its dominance in the mouth fresheners market. The ease of availability is the primary element driving category expansion. This distribution channel is projected to develop in the near future due to the presence of a high number of outlets and convenient product availability.
During the projected period, the online shop segment is expected to grow at a 5.6 percent CAGR in the mouth fresheners market. The segment is being driven by increased internet access in rural regions, faster and more reliable delivery by numerous online portals, and simple replacement choices.
Which Region is Leading in the Mouth Freshener Market?
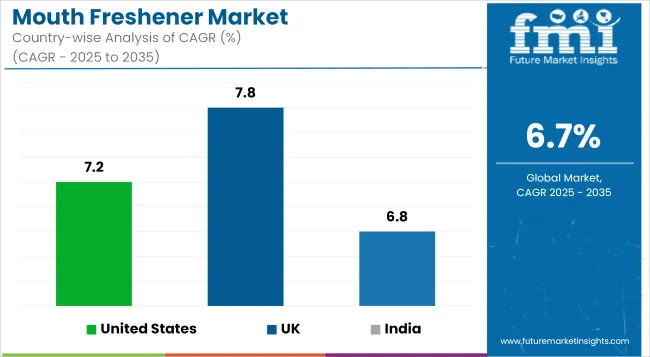
North America maintained the leading market share of 44 percent in 2021 and is expected to develop rapidly. Due to strong demand and consumption of alcohol and tobacco, the United States accounts for the majority of the mouth fresheners market in North America and is predicted to exhibit a CAGR of roughly 3.6 percent over the forecast period.
Furthermore, the strong presence of multinational players across geographies, the availability of diverse alternatives, and the premiumization of mouth fresheners are all boosting the mouth fresheners market growth. Furthermore, the region's heavy consumption of alcohol and tobacco is encouraging the adoption of mouth fresheners.
What is the Growth Outlook of Asia Pacific Mouth Freshener Market?
Due to the increased consumption of smokeless tobacco such as dip, snuff, snus, and chewing, Asia Pacific is expected to see significant development in the mouth fresheners market. Furthermore, the sweet consumption custom observed by nations such as India, Nepal, Pakistan, and others during festivals and occasions contributes to the increased sales of mouth fresheners.
Due to increasing demand for mouth fresheners from growing countries such as India and China, Asia Pacific is predicted to rise at the quickest CAGR over the forecast period. Changing lifestyles and more disposable income are anticipated to boost mouth fresheners market growth even further.
Competition Landscape of Mouth Freshener Market
The global market for mouth fresheners is very fragmented. Several small manufacturers account for roughly 10% - 15% of the global mouth freshener market. Due to the low cost of manufacture, there are an increasing number of small vendors in the mouth fresheners market.
How is the Start-up Ecosystem in the Mouth Freshener Market?
To stay competitive in the industry, startups in the mouth fresheners market are significantly contributing to market growth by using various methods such as merger and acquisition, expansion, new marketing techniques, investment for small businesses, and new product releases.
For example, Perfetti Van Melle-owned brand Mentos announced the debut of new Mentos CleanBreath hard mints in 2018, which will deliver clean and fresh breath for around 30 minutes. These sugar-free firm mints include a layer of green tea extract between two layers of flavour and freshness.
Key Players in the Mouth Freshener Market:
- Perfetti Van Melle
- The Hershey Company
- HARIBO GmbH & Co. KG
- Mondelez
- The Kraft Heinz Company
- Ferndale Confectionery Pty Ltd
- Leaf Holland BV
- Mars Incorporated
- Wrigley Jr. Company
Recent Developments in the Mouth Freshener Market
- 15th July, 2021- Ferndale Confectionery, a major player in the global mouth fresheners business, built a new factory in Ballarat.
- Colgate-Palmolive Company released Colgate Plax liquid mouth freshener, which was highly appreciated by consumers, greatly increasing total growth.
- Tom's of Maine delayed the launch of its new silly strawberry natural mouthwash for children in October 2018.
- Colgate announced the release of their CBD product range, which includes mouthwash, toothpaste, and dental floss, in February 2020.
Key Segments
By Type:
- Mouth Sprays
- Breath Strips
- Flavored Candles
- Chewing Gums
- Others
By Distribution Channel:
- Sugar-free
- Conventional
By Region:
- North America
- Latin America
- Europe
- Asia Pacific
- MEA
Frequently Asked Questions
Mouth fresheners market is projected to have a CAGR of 6.3% through 2032.
North America is the leading region in the mouth freshener market.
By type, mint candy segment is expected to dominate the market.
Mouth fresheners market is predicted to grow US$ 33,436.16 Mn by 2032.
Table of Content
1. Executive Summary
1.1. Global Market Outlook
1.2. Demand-side Trends
1.3. Supply-side Trends
1.4. Technology Roadmap Analysis
1.5. Analysis and Recommendations
2. Market Overview
2.1. Market Coverage / Taxonomy
2.2. Market Definition / Scope / Limitations
3. Market Background
3.1. Market Dynamics
3.1.1. Drivers
3.1.2. Restraints
3.1.3. Opportunity
3.1.4. Trends
3.2. Scenario Forecast
3.2.1. Demand in Optimistic Scenario
3.2.2. Demand in Likely Scenario
3.2.3. Demand in Conservative Scenario
3.3. Opportunity Map Analysis
3.4. Product Life Cycle Analysis
3.5. Supply Chain Analysis
3.5.1. Supply Side Participants and their Roles
3.5.1.1. Producers
3.5.1.2. Mid-Level Participants (Traders/ Agents/ Brokers)
3.5.1.3. Wholesalers and Distributors
3.5.2. Value Added and Value Created at Node in the Supply Chain
3.5.3. List of Raw Material Suppliers
3.5.4. List of Existing and Potential Buyer’s
3.6. Investment Feasibility Matrix
3.7. Value Chain Analysis
3.7.1. Profit Margin Analysis
3.7.2. Wholesalers and Distributors
3.7.3. Retailers
3.8. PESTLE and Porter’s Analysis
3.9. Regulatory Landscape
3.9.1. By Key Regions
3.9.2. By Key Countries
3.10. Regional Parent Market Outlook
3.11. Production and Consumption Statistics
3.12. Import and Export Statistics
4. Global Market Analysis 2017-2021 and Forecast, 2022-2032
4.1. Historical Market Size Value (US$ Mn) & Volume (Tons) Analysis, 2017-2021
4.2. Current and Future Market Size Value (US$ Mn) & Volume (Tons) Projections, 2022-2032
4.2.1. Y-o-Y Growth Trend Analysis
4.2.2. Absolute $ Opportunity Analysis
5. Global Market Analysis 2017-2021 and Forecast 2022-2032, By Type
5.1. Introduction / Key Findings
5.2. Historical Market Size Value (US$ Mn) & Volume (Tons) Analysis By Type, 2017-2021
5.3. Current and Future Market Size Value (US$ Mn) & Volume (Tons) Analysis and Forecast By Type, 2022-2032
5.3.1. Spray
5.3.2. Mint Candies
5.3.3. Gums
5.3.4. Others
5.4. Y-o-Y Growth Trend Analysis By Type, 2017-2021
5.5. Absolute $ Opportunity Analysis By Type, 2022-2032
6. Global Market Analysis 2017-2021 and Forecast 2022-2032, By Distribution Channel
6.1. Introduction / Key Findings
6.2. Historical Market Size Value (US$ Mn) & Volume (Tons) Analysis By Distribution Channel, 2017-2021
6.3. Current and Future Market Size Value (US$ Mn) & Volume (Tons) Analysis and Forecast By Distribution Channel, 2022-2032
6.3.1. Online Stores
6.3.2. Retail Stores
6.4. Y-o-Y Growth Trend Analysis By Distribution Channel, 2017-2021
6.5. Absolute $ Opportunity Analysis By Distribution Channel, 2022-2032
7. Global Market Analysis 2017-2021 and Forecast 2022-2032, By Region
7.1. Introduction
7.2. Historical Market Size Value (US$ Mn) & Volume (Tons) Analysis By Region, 2017-2021
7.3. Current Market Size Value (US$ Mn) & Volume (Tons) Analysis and Forecast By Region, 2022-2032
7.3.1. North America
7.3.2. Latin America
7.3.3. Europe
7.3.4. Asia Pacific
7.3.5. MEA
7.4. Market Attractiveness Analysis By Region
8. North America Market Analysis 2017-2021 and Forecast 2022-2032, By Country
8.1. Historical Market Size Value (US$ Mn) & Volume (Tons) Trend Analysis By Market Taxonomy, 2017-2021
8.2. Market Size Value (US$ Mn) & Volume (Tons) Forecast By Market Taxonomy, 2022-2032
8.2.1. By Country
8.2.1.1. U.S.
8.2.1.2. Canada
8.2.2. By Type
8.2.3. By Distribution Channel
8.3. Market Attractiveness Analysis
8.3.1. By Country
8.3.2. By Type
8.3.3. By Distribution Channel
8.4. Key Takeaways
9. Latin America Market Analysis 2017-2021 and Forecast 2022-2032, By Country
9.1. Historical Market Size Value (US$ Mn) & Volume (Tons) Trend Analysis By Market Taxonomy, 2017-2021
9.2. Market Size Value (US$ Mn) & Volume (Tons) Forecast By Market Taxonomy, 2022-2032
9.2.1. By Country
9.2.1.1. Brazil
9.2.1.2. Mexico
9.2.1.3. Rest of Latin America
9.2.2. By Type
9.2.3. By Distribution Channel
9.3. Market Attractiveness Analysis
9.3.1. By Country
9.3.2. By Type
9.3.3. By Distribution Channel
9.4. Key Takeaways
10. Europe Market Analysis 2017-2021 and Forecast 2022-2032, By Country
10.1. Historical Market Size Value (US$ Mn) & Volume (Tons) Trend Analysis By Market Taxonomy, 2017-2021
10.2. Market Size Value (US$ Mn) & Volume (Tons) Forecast By Market Taxonomy, 2022-2032
10.2.1. By Country
10.2.1.1. Germany
10.2.1.2. U.K.
10.2.1.3. France
10.2.1.4. Spain
10.2.1.5. Italy
10.2.1.6. Rest of Europe
10.2.2. By Type
10.2.3. By Distribution Channel
10.3. Market Attractiveness Analysis
10.3.1. By Country
10.3.2. By Type
10.3.3. By Distribution Channel
10.4. Key Takeaways
11. Asia Pacific Market Analysis 2017-2021 and Forecast 2022-2032, By Country
11.1. Historical Market Size Value (US$ Mn) & Volume (Tons) Trend Analysis By Market Taxonomy, 2017-2021
11.2. Market Size Value (US$ Mn) & Volume (Tons) Forecast By Market Taxonomy, 2022-2032
11.2.1. By Country
11.2.1.1. China
11.2.1.2. Japan
11.2.1.3. South Korea
11.2.1.4. Malaysia
11.2.1.5. Singapore
11.2.1.6. Australia
11.2.1.7. New Zealand
11.2.1.8. Rest of APAC
11.2.2. By Type
11.2.3. By Distribution Channel
11.3. Market Attractiveness Analysis
11.3.1. By Country
11.3.2. By Type
11.3.3. By Distribution Channel
11.4. Key Takeaways
12. MEA Market Analysis 2017-2021 and Forecast 2022-2032, By Country
12.1. Historical Market Size Value (US$ Mn) & Volume (Tons) Trend Analysis By Market Taxonomy, 2017-2021
12.2. Market Size Value (US$ Mn) & Volume (Tons) Forecast By Market Taxonomy, 2022-2032
12.2.1. By Country
12.2.1.1. GCC Countries
12.2.1.2. South Africa
12.2.1.3. Israel
12.2.1.4. Rest of MEA
12.2.2. By Type
12.2.3. By Distribution Channel
12.3. Market Attractiveness Analysis
12.3.1. By Country
12.3.2. By Type
12.3.3. By Distribution Channel
12.4. Key Takeaways
13. Key Countries Market Analysis
13.1. U.S.
13.1.1. Pricing Analysis
13.1.2. Market Share Analysis, 2021
13.1.2.1. By Type
13.1.2.2. By Distribution Channel
13.2. Canada
13.2.1. Pricing Analysis
13.2.2. Market Share Analysis, 2021
13.2.2.1. By Type
13.2.2.2. By Distribution Channel
13.3. Brazil
13.3.1. Pricing Analysis
13.3.2. Market Share Analysis, 2021
13.3.2.1. By Type
13.3.2.2. By Distribution Channel
13.4. Mexico
13.4.1. Pricing Analysis
13.4.2. Market Share Analysis, 2021
13.4.2.1. By Type
13.4.2.2. By Distribution Channel
13.5. Germany
13.5.1. Pricing Analysis
13.5.2. Market Share Analysis, 2021
13.5.2.1. By Type
13.5.2.2. By Distribution Channel
13.6. U.K.
13.6.1. Pricing Analysis
13.6.2. Market Share Analysis, 2021
13.6.2.1. By Type
13.6.2.2. By Distribution Channel
13.7. France
13.7.1. Pricing Analysis
13.7.2. Market Share Analysis, 2021
13.7.2.1. By Type
13.7.2.2. By Distribution Channel
13.8. Spain
13.8.1. Pricing Analysis
13.8.2. Market Share Analysis, 2021
13.8.2.1. By Type
13.8.2.2. By Distribution Channel
13.9. Italy
13.9.1. Pricing Analysis
13.9.2. Market Share Analysis, 2021
13.9.2.1. By Type
13.9.2.2. By Distribution Channel
13.10. China
13.10.1. Pricing Analysis
13.10.2. Market Share Analysis, 2021
13.10.2.1. By Type
13.10.2.2. By Distribution Channel
13.11. Japan
13.11.1. Pricing Analysis
13.11.2. Market Share Analysis, 2021
13.11.2.1. By Type
13.11.2.2. By Distribution Channel
13.12. South Korea
13.12.1. Pricing Analysis
13.12.2. Market Share Analysis, 2021
13.12.2.1. By Type
13.12.2.2. By Distribution Channel
13.13. Malaysia
13.13.1. Pricing Analysis
13.13.2. Market Share Analysis, 2021
13.13.2.1. By Type
13.13.2.2. By Distribution Channel
13.14. Singapore
13.14.1. Pricing Analysis
13.14.2. Market Share Analysis, 2021
13.14.2.1. By Type
13.14.2.2. By Distribution Channel
13.15. Australia
13.15.1. Pricing Analysis
13.15.2. Market Share Analysis, 2021
13.15.2.1. By Type
13.15.2.2. By Distribution Channel
13.16. New Zealand
13.16.1. Pricing Analysis
13.16.2. Market Share Analysis, 2021
13.16.2.1. By Type
13.16.2.2. By Distribution Channel
13.17. GCC Countries
13.17.1. Pricing Analysis
13.17.2. Market Share Analysis, 2021
13.17.2.1. By Type
13.17.2.2. By Distribution Channel
13.18. South Africa
13.18.1. Pricing Analysis
13.18.2. Market Share Analysis, 2021
13.18.2.1. By Type
13.18.2.2. By Distribution Channel
13.19. Israel
13.19.1. Pricing Analysis
13.19.2. Market Share Analysis, 2021
13.19.2.1. By Type
13.19.2.2. By Distribution Channel
14. Market Structure Analysis
14.1. Competition Dashboard
14.2. Competition Benchmarking
14.3. Market Share Analysis of Top Players
14.3.1. By Regional
14.3.2. By Type
14.3.3. By Distribution Channel
15. Competition Analysis
15.1. Competition Deep Dive
15.1.1. Johnson & Johnson
15.1.1.1. Overview
15.1.1.2. Product Portfolio
15.1.1.3. Profitability by Market Segments
15.1.1.4. Sales Footprint
15.1.1.5. Strategy Overview
15.1.1.5.1. Marketing Strategy
15.1.1.5.2. Product Strategy
15.1.1.5.3. Channel Strategy
15.1.2. Mars
15.1.2.1. Overview
15.1.2.2. Product Portfolio
15.1.2.3. Profitability by Market Segments
15.1.2.4. Sales Footprint
15.1.2.5. Strategy Overview
15.1.2.5.1. Marketing Strategy
15.1.2.5.2. Product Strategy
15.1.2.5.3. Channel Strategy
15.1.3. The Hershey Company
15.1.3.1. Overview
15.1.3.2. Product Portfolio
15.1.3.3. Profitability by Market Segments
15.1.3.4. Sales Footprint
15.1.3.5. Strategy Overview
15.1.3.5.1. Marketing Strategy
15.1.3.5.2. Product Strategy
15.1.3.5.3. Channel Strategy
15.1.4. Perfetti Van Melle
15.1.4.1. Overview
15.1.4.2. Product Portfolio
15.1.4.3. Profitability by Market Segments
15.1.4.4. Sales Footprint
15.1.4.5. Strategy Overview
15.1.4.5.1. Marketing Strategy
15.1.4.5.2. Product Strategy
15.1.4.5.3. Channel Strategy
15.1.5. lotte
15.1.5.1. Overview
15.1.5.2. Product Portfolio
15.1.5.3. Profitability by Market Segments
15.1.5.4. Sales Footprint
15.1.5.5. Strategy Overview
15.1.5.5.1. Marketing Strategy
15.1.5.5.2. Product Strategy
15.1.5.5.3. Channel Strategy
15.1.6. Haribo GmbH & Co
15.1.6.1. Overview
15.1.6.2. Product Portfolio
15.1.6.3. Profitability by Market Segments
15.1.6.4. Sales Footprint
15.1.6.5. Strategy Overview
15.1.6.5.1. Marketing Strategy
15.1.6.5.2. Product Strategy
15.1.6.5.3. Channel Strategy
15.1.7. Midas Care
15.1.7.1. Overview
15.1.7.2. Product Portfolio
15.1.7.3. Profitability by Market Segments
15.1.7.4. Sales Footprint
15.1.7.5. Strategy Overview
15.1.7.5.1. Marketing Strategy
15.1.7.5.2. Product Strategy
15.1.7.5.3. Channel Strategy
15.1.8. Dabur Binaca
15.1.8.1. Overview
15.1.8.2. Product Portfolio
15.1.8.3. Profitability by Market Segments
15.1.8.4. Sales Footprint
15.1.8.5. Strategy Overview
15.1.8.5.1. Marketing Strategy
15.1.8.5.2. Product Strategy
15.1.8.5.3. Channel Strategy
15.1.9. Cadbury Brothers Limited
15.1.9.1. Overview
15.1.9.2. Product Portfolio
15.1.9.3. Profitability by Market Segments
15.1.9.4. Sales Footprint
15.1.9.5. Strategy Overview
15.1.9.5.1. Marketing Strategy
15.1.9.5.2. Product Strategy
15.1.9.5.3. Channel Strategy
16. Assumptions & Acronyms Used
17. Research Methodology
Let us know your requirement to get
100% FREE customization
List of Tables
Table 1: Global Market Value (US$ Mn) Forecast by Region, 2017-2032
Table 2: Global Market Volume (Tons) Forecast by Region, 2017-2032
Table 3: Global Market Value (US$ Mn) Forecast by Type, 2017-2032
Table 4: Global Market Volume (Tons) Forecast by Type, 2017-2032
Table 5: Global Market Value (US$ Mn) Forecast by Distribution Channel, 2017-2032
Table 6: Global Market Volume (Tons) Forecast by Distribution Channel, 2017-2032
Table 7: North America Market Value (US$ Mn) Forecast by Country, 2017-2032
Table 8: North America Market Volume (Tons) Forecast by Country, 2017-2032
Table 9: North America Market Value (US$ Mn) Forecast by Type, 2017-2032
Table 10: North America Market Volume (Tons) Forecast by Type, 2017-2032
Table 11: North America Market Value (US$ Mn) Forecast by Distribution Channel, 2017-2032
Table 12: North America Market Volume (Tons) Forecast by Distribution Channel, 2017-2032
Table 13: Latin America Market Value (US$ Mn) Forecast by Country, 2017-2032
Table 14: Latin America Market Volume (Tons) Forecast by Country, 2017-2032
Table 15: Latin America Market Value (US$ Mn) Forecast by Type, 2017-2032
Table 16: Latin America Market Volume (Tons) Forecast by Type, 2017-2032
Table 17: Latin America Market Value (US$ Mn) Forecast by Distribution Channel, 2017-2032
Table 18: Latin America Market Volume (Tons) Forecast by Distribution Channel, 2017-2032
Table 19: Europe Market Value (US$ Mn) Forecast by Country, 2017-2032
Table 20: Europe Market Volume (Tons) Forecast by Country, 2017-2032
Table 21: Europe Market Value (US$ Mn) Forecast by Type, 2017-2032
Table 22: Europe Market Volume (Tons) Forecast by Type, 2017-2032
Table 23: Europe Market Value (US$ Mn) Forecast by Distribution Channel, 2017-2032
Table 24: Europe Market Volume (Tons) Forecast by Distribution Channel, 2017-2032
Table 25: Asia Pacific Market Value (US$ Mn) Forecast by Country, 2017-2032
Table 26: Asia Pacific Market Volume (Tons) Forecast by Country, 2017-2032
Table 27: Asia Pacific Market Value (US$ Mn) Forecast by Type, 2017-2032
Table 28: Asia Pacific Market Volume (Tons) Forecast by Type, 2017-2032
Table 29: Asia Pacific Market Value (US$ Mn) Forecast by Distribution Channel, 2017-2032
Table 30: Asia Pacific Market Volume (Tons) Forecast by Distribution Channel, 2017-2032
Table 31: MEA Market Value (US$ Mn) Forecast by Country, 2017-2032
Table 32: MEA Market Volume (Tons) Forecast by Country, 2017-2032
Table 33: MEA Market Value (US$ Mn) Forecast by Type, 2017-2032
Table 34: MEA Market Volume (Tons) Forecast by Type, 2017-2032
Table 35: MEA Market Value (US$ Mn) Forecast by Distribution Channel, 2017-2032
Table 36: MEA Market Volume (Tons) Forecast by Distribution Channel, 2017-2032
Find your sweet spots for generating winning opportunities in this market.
Talk to AnalystList of Charts
Figure 1: Global Market Value (US$ Mn) by Type, 2022-2032
Figure 2: Global Market Value (US$ Mn) by Distribution Channel, 2022-2032
Figure 3: Global Market Value (US$ Mn) by Region, 2022-2032
Figure 4: Global Market Value (US$ Mn) Analysis by Region, 2017-2032
Figure 5: Global Market Volume (Tons) Analysis by Region, 2017-2032
Figure 6: Global Market Value Share (%) and BPS Analysis by Region, 2022-2032
Figure 7: Global Market Y-o-Y Growth (%) Projections by Region, 2022-2032
Figure 8: Global Market Value (US$ Mn) Analysis by Type, 2017-2032
Figure 9: Global Market Volume (Tons) Analysis by Type, 2017-2032
Figure 10: Global Market Value Share (%) and BPS Analysis by Type, 2022-2032
Figure 11: Global Market Y-o-Y Growth (%) Projections by Type, 2022-2032
Figure 12: Global Market Value (US$ Mn) Analysis by Distribution Channel, 2017-2032
Figure 13: Global Market Volume (Tons) Analysis by Distribution Channel, 2017-2032
Figure 14: Global Market Value Share (%) and BPS Analysis by Distribution Channel, 2022-2032
Figure 15: Global Market Y-o-Y Growth (%) Projections by Distribution Channel, 2022-2032
Figure 16: Global Market Attractiveness by Type, 2022-2032
Figure 17: Global Market Attractiveness by Distribution Channel, 2022-2032
Figure 18: Global Market Attractiveness by Region, 2022-2032
Figure 19: North America Market Value (US$ Mn) by Type, 2022-2032
Figure 20: North America Market Value (US$ Mn) by Distribution Channel, 2022-2032
Figure 21: North America Market Value (US$ Mn) by Country, 2022-2032
Figure 22: North America Market Value (US$ Mn) Analysis by Country, 2017-2032
Figure 23: North America Market Volume (Tons) Analysis by Country, 2017-2032
Figure 24: North America Market Value Share (%) and BPS Analysis by Country, 2022-2032
Figure 25: North America Market Y-o-Y Growth (%) Projections by Country, 2022-2032
Figure 26: North America Market Value (US$ Mn) Analysis by Type, 2017-2032
Figure 27: North America Market Volume (Tons) Analysis by Type, 2017-2032
Figure 28: North America Market Value Share (%) and BPS Analysis by Type, 2022-2032
Figure 29: North America Market Y-o-Y Growth (%) Projections by Type, 2022-2032
Figure 30: North America Market Value (US$ Mn) Analysis by Distribution Channel, 2017-2032
Figure 31: North America Market Volume (Tons) Analysis by Distribution Channel, 2017-2032
Figure 32: North America Market Value Share (%) and BPS Analysis by Distribution Channel, 2022-2032
Figure 33: North America Market Y-o-Y Growth (%) Projections by Distribution Channel, 2022-2032
Figure 34: North America Market Attractiveness by Type, 2022-2032
Figure 35: North America Market Attractiveness by Distribution Channel, 2022-2032
Figure 36: North America Market Attractiveness by Country, 2022-2032
Figure 37: Latin America Market Value (US$ Mn) by Type, 2022-2032
Figure 38: Latin America Market Value (US$ Mn) by Distribution Channel, 2022-2032
Figure 39: Latin America Market Value (US$ Mn) by Country, 2022-2032
Figure 40: Latin America Market Value (US$ Mn) Analysis by Country, 2017-2032
Figure 41: Latin America Market Volume (Tons) Analysis by Country, 2017-2032
Figure 42: Latin America Market Value Share (%) and BPS Analysis by Country, 2022-2032
Figure 43: Latin America Market Y-o-Y Growth (%) Projections by Country, 2022-2032
Figure 44: Latin America Market Value (US$ Mn) Analysis by Type, 2017-2032
Figure 45: Latin America Market Volume (Tons) Analysis by Type, 2017-2032
Figure 46: Latin America Market Value Share (%) and BPS Analysis by Type, 2022-2032
Figure 47: Latin America Market Y-o-Y Growth (%) Projections by Type, 2022-2032
Figure 48: Latin America Market Value (US$ Mn) Analysis by Distribution Channel, 2017-2032
Figure 49: Latin America Market Volume (Tons) Analysis by Distribution Channel, 2017-2032
Figure 50: Latin America Market Value Share (%) and BPS Analysis by Distribution Channel, 2022-2032
Figure 51: Latin America Market Y-o-Y Growth (%) Projections by Distribution Channel, 2022-2032
Figure 52: Latin America Market Attractiveness by Type, 2022-2032
Figure 53: Latin America Market Attractiveness by Distribution Channel, 2022-2032
Figure 54: Latin America Market Attractiveness by Country, 2022-2032
Figure 55: Europe Market Value (US$ Mn) by Type, 2022-2032
Figure 56: Europe Market Value (US$ Mn) by Distribution Channel, 2022-2032
Figure 57: Europe Market Value (US$ Mn) by Country, 2022-2032
Figure 58: Europe Market Value (US$ Mn) Analysis by Country, 2017-2032
Figure 59: Europe Market Volume (Tons) Analysis by Country, 2017-2032
Figure 60: Europe Market Value Share (%) and BPS Analysis by Country, 2022-2032
Figure 61: Europe Market Y-o-Y Growth (%) Projections by Country, 2022-2032
Figure 62: Europe Market Value (US$ Mn) Analysis by Type, 2017-2032
Figure 63: Europe Market Volume (Tons) Analysis by Type, 2017-2032
Figure 64: Europe Market Value Share (%) and BPS Analysis by Type, 2022-2032
Figure 65: Europe Market Y-o-Y Growth (%) Projections by Type, 2022-2032
Figure 66: Europe Market Value (US$ Mn) Analysis by Distribution Channel, 2017-2032
Figure 67: Europe Market Volume (Tons) Analysis by Distribution Channel, 2017-2032
Figure 68: Europe Market Value Share (%) and BPS Analysis by Distribution Channel, 2022-2032
Figure 69: Europe Market Y-o-Y Growth (%) Projections by Distribution Channel, 2022-2032
Figure 70: Europe Market Attractiveness by Type, 2022-2032
Figure 71: Europe Market Attractiveness by Distribution Channel, 2022-2032
Figure 72: Europe Market Attractiveness by Country, 2022-2032
Figure 73: Asia Pacific Market Value (US$ Mn) by Type, 2022-2032
Figure 74: Asia Pacific Market Value (US$ Mn) by Distribution Channel, 2022-2032
Figure 75: Asia Pacific Market Value (US$ Mn) by Country, 2022-2032
Figure 76: Asia Pacific Market Value (US$ Mn) Analysis by Country, 2017-2032
Figure 77: Asia Pacific Market Volume (Tons) Analysis by Country, 2017-2032
Figure 78: Asia Pacific Market Value Share (%) and BPS Analysis by Country, 2022-2032
Figure 79: Asia Pacific Market Y-o-Y Growth (%) Projections by Country, 2022-2032
Figure 80: Asia Pacific Market Value (US$ Mn) Analysis by Type, 2017-2032
Figure 81: Asia Pacific Market Volume (Tons) Analysis by Type, 2017-2032
Figure 82: Asia Pacific Market Value Share (%) and BPS Analysis by Type, 2022-2032
Figure 83: Asia Pacific Market Y-o-Y Growth (%) Projections by Type, 2022-2032
Figure 84: Asia Pacific Market Value (US$ Mn) Analysis by Distribution Channel, 2017-2032
Figure 85: Asia Pacific Market Volume (Tons) Analysis by Distribution Channel, 2017-2032
Figure 86: Asia Pacific Market Value Share (%) and BPS Analysis by Distribution Channel, 2022-2032
Figure 87: Asia Pacific Market Y-o-Y Growth (%) Projections by Distribution Channel, 2022-2032
Figure 88: Asia Pacific Market Attractiveness by Type, 2022-2032
Figure 89: Asia Pacific Market Attractiveness by Distribution Channel, 2022-2032
Figure 90: Asia Pacific Market Attractiveness by Country, 2022-2032
Figure 91: MEA Market Value (US$ Mn) by Type, 2022-2032
Figure 92: MEA Market Value (US$ Mn) by Distribution Channel, 2022-2032
Figure 93: MEA Market Value (US$ Mn) by Country, 2022-2032
Figure 94: MEA Market Value (US$ Mn) Analysis by Country, 2017-2032
Figure 95: MEA Market Volume (Tons) Analysis by Country, 2017-2032
Figure 96: MEA Market Value Share (%) and BPS Analysis by Country, 2022-2032
Figure 97: MEA Market Y-o-Y Growth (%) Projections by Country, 2022-2032
Figure 98: MEA Market Value (US$ Mn) Analysis by Type, 2017-2032
Figure 99: MEA Market Volume (Tons) Analysis by Type, 2017-2032
Figure 100: MEA Market Value Share (%) and BPS Analysis by Type, 2022-2032
Figure 101: MEA Market Y-o-Y Growth (%) Projections by Type, 2022-2032
Figure 102: MEA Market Value (US$ Mn) Analysis by Distribution Channel, 2017-2032
Figure 103: MEA Market Volume (Tons) Analysis by Distribution Channel, 2017-2032
Figure 104: MEA Market Value Share (%) and BPS Analysis by Distribution Channel, 2022-2032
Figure 105: MEA Market Y-o-Y Growth (%) Projections by Distribution Channel, 2022-2032
Figure 106: MEA Market Attractiveness by Type, 2022-2032
Figure 107: MEA Market Attractiveness by Distribution Channel, 2022-2032
Figure 108: MEA Market Attractiveness by Country, 2022-2032
Need specific information?
Request CustomizationExplore Food and Beverage Insights
View Reports