Reports

- Global Locations -

Headquarters

Future Market Insights, Inc.

Christiana Corporate, 200
Continental Drive, Suite 401,
Newark, Delaware - 19713,
United States

T: +1-845-579-5705

Americas

Future Market Insights, Inc.

616 Corporate Way, Suite 2-9018,
Valley Cottage, NY 10989, United States

T: +1-347-918-3531

MEA

Future Market Insights

1602-6 Jumeirah Bay X2 Tower, Plot No: JLT-PH2-X2A,
Jumeirah Lakes Towers, Dubai,
United Arab Emirates

Europe

Future Market Insights

3rd Floor, 207 Regent Street,
W1B 3HH London
United Kingdom

T: + 44 (0) 20 8123 9659
D: +44 (0) 20 3287 4268

Asia Pacific

Future Market Insights

IndiaLand Global Tech Park, Unit UG-1, Behind Grand HighStreet, Phase 1, Hinjawadi, MH, Pune – 411057, India

Paint Ingredient Market Outlook (2022 to 2032)

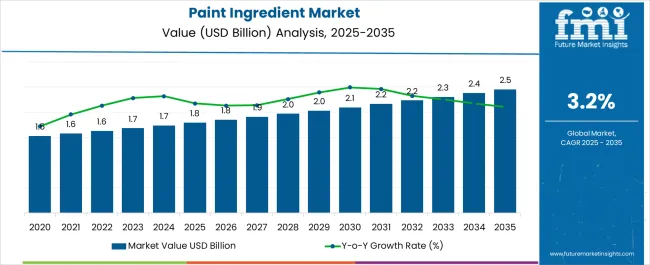
The global paint ingredient market is projected to reach US$ 2,230 Million in 2032 while expanding at a CAGR of 3.2%. The market is likely to hold a value of US$ 1,630 Million in 2022. Due to their odorless characteristics and ability to have a lower environmental impact, eco-friendly paints have become increasingly popular. Environmentally friendly products are becoming increasingly popular, which has been an instrumental factor in the growth of this market. From 2016 to 2021, the market displayed a growth rate of 2.5%.

Paint manufacturing is one industry that relies on automatic control technologies. As far as the paint industry is concerned, the composition of the paint is of the utmost importance. In order to overcome this problem, a wide range of methods is being employed. Painting composition was done manually in the past but sometimes didn't meet the required color. In order to solve the manual paint composition problem, automatic paint preparation techniques were used.

An array of smart dispensing solutions can make it hard to choose the ideal paint-mixing machine. In the decision to invest in automatic Ingredients, it is imperative to consider a few important parameters, including the growth plan, customer requirements, enterprise outcomes, and the total cost of ownership.

Paint Ingredients are used to mix different colors of paint in the correct proportion, based on various formulas. A professional painter, a DIYer, or any other end user uses the product after mixing it for painting. With people around the world changing the aesthetics of their homes, offices, and other establishments at a rapid pace, the world of interior design and décor is growing at an incredible rate. With modern paint Ingredients, users can easily customize the exact color of their space with paint. Paint is a great way to transform a space's visual appeal.

Paint mixers will gain market share in the near future as FMCG companies in India China, and Singapore continue to expand their operations in these countries. The market is also expected to benefit from rapid industrialization, increasing government infrastructure spending, and increased foreign direct investment.

Data Points Key Statistics
Expected Base Year Value (2022) US$ 1,630 Million
Anticipated Forecast Value (2032) US$ 2,230 Million
Estimated Growth (2022 to 2032) 3.2% CAGR

Don't pay for what you don't need

Customize your report by selecting specific countries or regions and save 30%!

What is Driving Demand for Paint Ingredient Market?

Paint mixers are one of the most profitable businesses these days. Various aspects of the economy require a high amount of paint. In addition to technological advancements, the introduction of innovative products such as automatic paint mixers and other products is expected to boost future growth.

In recent years, eco-friendly paints have become more popular because of their odorless qualities and lower negative environmental impact. The market is growing as people switch to environmentally friendly products. With the advancement of technology, automatic paint mixers have been developed to reduce labor and worker intervention in paint mixing. In the newly developed and advanced automatic mixer, powders and pigments are blended with polyurethane, epoxy, polyester, and acrylic resins without the presence of any air.

Increasing demand for DIY projects as well as experimentation with paints, often driven by the emerging social media trend, is supporting the growth of the market for paint Ingredients. Many users are trying out unique color combinations, textures, and even scents that can be incorporated into their paint with effective paint Ingredients.

Further, the market is expected to benefit from higher consumption of automotive, construction, and general industrial products. Several emerging countries where there are high rates of urbanization and industrialization, such as India, China, and Southeast Asia, are expected to see a rapid rise in the demand for products in various applications.

Restrictive Factors for the Global Paint Ingredient Market?

The increasing cost of handheld and automated machines on the market is likely to hamper the growth of the market. Although there are a few designs that look impressive, they present an ineffective way of mixing them, which in turn could further hamper the market's growth. Economic slowdowns in developing countries will also hamper the growth of this market. As a consequence of high raw material costs, it will be even harder for the paint ingredients market to grow as a whole in the future.
Sneha Verghese
Sneha Verghese

Principal Consultant

Talk to Analyst

Find your sweet spots for generating winning opportunities in this market.

What is the Outlook for the Paint Ingredient Market in North America?

According to the forecast, North America will continue to have a high demand for paint ingredients. Globally, this region is expected to hold 22% of the market share in 2022. The region's dominance in the market is likely to be enhanced by the presence of key players and the increased demand for automobiles in this region.

The growing middle-class population, low labor costs, and low operating costs have made North America an attractive location for companies to set up manufacturing facilities. Therefore, there has been an increase in the number of industrial facilities in the region, resulting in an increase in construction activities, which is expected to increase the demand for paint mixers in the future. Further, e-commerce's rapid growth in the region provides producers with lucrative opportunities to gain market share, thereby driving demand for their products.

Why is Europe a Promising Market for Paint Ingredients?

Globally, Europe is expected to hold the largest market for paint ingredients. The market for paint mixers is expected to grow significantly in the coming years in Europe, and the demand is predicted to increase by a large margin in the future. According to estimates, the market will hold a market share of 24% by the end of 2022.

The construction industry is expected to grow in several countries, including the United Kingdom, the Netherlands, Hungary, Sweden, Germany, Poland, and Ireland over the forecast period due to expanding construction industry. As a result of EU funding and various support measures taken by governmental organizations in the region, it is expected that the construction sector will grow in the region, increasing the demand for the product.

Get the data you need at a Fraction of the cost

Personalize your report by choosing insights you need
and save 40%!

Category-wise Insights

Are Paint Manufacturers Stimulating the Market for Paint Ingredients?

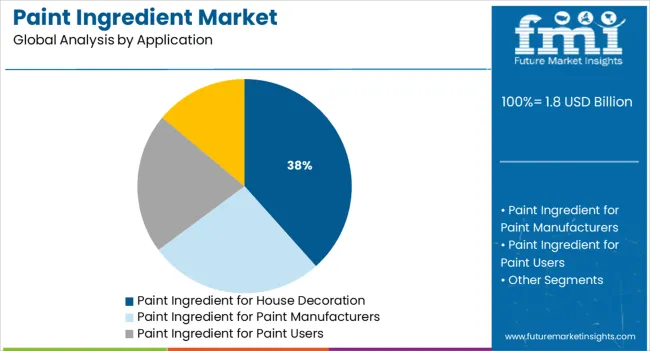
Based on application the market is segmented into house decoration, paint manufacturers, paint users, and others. According to analysts, paint manufacturers in the market are projecting the highest growth for paint ingredients in the market. Market growth for paint ingredients has been attributed to a growing demand for painting and dyeing operations on a commercial scale, lowering the price of paint ingredients in the market.

As a result of the compact design and the ability to provide rapid and effective mixing, these mixers are ideal for pharmaceutical and confectionery edible industries. With this machine, the paint manufacturer produces ink of excellent consistency, ideal for printing tablets and capsules in the market.

What Role Do Start-ups Play in the Paint Ingredient Business?

Start-ups are bringing paint ingredient products to the forefront due to a growing demand for eco-friendly products in the market. Furthermore, these consumer products start-up companies are engaged in a wide range of production, distribution, and marketing activities in addition to supplying non-synthetic paint and coatings in the market. Paint ingredients are employed in a wide variety of metal and wood coatings, so the most eco-friendly and sustainable paint ingredients are utilized in the automotive and construction industries.

  • MadeByPaint was founded in 2014 in Brisbane, Australia. The company offers paints for furniture and home decor that are eco-friendly and can be purchased from them. Handcrafted non-toxic water-based paints are made from safe, sustainable recycled ingredients such as clay, chalk, and natural pigments.
  • COAT was founded in 2020 in London, United Kingdom. Paints and painting supplies are offered by this internet-first brand. As part of the offering, there are sustainable peel-and-stick swatches, curated color collections of paints, and a variety of painting supplies such as bamboo rollers, decorative tapes, sugarcane trays, and more.

Competition Analysis

Key players in the global paint ingredient market include HYDE, Shur-Line, Premier Paint Roller, Goldblatt, WESTWARD, RADIA, Badger Air-Brush Co., DAYTON, Marshalltown, RUST-OLEUM, PREMIER, TBC Mixer, Mixing Mate, AllwayTools, Red Devil, Marshalltown, Sherwin-Williams, DYNAMIX AGITATORS, Allways Tools, COAT, MadeByPaint, and Bosch.

  • B & Q taps Hullabalook tech for an online paint mixing experience. In addition to 2000+ shades, Hullabalook allows consumers to order online, mix on demand, and offer the product to consumers ready for purchase. B&Q now offers a huge range of Valspar mixed-to-order paints online for the first time.

Report Scope

Report Attribute Details
Growth Rate CAGR of 3.2% from 2022 to 2032
Market Value in 2022 US$ 1,630 Million
Market Value in 2032 US$ 2,230 Million
Base Year for Estimation 2021
Historical Data 2016 to 2021
Forecast Period 2022 to 2032
Quantitative Units Revenue in US$ Million and CAGR from 2022 to 2032
Report Coverage Revenue Forecast, Company Ranking, Competitive Landscape, Growth Factors, Trends, and Pricing Analysis
Segments Covered
  • Product Type
  • Application
  • Material
  • Sales Channel
  • Region
Regions Covered
  • North America
  • Latin America
  • Europe
  • Asia Pacific
  • Middle East and Africa
Key Countries Profiled
  • USA
  • Canada
  • Brazil
  • Mexico
  • Germany
  • United Kingdom
  • France
  • Spain
  • Italy
  • China
  • Japan
  • South Korea
  • Thailand
  • Singapore
  • Indonesia
  • Australia
  • New Zealand
  • GCC Countries
  • South Africa
  • Israel
Key Companies Profiled
  • HYDE
  • Shur-Line
  • Premier Paint Roller
  • Goldblatt
  • WESTWARD
  • RADIA
  • Badger Air-Brush Co.
  • DAYTON
  • Marshalltown
  • RUST-OLEUM
  • PREMIER
  • TBC Mixer
  • Mixing Mate
  • AllwayTools
  • Red Devil
  • Sherwin-Williams
  • DYNAMIX AGITATORS
  • Bosch
Customization Available Upon Request

Key Segments Profiled in the Global Paint Ingredient Market

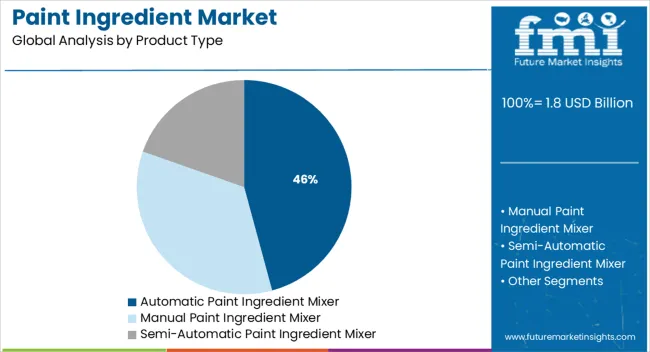
Paint Ingredient Market by Product Type:

  • Automatic Paint Ingredient Mixer
  • Manual Paint Ingredient Mixer
  • Semi-Automatic Paint Ingredient Mixer

Paint Ingredient Market by Application:

  • Paint Ingredient for House Decoration
  • Paint Ingredient for Paint Manufacturers
  • Paint Ingredient for Paint Users
  • Paint Ingredient for Other Applications

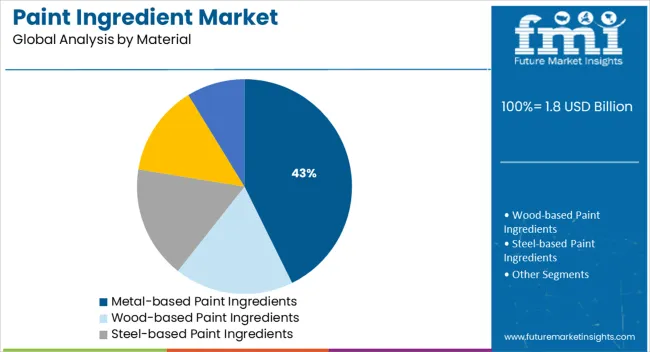
Paint Ingredient Market by Material:

  • Wood-based Paint Ingredients
  • Metal-based Paint Ingredients
  • Steel-based Paint Ingredients
  • Plastic-based Paint Ingredients
  • Other Materials-based -based Paint Ingredients

Paint Ingredient Market by Sales Channel:

  • Paint Ingredient Sales via Hypermarkets/Supermarkets
  • Paint Ingredient Sales via Departmental Stores
  • Paint Ingredient Sales via Convenience Stores
  • Paint Ingredient Sales via Specialty Stores
  • Direct Paint Ingredient Sales
  • Paint Ingredient Sales via Online Retailing
  • Paint Ingredient Sales via Other Sales Channels

Paint Ingredient Market by Region:

  • North America Paint Ingredient Market
  • Latin America Paint Ingredient Market
  • Europe Paint Ingredient Market
  • Asia Pacific Paint Ingredient Market
  • Middle East & Africa Paint Ingredient Market

Frequently Asked Questions

What is the anticipated growth of the Paint Ingredient market until 2032?

FMI projects the global paint ingredient market to expand at a 3.2% value CAGR by 2032

Which region is forecast to be the most lucrative for paint ingredient market growth?

Europe is expected to be the most opportunistic paint Ingredient market, accumulating 24% revenue in 2022

Which are some prominent paint ingredient manufacturers?

HYDE, Shur-Line, Premier Paint Roller, Goldblatt, WESTWARD, RADIA, Badger Air-Brush Co., and DAYTON are some of the prominent players in the market.

Table of Content

1. Executive Summary | Paint Ingredient Market

    1.1. Global Market Outlook

    1.2. Demand-side Trends

    1.3. Supply-side Trends

    1.4. Technology Roadmap Analysis

    1.5. Analysis and Recommendations

2. Market Overview

    2.1. Market Coverage / Taxonomy

    2.2. Market Definition / Scope / Limitations

3. Market Background

    3.1. Market Dynamics

        3.1.1. Drivers

        3.1.2. Restraints

        3.1.3. Opportunity

        3.1.4. Trends

    3.2. Scenario Forecast

        3.2.1. Demand in Optimistic Scenario

        3.2.2. Demand in Likely Scenario

        3.2.3. Demand in Conservative Scenario

    3.3. Opportunity Map Analysis

    3.4. Product Life Cycle Analysis

    3.5. Supply Chain Analysis

        3.5.1. Supply Side Participants and their Roles

            3.5.1.1. Producers

            3.5.1.2. Mid-Level Participants (Traders/ Agents/ Brokers)

            3.5.1.3. Wholesalers and Distributors

        3.5.2. Value Added and Value Created at Node in the Supply Chain

        3.5.3. List of Raw Material Suppliers

        3.5.4. List of Existing and Potential Buyers

    3.6. Investment Feasibility Matrix

    3.7. Value Chain Analysis

        3.7.1. Profit Margin Analysis

        3.7.2. Wholesalers and Distributors

        3.7.3. Retailers

    3.8. PESTLE and Porter’s Analysis

    3.9. Regulatory Landscape

        3.9.1. By Key Regions

        3.9.2. By Key Countries

    3.10. Regional Parent Market Outlook

    3.11. Production and Consumption Statistics

    3.12. Import and Export Statistics

4. Global Market Analysis 2016 to 2021 and Forecast, 2022 to 2032

    4.1. Historical Market Size Value (US$ Million) & Volume (Units) Analysis, 2016 to 2021

    4.2. Current and Future Market Size Value (US$ Million) & Volume (Units) Projections, 2022 to 2032

        4.2.1. Y-o-Y Growth Trend Analysis

        4.2.2. Absolute $ Opportunity Analysis

5. Global Market Analysis 2016 to 2021 and Forecast 2022 to 2032, By Product Type

    5.1. Introduction / Key Findings

    5.2. Historical Market Size Value (US$ Million) & Volume (Units) Analysis By Product Type, 2016 to 2021

    5.3. Current and Future Market Size Value (US$ Million) & Volume (Units) Analysis and Forecast By Product Type, 2022 to 2032

        5.3.1. Automatic Paint Mixer

        5.3.2. Manual Paint Mixer

        5.3.3. Semi-Automatic Paint Mixer

    5.4. Y-o-Y Growth Trend Analysis By Product Type, 2016 to 2021

    5.5. Absolute $ Opportunity Analysis By Product Type, 2022 to 2032

6. Global Market Analysis 2016 to 2021 and Forecast 2022 to 2032, By Application

    6.1. Introduction / Key Findings

    6.2. Historical Market Size Value (US$ Million) & Volume (Units) Analysis By Application, 2016 to 2021

    6.3. Current and Future Market Size Value (US$ Million) & Volume (Units) Analysis and Forecast By Application, 2022 to 2032

        6.3.1. House Decoration

        6.3.2. Paint Manufacturer

        6.3.3. Paint Users

        6.3.4. Others

    6.4. Y-o-Y Growth Trend Analysis By Application, 2016 to 2021

    6.5. Absolute $ Opportunity Analysis By Application, 2022 to 2032

7. Global Market Analysis 2016 to 2021 and Forecast 2022 to 2032, By Material

    7.1. Introduction / Key Findings

    7.2. Historical Market Size Value (US$ Million) & Volume (Units) Analysis By Material, 2016 to 2021

    7.3. Current and Future Market Size Value (US$ Million) & Volume (Units) Analysis and Forecast By Material, 2022 to 2032

        7.3.1. Wood

        7.3.2. Metal

        7.3.3. Steel

        7.3.4. Plastic

        7.3.5. Others

    7.4. Y-o-Y Growth Trend Analysis By Material, 2016 to 2021

    7.5. Absolute $ Opportunity Analysis By Material, 2022 to 2032

8. Global Market Analysis 2016 to 2021 and Forecast 2022 to 2032, By Sales Channel

    8.1. Introduction / Key Findings

    8.2. Historical Market Size Value (US$ Million) & Volume (Units) Analysis By Sales Channel, 2016 to 2021

    8.3. Current and Future Market Size Value (US$ Million) & Volume (Units) Analysis and Forecast By Sales Channel, 2022 to 2032

        8.3.1. Hypermarket/Supermarket

        8.3.2. Departmental Stores

        8.3.3. Convenience Stores

        8.3.4. Specialty Stores

        8.3.5. Direct Sales

        8.3.6. Online Retailing

        8.3.7. Others

    8.4. Y-o-Y Growth Trend Analysis By Sales Channel, 2016 to 2021

    8.5. Absolute $ Opportunity Analysis By Sales Channel, 2022 to 2032

9. Global Market Analysis 2016 to 2021 and Forecast 2022 to 2032, By Region

    9.1. Introduction

    9.2. Historical Market Size Value (US$ Million) & Volume (Units) Analysis By Region, 2016 to 2021

    9.3. Current Market Size Value (US$ Million) & Volume (Units) Analysis and Forecast By Region, 2022 to 2032

        9.3.1. North America

        9.3.2. Latin America

        9.3.3. Europe

        9.3.4. Asia Pacific

        9.3.5. Middle East and Africa(MEA)

    9.4. Market Attractiveness Analysis By Region

10. North America Market Analysis 2016 to 2021 and Forecast 2022 to 2032, By Country

    10.1. Historical Market Size Value (US$ Million) & Volume (Units) Trend Analysis By Market Taxonomy, 2016 to 2021

    10.2. Market Size Value (US$ Million) & Volume (Units) Forecast By Market Taxonomy, 2022 to 2032

        10.2.1. By Country

            10.2.1.1. USA

            10.2.1.2. Canada

        10.2.2. By Product Type

        10.2.3. By Application

        10.2.4. By Material

        10.2.5. By Sales Channel

    10.3. Market Attractiveness Analysis

        10.3.1. By Country

        10.3.2. By Product Type

        10.3.3. By Application

        10.3.4. By Material

        10.3.5. By Sales Channel

    10.4. Key Takeaways

11. Latin America Market Analysis 2016 to 2021 and Forecast 2022 to 2032, By Country

    11.1. Historical Market Size Value (US$ Million) & Volume (Units) Trend Analysis By Market Taxonomy, 2016 to 2021

    11.2. Market Size Value (US$ Million) & Volume (Units) Forecast By Market Taxonomy, 2022 to 2032

        11.2.1. By Country

            11.2.1.1. Brazil

            11.2.1.2. Mexico

            11.2.1.3. Rest of Latin America

        11.2.2. By Product Type

        11.2.3. By Application

        11.2.4. By Material

        11.2.5. By Sales Channel

    11.3. Market Attractiveness Analysis

        11.3.1. By Country

        11.3.2. By Product Type

        11.3.3. By Application

        11.3.4. By Material

        11.3.5. By Sales Channel

    11.4. Key Takeaways

12. Europe Market Analysis 2016 to 2021 and Forecast 2022 to 2032, By Country

    12.1. Historical Market Size Value (US$ Million) & Volume (Units) Trend Analysis By Market Taxonomy, 2016 to 2021

    12.2. Market Size Value (US$ Million) & Volume (Units) Forecast By Market Taxonomy, 2022 to 2032

        12.2.1. By Country

            12.2.1.1. Germany

            12.2.1.2. United Kingdom

            12.2.1.3. France

            12.2.1.4. Spain

            12.2.1.5. Italy

            12.2.1.6. Rest of Europe

        12.2.2. By Product Type

        12.2.3. By Application

        12.2.4. By Material

        12.2.5. By Sales Channel

    12.3. Market Attractiveness Analysis

        12.3.1. By Country

        12.3.2. By Product Type

        12.3.3. By Application

        12.3.4. By Material

        12.3.5. By Sales Channel

    12.4. Key Takeaways

13. Asia Pacific Market Analysis 2016 to 2021 and Forecast 2022 to 2032, By Country

    13.1. Historical Market Size Value (US$ Million) & Volume (Units) Trend Analysis By Market Taxonomy, 2016 to 2021

    13.2. Market Size Value (US$ Million) & Volume (Units) Forecast By Market Taxonomy, 2022 to 2032

        13.2.1. By Country

            13.2.1.1. China

            13.2.1.2. Japan

            13.2.1.3. South Korea

            13.2.1.4. Singapore

            13.2.1.5. Thailand

            13.2.1.6. Indonesia

            13.2.1.7. Australia

            13.2.1.8. New Zealand

            13.2.1.9. Rest of Asia Pacific

        13.2.2. By Product Type

        13.2.3. By Application

        13.2.4. By Material

        13.2.5. By Sales Channel

    13.3. Market Attractiveness Analysis

        13.3.1. By Country

        13.3.2. By Product Type

        13.3.3. By Application

        13.3.4. By Material

        13.3.5. By Sales Channel

    13.4. Key Takeaways

14. MEA Market Analysis 2016 to 2021 and Forecast 2022 to 2032, By Country

    14.1. Historical Market Size Value (US$ Million) & Volume (Units) Trend Analysis By Market Taxonomy, 2016 to 2021

    14.2. Market Size Value (US$ Million) & Volume (Units) Forecast By Market Taxonomy, 2022 to 2032

        14.2.1. By Country

            14.2.1.1. GCC Countries

            14.2.1.2. South Africa

            14.2.1.3. Israel

            14.2.1.4. Rest of Middle East and Africa(MEA)

        14.2.2. By Product Type

        14.2.3. By Application

        14.2.4. By Material

        14.2.5. By Sales Channel

    14.3. Market Attractiveness Analysis

        14.3.1. By Country

        14.3.2. By Product Type

        14.3.3. By Application

        14.3.4. By Material

        14.3.5. By Sales Channel

    14.4. Key Takeaways

15. Key Countries Market Analysis

    15.1. USA

        15.1.1. Pricing Analysis

        15.1.2. Market Share Analysis, 2021

            15.1.2.1. By Product Type

            15.1.2.2. By Application

            15.1.2.3. By Material

            15.1.2.4. By Sales Channel

    15.2. Canada

        15.2.1. Pricing Analysis

        15.2.2. Market Share Analysis, 2021

            15.2.2.1. By Product Type

            15.2.2.2. By Application

            15.2.2.3. By Material

            15.2.2.4. By Sales Channel

    15.3. Brazil

        15.3.1. Pricing Analysis

        15.3.2. Market Share Analysis, 2021

            15.3.2.1. By Product Type

            15.3.2.2. By Application

            15.3.2.3. By Material

            15.3.2.4. By Sales Channel

    15.4. Mexico

        15.4.1. Pricing Analysis

        15.4.2. Market Share Analysis, 2021

            15.4.2.1. By Product Type

            15.4.2.2. By Application

            15.4.2.3. By Material

            15.4.2.4. By Sales Channel

    15.5. Germany

        15.5.1. Pricing Analysis

        15.5.2. Market Share Analysis, 2021

            15.5.2.1. By Product Type

            15.5.2.2. By Application

            15.5.2.3. By Material

            15.5.2.4. By Sales Channel

    15.6. United Kingdom

        15.6.1. Pricing Analysis

        15.6.2. Market Share Analysis, 2021

            15.6.2.1. By Product Type

            15.6.2.2. By Application

            15.6.2.3. By Material

            15.6.2.4. By Sales Channel

    15.7. France

        15.7.1. Pricing Analysis

        15.7.2. Market Share Analysis, 2021

            15.7.2.1. By Product Type

            15.7.2.2. By Application

            15.7.2.3. By Material

            15.7.2.4. By Sales Channel

    15.8. Spain

        15.8.1. Pricing Analysis

        15.8.2. Market Share Analysis, 2021

            15.8.2.1. By Product Type

            15.8.2.2. By Application

            15.8.2.3. By Material

            15.8.2.4. By Sales Channel

    15.9. Italy

        15.9.1. Pricing Analysis

        15.9.2. Market Share Analysis, 2021

            15.9.2.1. By Product Type

            15.9.2.2. By Application

            15.9.2.3. By Material

            15.9.2.4. By Sales Channel

    15.10. China

        15.10.1. Pricing Analysis

        15.10.2. Market Share Analysis, 2021

            15.10.2.1. By Product Type

            15.10.2.2. By Application

            15.10.2.3. By Material

            15.10.2.4. By Sales Channel

    15.11. Japan

        15.11.1. Pricing Analysis

        15.11.2. Market Share Analysis, 2021

            15.11.2.1. By Product Type

            15.11.2.2. By Application

            15.11.2.3. By Material

            15.11.2.4. By Sales Channel

    15.12. South Korea

        15.12.1. Pricing Analysis

        15.12.2. Market Share Analysis, 2021

            15.12.2.1. By Product Type

            15.12.2.2. By Application

            15.12.2.3. By Material

            15.12.2.4. By Sales Channel

    15.13. Singapore

        15.13.1. Pricing Analysis

        15.13.2. Market Share Analysis, 2021

            15.13.2.1. By Product Type

            15.13.2.2. By Application

            15.13.2.3. By Material

            15.13.2.4. By Sales Channel

    15.14. Thailand

        15.14.1. Pricing Analysis

        15.14.2. Market Share Analysis, 2021

            15.14.2.1. By Product Type

            15.14.2.2. By Application

            15.14.2.3. By Material

            15.14.2.4. By Sales Channel

    15.15. Indonesia

        15.15.1. Pricing Analysis

        15.15.2. Market Share Analysis, 2021

            15.15.2.1. By Product Type

            15.15.2.2. By Application

            15.15.2.3. By Material

            15.15.2.4. By Sales Channel

    15.16. Australia

        15.16.1. Pricing Analysis

        15.16.2. Market Share Analysis, 2021

            15.16.2.1. By Product Type

            15.16.2.2. By Application

            15.16.2.3. By Material

            15.16.2.4. By Sales Channel

    15.17. New Zealand

        15.17.1. Pricing Analysis

        15.17.2. Market Share Analysis, 2021

            15.17.2.1. By Product Type

            15.17.2.2. By Application

            15.17.2.3. By Material

            15.17.2.4. By Sales Channel

    15.18. GCC Countries

        15.18.1. Pricing Analysis

        15.18.2. Market Share Analysis, 2021

            15.18.2.1. By Product Type

            15.18.2.2. By Application

            15.18.2.3. By Material

            15.18.2.4. By Sales Channel

    15.19. South Africa

        15.19.1. Pricing Analysis

        15.19.2. Market Share Analysis, 2021

            15.19.2.1. By Product Type

            15.19.2.2. By Application

            15.19.2.3. By Material

            15.19.2.4. By Sales Channel

    15.20. Israel

        15.20.1. Pricing Analysis

        15.20.2. Market Share Analysis, 2021

            15.20.2.1. By Product Type

            15.20.2.2. By Application

            15.20.2.3. By Material

            15.20.2.4. By Sales Channel

16. Market Structure Analysis

    16.1. Competition Dashboard

    16.2. Competition Benchmarking

    16.3. Market Share Analysis of Top Players

        16.3.1. By Regional

        16.3.2. By Product Type

        16.3.3. By Application

        16.3.4. By Material

        16.3.5. By Sales Channel

17. Competition Analysis

    17.1. Competition Deep Dive

        17.1.1. HYDE

            17.1.1.1. Overview

            17.1.1.2. Product Portfolio

            17.1.1.3. Profitability by Market Segments

            17.1.1.4. Sales Footprint

            17.1.1.5. Strategy Overview

                17.1.1.5.1. Marketing Strategy

                17.1.1.5.2. Product Strategy

                17.1.1.5.3. Channel Strategy

        17.1.2. Shur-Line

            17.1.2.1. Overview

            17.1.2.2. Product Portfolio

            17.1.2.3. Profitability by Market Segments

            17.1.2.4. Sales Footprint

            17.1.2.5. Strategy Overview

                17.1.2.5.1. Marketing Strategy

                17.1.2.5.2. Product Strategy

                17.1.2.5.3. Channel Strategy

        17.1.3. Premier Paint Roller

            17.1.3.1. Overview

            17.1.3.2. Product Portfolio

            17.1.3.3. Profitability by Market Segments

            17.1.3.4. Sales Footprint

            17.1.3.5. Strategy Overview

                17.1.3.5.1. Marketing Strategy

                17.1.3.5.2. Product Strategy

                17.1.3.5.3. Channel Strategy

        17.1.4. Goldblatt

            17.1.4.1. Overview

            17.1.4.2. Product Portfolio

            17.1.4.3. Profitability by Market Segments

            17.1.4.4. Sales Footprint

            17.1.4.5. Strategy Overview

                17.1.4.5.1. Marketing Strategy

                17.1.4.5.2. Product Strategy

                17.1.4.5.3. Channel Strategy

        17.1.5. WESTWARD

            17.1.5.1. Overview

            17.1.5.2. Product Portfolio

            17.1.5.3. Profitability by Market Segments

            17.1.5.4. Sales Footprint

            17.1.5.5. Strategy Overview

                17.1.5.5.1. Marketing Strategy

                17.1.5.5.2. Product Strategy

                17.1.5.5.3. Channel Strategy

        17.1.6. RADIA

            17.1.6.1. Overview

            17.1.6.2. Product Portfolio

            17.1.6.3. Profitability by Market Segments

            17.1.6.4. Sales Footprint

            17.1.6.5. Strategy Overview

                17.1.6.5.1. Marketing Strategy

                17.1.6.5.2. Product Strategy

                17.1.6.5.3. Channel Strategy

        17.1.7. Badger Air-Brush Co.

            17.1.7.1. Overview

            17.1.7.2. Product Portfolio

            17.1.7.3. Profitability by Market Segments

            17.1.7.4. Sales Footprint

            17.1.7.5. Strategy Overview

                17.1.7.5.1. Marketing Strategy

                17.1.7.5.2. Product Strategy

                17.1.7.5.3. Channel Strategy

        17.1.8. DAYTON

            17.1.8.1. Overview

            17.1.8.2. Product Portfolio

            17.1.8.3. Profitability by Market Segments

            17.1.8.4. Sales Footprint

            17.1.8.5. Strategy Overview

                17.1.8.5.1. Marketing Strategy

                17.1.8.5.2. Product Strategy

                17.1.8.5.3. Channel Strategy

        17.1.9. Marshalltown

            17.1.9.1. Overview

            17.1.9.2. Product Portfolio

            17.1.9.3. Profitability by Market Segments

            17.1.9.4. Sales Footprint

            17.1.9.5. Strategy Overview

                17.1.9.5.1. Marketing Strategy

                17.1.9.5.2. Product Strategy

                17.1.9.5.3. Channel Strategy

        17.1.10. RUST-OLEUM

            17.1.10.1. Overview

            17.1.10.2. Product Portfolio

            17.1.10.3. Profitability by Market Segments

            17.1.10.4. Sales Footprint

            17.1.10.5. Strategy Overview

                17.1.10.5.1. Marketing Strategy

                17.1.10.5.2. Product Strategy

                17.1.10.5.3. Channel Strategy

        17.1.11. PREMIER

            17.1.11.1. Overview

            17.1.11.2. Product Portfolio

            17.1.11.3. Profitability by Market Segments

            17.1.11.4. Sales Footprint

            17.1.11.5. Strategy Overview

                17.1.11.5.1. Marketing Strategy

                17.1.11.5.2. Product Strategy

                17.1.11.5.3. Channel Strategy

        17.1.12. TBC Mixer

            17.1.12.1. Overview

            17.1.12.2. Product Portfolio

            17.1.12.3. Profitability by Market Segments

            17.1.12.4. Sales Footprint

            17.1.12.5. Strategy Overview

                17.1.12.5.1. Marketing Strategy

                17.1.12.5.2. Product Strategy

                17.1.12.5.3. Channel Strategy

        17.1.13. Mixing Mate

            17.1.13.1. Overview

            17.1.13.2. Product Portfolio

            17.1.13.3. Profitability by Market Segments

            17.1.13.4. Sales Footprint

            17.1.13.5. Strategy Overview

                17.1.13.5.1. Marketing Strategy

                17.1.13.5.2. Product Strategy

                17.1.13.5.3. Channel Strategy

        17.1.14. AllwayTools

            17.1.14.1. Overview

            17.1.14.2. Product Portfolio

            17.1.14.3. Profitability by Market Segments

            17.1.14.4. Sales Footprint

            17.1.14.5. Strategy Overview

                17.1.14.5.1. Marketing Strategy

                17.1.14.5.2. Product Strategy

                17.1.14.5.3. Channel Strategy

        17.1.15. Red Devil

            17.1.15.1. Overview

            17.1.15.2. Product Portfolio

            17.1.15.3. Profitability by Market Segments

            17.1.15.4. Sales Footprint

            17.1.15.5. Strategy Overview

                17.1.15.5.1. Marketing Strategy

                17.1.15.5.2. Product Strategy

                17.1.15.5.3. Channel Strategy

        17.1.16. Marshalltown

            17.1.16.1. Overview

            17.1.16.2. Product Portfolio

            17.1.16.3. Profitability by Market Segments

            17.1.16.4. Sales Footprint

            17.1.16.5. Strategy Overview

                17.1.16.5.1. Marketing Strategy

                17.1.16.5.2. Product Strategy

                17.1.16.5.3. Channel Strategy

        17.1.17. Sherwin-William

            17.1.17.1. Overview

            17.1.17.2. Product Portfolio

            17.1.17.3. Profitability by Market Segments

            17.1.17.4. Sales Footprint

            17.1.17.5. Strategy Overview

                17.1.17.5.1. Marketing Strategy

                17.1.17.5.2. Product Strategy

                17.1.17.5.3. Channel Strategy

        17.1.18. DYNAMIX AGITATORS

            17.1.18.1. Overview

            17.1.18.2. Product Portfolio

            17.1.18.3. Profitability by Market Segments

            17.1.18.4. Sales Footprint

            17.1.18.5. Strategy Overview

                17.1.18.5.1. Marketing Strategy

                17.1.18.5.2. Product Strategy

                17.1.18.5.3. Channel Strategy

        17.1.19. Always Tools

            17.1.19.1. Overview

            17.1.19.2. Product Portfolio

            17.1.19.3. Profitability by Market Segments

            17.1.19.4. Sales Footprint

            17.1.19.5. Strategy Overview

                17.1.19.5.1. Marketing Strategy

                17.1.19.5.2. Product Strategy

                17.1.19.5.3. Channel Strategy

        17.1.20. Bosch

            17.1.20.1. Overview

            17.1.20.2. Product Portfolio

            17.1.20.3. Profitability by Market Segments

            17.1.20.4. Sales Footprint

            17.1.20.5. Strategy Overview

                17.1.20.5.1. Marketing Strategy

                17.1.20.5.2. Product Strategy

                17.1.20.5.3. Channel Strategy

18. Assumptions & Acronyms Used

19. Research Methodology

Don't pay for what you don't need

Customize your report by selecting specific countries or regions and save 30%!

List of Tables

Table 1: Global Market Value (US$ Million) Forecast by Region, 2016 to 2032

Table 2: Global Market Volume (Units) Forecast by Region, 2016 to 2032

Table 3: Global Market Value (US$ Million) Forecast by Product Type, 2016 to 2032

Table 4: Global Market Volume (Units) Forecast by Product Type, 2016 to 2032

Table 5: Global Market Value (US$ Million) Forecast by Application, 2016 to 2032

Table 6: Global Market Volume (Units) Forecast by Application, 2016 to 2032

Table 7: Global Market Value (US$ Million) Forecast by Material, 2016 to 2032

Table 8: Global Market Volume (Units) Forecast by Material, 2016 to 2032

Table 9: Global Market Value (US$ Million) Forecast by Sales Channel, 2016 to 2032

Table 10: Global Market Volume (Units) Forecast by Sales Channel, 2016 to 2032

Table 11: North America Market Value (US$ Million) Forecast by Country, 2016 to 2032

Table 12: North America Market Volume (Units) Forecast by Country, 2016 to 2032

Table 13: North America Market Value (US$ Million) Forecast by Product Type, 2016 to 2032

Table 14: North America Market Volume (Units) Forecast by Product Type, 2016 to 2032

Table 15: North America Market Value (US$ Million) Forecast by Application, 2016 to 2032

Table 16: North America Market Volume (Units) Forecast by Application, 2016 to 2032

Table 17: North America Market Value (US$ Million) Forecast by Material, 2016 to 2032

Table 18: North America Market Volume (Units) Forecast by Material, 2016 to 2032

Table 19: North America Market Value (US$ Million) Forecast by Sales Channel, 2016 to 2032

Table 20: North America Market Volume (Units) Forecast by Sales Channel, 2016 to 2032

Table 21: Latin America Market Value (US$ Million) Forecast by Country, 2016 to 2032

Table 22: Latin America Market Volume (Units) Forecast by Country, 2016 to 2032

Table 23: Latin America Market Value (US$ Million) Forecast by Product Type, 2016 to 2032

Table 24: Latin America Market Volume (Units) Forecast by Product Type, 2016 to 2032

Table 25: Latin America Market Value (US$ Million) Forecast by Application, 2016 to 2032

Table 26: Latin America Market Volume (Units) Forecast by Application, 2016 to 2032

Table 27: Latin America Market Value (US$ Million) Forecast by Material, 2016 to 2032

Table 28: Latin America Market Volume (Units) Forecast by Material, 2016 to 2032

Table 29: Latin America Market Value (US$ Million) Forecast by Sales Channel, 2016 to 2032

Table 30: Latin America Market Volume (Units) Forecast by Sales Channel, 2016 to 2032

Table 31: Europe Market Value (US$ Million) Forecast by Country, 2016 to 2032

Table 32: Europe Market Volume (Units) Forecast by Country, 2016 to 2032

Table 33: Europe Market Value (US$ Million) Forecast by Product Type, 2016 to 2032

Table 34: Europe Market Volume (Units) Forecast by Product Type, 2016 to 2032

Table 35: Europe Market Value (US$ Million) Forecast by Application, 2016 to 2032

Table 36: Europe Market Volume (Units) Forecast by Application, 2016 to 2032

Table 37: Europe Market Value (US$ Million) Forecast by Material, 2016 to 2032

Table 38: Europe Market Volume (Units) Forecast by Material, 2016 to 2032

Table 39: Europe Market Value (US$ Million) Forecast by Sales Channel, 2016 to 2032

Table 40: Europe Market Volume (Units) Forecast by Sales Channel, 2016 to 2032

Table 41: Asia Pacific Market Value (US$ Million) Forecast by Country, 2016 to 2032

Table 42: Asia Pacific Market Volume (Units) Forecast by Country, 2016 to 2032

Table 43: Asia Pacific Market Value (US$ Million) Forecast by Product Type, 2016 to 2032

Table 44: Asia Pacific Market Volume (Units) Forecast by Product Type, 2016 to 2032

Table 45: Asia Pacific Market Value (US$ Million) Forecast by Application, 2016 to 2032

Table 46: Asia Pacific Market Volume (Units) Forecast by Application, 2016 to 2032

Table 47: Asia Pacific Market Value (US$ Million) Forecast by Material, 2016 to 2032

Table 48: Asia Pacific Market Volume (Units) Forecast by Material, 2016 to 2032

Table 49: Asia Pacific Market Value (US$ Million) Forecast by Sales Channel, 2016 to 2032

Table 50: Asia Pacific Market Volume (Units) Forecast by Sales Channel, 2016 to 2032

Table 51: MEA Market Value (US$ Million) Forecast by Country, 2016 to 2032

Table 52: MEA Market Volume (Units) Forecast by Country, 2016 to 2032

Table 53: MEA Market Value (US$ Million) Forecast by Product Type, 2016 to 2032

Table 54: MEA Market Volume (Units) Forecast by Product Type, 2016 to 2032

Table 55: MEA Market Value (US$ Million) Forecast by Application, 2016 to 2032

Table 56: MEA Market Volume (Units) Forecast by Application, 2016 to 2032

Table 57: MEA Market Value (US$ Million) Forecast by Material, 2016 to 2032

Table 58: MEA Market Volume (Units) Forecast by Material, 2016 to 2032

Table 59: MEA Market Value (US$ Million) Forecast by Sales Channel, 2016 to 2032

Table 60: MEA Market Volume (Units) Forecast by Sales Channel, 2016 to 2032
Sneha Verghese
Sneha Verghese

Principal Consultant

Talk to Analyst

Find your sweet spots for generating winning opportunities in this market.

List of Charts

Figure 1: Global Market Value (US$ Million) by Product Type, 2022 to 2032

Figure 2: Global Market Value (US$ Million) by Application, 2022 to 2032

Figure 3: Global Market Value (US$ Million) by Material, 2022 to 2032

Figure 4: Global Market Value (US$ Million) by Sales Channel, 2022 to 2032

Figure 5: Global Market Value (US$ Million) by Region, 2022 to 2032

Figure 6: Global Market Value (US$ Million) Analysis by Region, 2016 to 2032

Figure 7: Global Market Volume (Units) Analysis by Region, 2016 to 2032

Figure 8: Global Market Value Share (%) and BPS Analysis by Region, 2022 to 2032

Figure 9: Global Market Y-o-Y Growth (%) Projections by Region, 2022 to 2032

Figure 10: Global Market Value (US$ Million) Analysis by Product Type, 2016 to 2032

Figure 11: Global Market Volume (Units) Analysis by Product Type, 2016 to 2032

Figure 12: Global Market Value Share (%) and BPS Analysis by Product Type, 2022 to 2032

Figure 13: Global Market Y-o-Y Growth (%) Projections by Product Type, 2022 to 2032

Figure 14: Global Market Value (US$ Million) Analysis by Application, 2016 to 2032

Figure 15: Global Market Volume (Units) Analysis by Application, 2016 to 2032

Figure 16: Global Market Value Share (%) and BPS Analysis by Application, 2022 to 2032

Figure 17: Global Market Y-o-Y Growth (%) Projections by Application, 2022 to 2032

Figure 18: Global Market Value (US$ Million) Analysis by Material, 2016 to 2032

Figure 19: Global Market Volume (Units) Analysis by Material, 2016 to 2032

Figure 20: Global Market Value Share (%) and BPS Analysis by Material, 2022 to 2032

Figure 21: Global Market Y-o-Y Growth (%) Projections by Material, 2022 to 2032

Figure 22: Global Market Value (US$ Million) Analysis by Sales Channel, 2016 to 2032

Figure 23: Global Market Volume (Units) Analysis by Sales Channel, 2016 to 2032

Figure 24: Global Market Value Share (%) and BPS Analysis by Sales Channel, 2022 to 2032

Figure 25: Global Market Y-o-Y Growth (%) Projections by Sales Channel, 2022 to 2032

Figure 26: Global Market Attractiveness by Product Type, 2022 to 2032

Figure 27: Global Market Attractiveness by Application, 2022 to 2032

Figure 28: Global Market Attractiveness by Material, 2022 to 2032

Figure 29: Global Market Attractiveness by Sales Channel, 2022 to 2032

Figure 30: Global Market Attractiveness by Region, 2022 to 2032

Figure 31: North America Market Value (US$ Million) by Product Type, 2022 to 2032

Figure 32: North America Market Value (US$ Million) by Application, 2022 to 2032

Figure 33: North America Market Value (US$ Million) by Material, 2022 to 2032

Figure 34: North America Market Value (US$ Million) by Sales Channel, 2022 to 2032

Figure 35: North America Market Value (US$ Million) by Country, 2022 to 2032

Figure 36: North America Market Value (US$ Million) Analysis by Country, 2016 to 2032

Figure 37: North America Market Volume (Units) Analysis by Country, 2016 to 2032

Figure 38: North America Market Value Share (%) and BPS Analysis by Country, 2022 to 2032

Figure 39: North America Market Y-o-Y Growth (%) Projections by Country, 2022 to 2032

Figure 40: North America Market Value (US$ Million) Analysis by Product Type, 2016 to 2032

Figure 41: North America Market Volume (Units) Analysis by Product Type, 2016 to 2032

Figure 42: North America Market Value Share (%) and BPS Analysis by Product Type, 2022 to 2032

Figure 43: North America Market Y-o-Y Growth (%) Projections by Product Type, 2022 to 2032

Figure 44: North America Market Value (US$ Million) Analysis by Application, 2016 to 2032

Figure 45: North America Market Volume (Units) Analysis by Application, 2016 to 2032

Figure 46: North America Market Value Share (%) and BPS Analysis by Application, 2022 to 2032

Figure 47: North America Market Y-o-Y Growth (%) Projections by Application, 2022 to 2032

Figure 48: North America Market Value (US$ Million) Analysis by Material, 2016 to 2032

Figure 49: North America Market Volume (Units) Analysis by Material, 2016 to 2032

Figure 50: North America Market Value Share (%) and BPS Analysis by Material, 2022 to 2032

Figure 51: North America Market Y-o-Y Growth (%) Projections by Material, 2022 to 2032

Figure 52: North America Market Value (US$ Million) Analysis by Sales Channel, 2016 to 2032

Figure 53: North America Market Volume (Units) Analysis by Sales Channel, 2016 to 2032

Figure 54: North America Market Value Share (%) and BPS Analysis by Sales Channel, 2022 to 2032

Figure 55: North America Market Y-o-Y Growth (%) Projections by Sales Channel, 2022 to 2032

Figure 56: North America Market Attractiveness by Product Type, 2022 to 2032

Figure 57: North America Market Attractiveness by Application, 2022 to 2032

Figure 58: North America Market Attractiveness by Material, 2022 to 2032

Figure 59: North America Market Attractiveness by Sales Channel, 2022 to 2032

Figure 60: North America Market Attractiveness by Country, 2022 to 2032

Figure 61: Latin America Market Value (US$ Million) by Product Type, 2022 to 2032

Figure 62: Latin America Market Value (US$ Million) by Application, 2022 to 2032

Figure 63: Latin America Market Value (US$ Million) by Material, 2022 to 2032

Figure 64: Latin America Market Value (US$ Million) by Sales Channel, 2022 to 2032

Figure 65: Latin America Market Value (US$ Million) by Country, 2022 to 2032

Figure 66: Latin America Market Value (US$ Million) Analysis by Country, 2016 to 2032

Figure 67: Latin America Market Volume (Units) Analysis by Country, 2016 to 2032

Figure 68: Latin America Market Value Share (%) and BPS Analysis by Country, 2022 to 2032

Figure 69: Latin America Market Y-o-Y Growth (%) Projections by Country, 2022 to 2032

Figure 70: Latin America Market Value (US$ Million) Analysis by Product Type, 2016 to 2032

Figure 71: Latin America Market Volume (Units) Analysis by Product Type, 2016 to 2032

Figure 72: Latin America Market Value Share (%) and BPS Analysis by Product Type, 2022 to 2032

Figure 73: Latin America Market Y-o-Y Growth (%) Projections by Product Type, 2022 to 2032

Figure 74: Latin America Market Value (US$ Million) Analysis by Application, 2016 to 2032

Figure 75: Latin America Market Volume (Units) Analysis by Application, 2016 to 2032

Figure 76: Latin America Market Value Share (%) and BPS Analysis by Application, 2022 to 2032

Figure 77: Latin America Market Y-o-Y Growth (%) Projections by Application, 2022 to 2032

Figure 78: Latin America Market Value (US$ Million) Analysis by Material, 2016 to 2032

Figure 79: Latin America Market Volume (Units) Analysis by Material, 2016 to 2032

Figure 80: Latin America Market Value Share (%) and BPS Analysis by Material, 2022 to 2032

Figure 81: Latin America Market Y-o-Y Growth (%) Projections by Material, 2022 to 2032

Figure 82: Latin America Market Value (US$ Million) Analysis by Sales Channel, 2016 to 2032

Figure 83: Latin America Market Volume (Units) Analysis by Sales Channel, 2016 to 2032

Figure 84: Latin America Market Value Share (%) and BPS Analysis by Sales Channel, 2022 to 2032

Figure 85: Latin America Market Y-o-Y Growth (%) Projections by Sales Channel, 2022 to 2032

Figure 86: Latin America Market Attractiveness by Product Type, 2022 to 2032

Figure 87: Latin America Market Attractiveness by Application, 2022 to 2032

Figure 88: Latin America Market Attractiveness by Material, 2022 to 2032

Figure 89: Latin America Market Attractiveness by Sales Channel, 2022 to 2032

Figure 90: Latin America Market Attractiveness by Country, 2022 to 2032

Figure 91: Europe Market Value (US$ Million) by Product Type, 2022 to 2032

Figure 92: Europe Market Value (US$ Million) by Application, 2022 to 2032

Figure 93: Europe Market Value (US$ Million) by Material, 2022 to 2032

Figure 94: Europe Market Value (US$ Million) by Sales Channel, 2022 to 2032

Figure 95: Europe Market Value (US$ Million) by Country, 2022 to 2032

Figure 96: Europe Market Value (US$ Million) Analysis by Country, 2016 to 2032

Figure 97: Europe Market Volume (Units) Analysis by Country, 2016 to 2032

Figure 98: Europe Market Value Share (%) and BPS Analysis by Country, 2022 to 2032

Figure 99: Europe Market Y-o-Y Growth (%) Projections by Country, 2022 to 2032

Figure 100: Europe Market Value (US$ Million) Analysis by Product Type, 2016 to 2032

Figure 101: Europe Market Volume (Units) Analysis by Product Type, 2016 to 2032

Figure 102: Europe Market Value Share (%) and BPS Analysis by Product Type, 2022 to 2032

Figure 103: Europe Market Y-o-Y Growth (%) Projections by Product Type, 2022 to 2032

Figure 104: Europe Market Value (US$ Million) Analysis by Application, 2016 to 2032

Figure 105: Europe Market Volume (Units) Analysis by Application, 2016 to 2032

Figure 106: Europe Market Value Share (%) and BPS Analysis by Application, 2022 to 2032

Figure 107: Europe Market Y-o-Y Growth (%) Projections by Application, 2022 to 2032

Figure 108: Europe Market Value (US$ Million) Analysis by Material, 2016 to 2032

Figure 109: Europe Market Volume (Units) Analysis by Material, 2016 to 2032

Figure 110: Europe Market Value Share (%) and BPS Analysis by Material, 2022 to 2032

Figure 111: Europe Market Y-o-Y Growth (%) Projections by Material, 2022 to 2032

Figure 112: Europe Market Value (US$ Million) Analysis by Sales Channel, 2016 to 2032

Figure 113: Europe Market Volume (Units) Analysis by Sales Channel, 2016 to 2032

Figure 114: Europe Market Value Share (%) and BPS Analysis by Sales Channel, 2022 to 2032

Figure 115: Europe Market Y-o-Y Growth (%) Projections by Sales Channel, 2022 to 2032

Figure 116: Europe Market Attractiveness by Product Type, 2022 to 2032

Figure 117: Europe Market Attractiveness by Application, 2022 to 2032

Figure 118: Europe Market Attractiveness by Material, 2022 to 2032

Figure 119: Europe Market Attractiveness by Sales Channel, 2022 to 2032

Figure 120: Europe Market Attractiveness by Country, 2022 to 2032

Figure 121: Asia Pacific Market Value (US$ Million) by Product Type, 2022 to 2032

Figure 122: Asia Pacific Market Value (US$ Million) by Application, 2022 to 2032

Figure 123: Asia Pacific Market Value (US$ Million) by Material, 2022 to 2032

Figure 124: Asia Pacific Market Value (US$ Million) by Sales Channel, 2022 to 2032

Figure 125: Asia Pacific Market Value (US$ Million) by Country, 2022 to 2032

Figure 126: Asia Pacific Market Value (US$ Million) Analysis by Country, 2016 to 2032

Figure 127: Asia Pacific Market Volume (Units) Analysis by Country, 2016 to 2032

Figure 128: Asia Pacific Market Value Share (%) and BPS Analysis by Country, 2022 to 2032

Figure 129: Asia Pacific Market Y-o-Y Growth (%) Projections by Country, 2022 to 2032

Figure 130: Asia Pacific Market Value (US$ Million) Analysis by Product Type, 2016 to 2032

Figure 131: Asia Pacific Market Volume (Units) Analysis by Product Type, 2016 to 2032

Figure 132: Asia Pacific Market Value Share (%) and BPS Analysis by Product Type, 2022 to 2032

Figure 133: Asia Pacific Market Y-o-Y Growth (%) Projections by Product Type, 2022 to 2032

Figure 134: Asia Pacific Market Value (US$ Million) Analysis by Application, 2016 to 2032

Figure 135: Asia Pacific Market Volume (Units) Analysis by Application, 2016 to 2032

Figure 136: Asia Pacific Market Value Share (%) and BPS Analysis by Application, 2022 to 2032

Figure 137: Asia Pacific Market Y-o-Y Growth (%) Projections by Application, 2022 to 2032

Figure 138: Asia Pacific Market Value (US$ Million) Analysis by Material, 2016 to 2032

Figure 139: Asia Pacific Market Volume (Units) Analysis by Material, 2016 to 2032

Figure 140: Asia Pacific Market Value Share (%) and BPS Analysis by Material, 2022 to 2032

Figure 141: Asia Pacific Market Y-o-Y Growth (%) Projections by Material, 2022 to 2032

Figure 142: Asia Pacific Market Value (US$ Million) Analysis by Sales Channel, 2016 to 2032

Figure 143: Asia Pacific Market Volume (Units) Analysis by Sales Channel, 2016 to 2032

Figure 144: Asia Pacific Market Value Share (%) and BPS Analysis by Sales Channel, 2022 to 2032

Figure 145: Asia Pacific Market Y-o-Y Growth (%) Projections by Sales Channel, 2022 to 2032

Figure 146: Asia Pacific Market Attractiveness by Product Type, 2022 to 2032

Figure 147: Asia Pacific Market Attractiveness by Application, 2022 to 2032

Figure 148: Asia Pacific Market Attractiveness by Material, 2022 to 2032

Figure 149: Asia Pacific Market Attractiveness by Sales Channel, 2022 to 2032

Figure 150: Asia Pacific Market Attractiveness by Country, 2022 to 2032

Figure 151: MEA Market Value (US$ Million) by Product Type, 2022 to 2032

Figure 152: MEA Market Value (US$ Million) by Application, 2022 to 2032

Figure 153: MEA Market Value (US$ Million) by Material, 2022 to 2032

Figure 154: MEA Market Value (US$ Million) by Sales Channel, 2022 to 2032

Figure 155: MEA Market Value (US$ Million) by Country, 2022 to 2032

Figure 156: MEA Market Value (US$ Million) Analysis by Country, 2016 to 2032

Figure 157: MEA Market Volume (Units) Analysis by Country, 2016 to 2032

Figure 158: MEA Market Value Share (%) and BPS Analysis by Country, 2022 to 2032

Figure 159: MEA Market Y-o-Y Growth (%) Projections by Country, 2022 to 2032

Figure 160: MEA Market Value (US$ Million) Analysis by Product Type, 2016 to 2032

Figure 161: MEA Market Volume (Units) Analysis by Product Type, 2016 to 2032

Figure 162: MEA Market Value Share (%) and BPS Analysis by Product Type, 2022 to 2032

Figure 163: MEA Market Y-o-Y Growth (%) Projections by Product Type, 2022 to 2032

Figure 164: MEA Market Value (US$ Million) Analysis by Application, 2016 to 2032

Figure 165: MEA Market Volume (Units) Analysis by Application, 2016 to 2032

Figure 166: MEA Market Value Share (%) and BPS Analysis by Application, 2022 to 2032

Figure 167: MEA Market Y-o-Y Growth (%) Projections by Application, 2022 to 2032

Figure 168: MEA Market Value (US$ Million) Analysis by Material, 2016 to 2032

Figure 169: MEA Market Volume (Units) Analysis by Material, 2016 to 2032

Figure 170: MEA Market Value Share (%) and BPS Analysis by Material, 2022 to 2032

Figure 171: MEA Market Y-o-Y Growth (%) Projections by Material, 2022 to 2032

Figure 172: MEA Market Value (US$ Million) Analysis by Sales Channel, 2016 to 2032

Figure 173: MEA Market Volume (Units) Analysis by Sales Channel, 2016 to 2032

Figure 174: MEA Market Value Share (%) and BPS Analysis by Sales Channel, 2022 to 2032

Figure 175: MEA Market Y-o-Y Growth (%) Projections by Sales Channel, 2022 to 2032

Figure 176: MEA Market Attractiveness by Product Type, 2022 to 2032

Figure 177: MEA Market Attractiveness by Application, 2022 to 2032

Figure 178: MEA Market Attractiveness by Material, 2022 to 2032

Figure 179: MEA Market Attractiveness by Sales Channel, 2022 to 2032

Figure 180: MEA Market Attractiveness by Country, 2022 to 2032

Recommendations

Industrial Automation

Painting Robots Market

Published : June 2023

Packaging

Paint Cans Market

Published : March 2023

Packaging

Paint Buckets Market

Published : February 2023

Chemicals & Materials

Paint Additives Market

Published : October 2022

Explore Consumer Product Insights

View Reports