Reports

- Global Locations -

Headquarters

Future Market Insights, Inc.

Christiana Corporate, 200
Continental Drive, Suite 401,
Newark, Delaware - 19713,
United States

T: +1-845-579-5705

Americas

Future Market Insights, Inc.

616 Corporate Way, Suite 2-9018,
Valley Cottage, NY 10989, United States

T: +1-347-918-3531

MEA

Future Market Insights

1602-6 Jumeirah Bay X2 Tower, Plot No: JLT-PH2-X2A,
Jumeirah Lakes Towers, Dubai,
United Arab Emirates

Europe

Future Market Insights

3rd Floor, 207 Regent Street,
W1B 3HH London
United Kingdom

T: + 44 (0) 20 8123 9659
D: +44 (0) 20 3287 4268

Asia Pacific

Future Market Insights

IndiaLand Global Tech Park, Unit UG-1, Behind Grand HighStreet, Phase 1, Hinjawadi, MH, Pune – 411057, India

Faux Paints And Coatings Market Outlook (2022-2032)

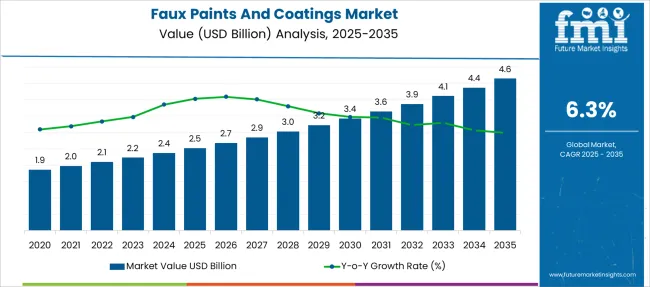
[250 Pages Report] Newly released Faux Paints and Coatings Market analysis report by Future Market Insights shows that global sales of Faux Paints and Coatings Market in 2021 was held at US$ 7.2 Billion. With 6.3%, the projected market growth during 2022 to 2032 is expected to be significantly higher than the historical growth. With 7% projected CAGR during 2022 to 2032, revenue through plasters is expected to grow at the highest pace.

Attributes Details
Faux Paints and Coatings Market CAGR (2022 to 2032) 6.3%
Faux Paints and Coatings Market Size (2022) US$ 2.1 Billion
Faux Paints and Coatings Market Size (2032) US$ 4.2 Billion

Don't pay for what you don't need

Customize your report by selecting specific countries or regions and save 30%!

Revenue Of Faux Paints And Coatings Market From 2017 To 2021 Compared To Demand Outlook For 2022 To 2032

Faux Paints and Coatings have gained popularity as the frequency of rehabilitation projects has increased, both for adding aesthetic value and for reinforcing existing infrastructures.

Faux finish coating producers have witnessed a surge in revenue in the recent years due to growth in demand for different interior décor applications such as walls, doors, panels, handrails, among others. Owing to this, demand for Faux Paints and Coatings is expected to rise at a CAGR of more than 6% from 2022 to 2032, taking the projected revenue to nearly US$ 14 Bn by 2032.

Why Is There A Surge In Demand For Faux Paints And Coatings In The Architecture Industry?

With the surge in construction industry, the demand for Faux Paints and Coatings is on surge. According to the International Trade Administration, the United States has had a trade surplus in Architecture, Engineering, and Construction (AEC) services since 2010, with a total value of US$ 7.5 Bn in 2019. The figures suggest that US AEC service exports reached $15.9 Bn, while imports totaled $8.3 Bn.

With more than US$ 625 Mn in exports, the market in Asia Pacific accounted for about 60% of U.S. architectural services, while Europe was the second biggest export market, accounting for 16% of U.S. exports, valued at more than US$ 170 Mn. This demonstrates the significant development potential for faux finish coating producers not just in the United States, but across the world.

Nikhil Kaitwade
Nikhil Kaitwade

Principal Consultant

Talk to Analyst

Find your sweet spots for generating winning opportunities in this market.

How Are Brisk Renovation And Refurbishment Projects Driving Up Demand?

Over the past decade, demand for Faux Paints and Coatings has been growing steadily in the industrial, commercial, and residential sectors. While demand for coatings that imitate the look of materials such as metal, marble, or stone continues, growth in consumer demand is forecast for future years, providing ample opportunities for industry leaders.

The rehabilitation of ageing residential spaces, as well as the rising desire to enhance the look of commercial spaces, are both having an influence on the sales of Faux Paints and Coatings.

Will The Construction Industry's Consistent Growth Fuel Sales Of Faux Paints And Coatings?

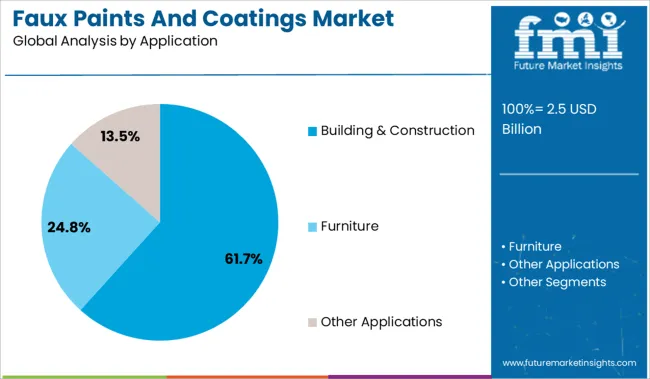
The increased number of building, construction, and restoration projects in the residential, industrial, commercial, and other sectors is pushing up worldwide demand for Faux Paints and Coatings.

According to Invest India, India's National Investment Promotion and Facilitation Agency, the country will have the third-largest construction industry by 2025. From 2015 to 2020, the Indian government spent around US$ 454.8 Bn on infrastructure building, according to the study.

According to studies conducted by the United Kingdom Government, the construction industry in the U.K. has been steadily growing and is on course to capture a piece of the estimated EUR 200 Bn per year global market for integrated city systems by 2030. These factors indicate to a rise in demand for Faux Paints and Coatings.

Get the data you need at a Fraction of the cost

Personalize your report by choosing insights you need
and save 40%!

Region-Wise Analysis

Which Region is projected to Offer the Largest Opportunity for Faux Paints and Coatings Market?

From 2022 to 2032, North America is expected to account for the lion's share of the global Faux Paints and Coatings market in terms of revenue. The need for Faux Paints and Coatings in the North American construction industry is rapidly increasing owing to growing consumer and commercial expenditure on construction.

Finishing using Faux Paints and Coatings is quick and easy. It also lowers labor costs and efforts while increasing aesthetics. These factors are boosting the Faux Paints and Coatings market in North America.
Country-Wise Analysis

What Growth Opportunities Exist in the US Market?

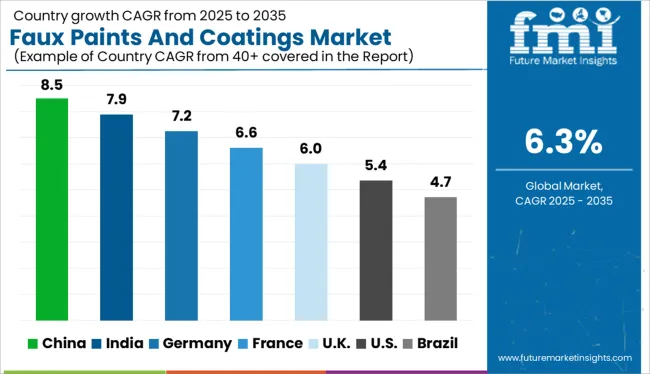
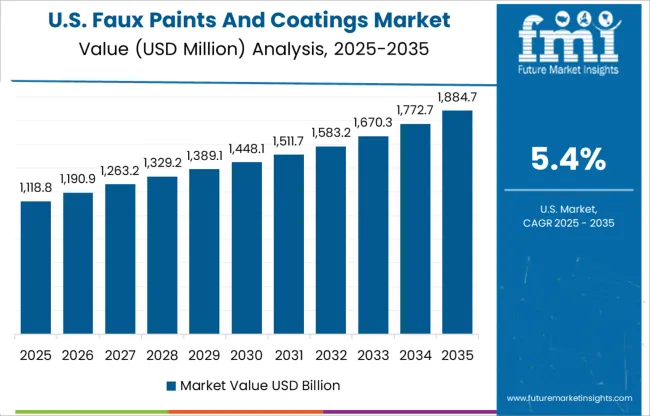
The United States is expected to lead the Faux Paints and Coatings market with a CAGR of more than 6% between 2022 and 2032. The country's sophisticated commercial and residential construction sector, as well as a surge in demand from the architectural sector, have been fuelling the country's increasing faux finish coating revenue.

Google announced in February 2019 that it would invest US$ 13 Bn in offices and data centres across the United States, in states other than its traditional home of California, including Nebraska, Nevada, Ohio, Texas, Oklahoma, South Carolina, and Virginia. Large projects such as these are likely to expand the market in the country.
Why Germany Stands a Profitable Market for Faux Paints and Coatings?

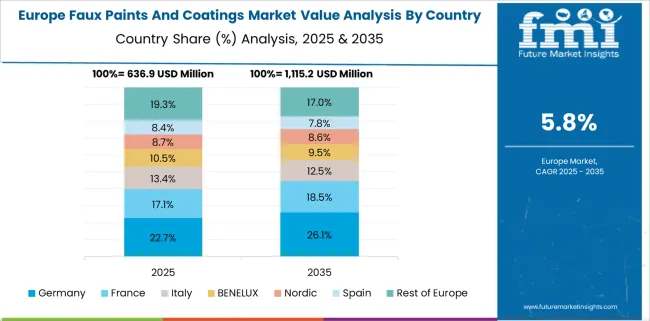
Germany is projected to be a lucrative market for Faux Paints and Coatings in the forthcoming years owing to the continued growth of the building and construction industry, as well as a rising preference for interior design and furnishings.

According to a report published by European Commission in June 2018, entitled "European Construction Sector Observatory", around 650,813 enterprises were operational in the broad construction sector in Germany in 2014. Majority of them were micro, small, and medium-sized enterprises. Between 2010 and 2016, construction production increased at an annual rate of 10.4 % per year in Germany.

This information demonstrates why imitation finish coating manufacturers are concentrating their efforts in Germany in order to grow their sales footprint. According to projections, the German market will have a revenue share of more than 45 %.

What Factors Contribute to India's Large Market for Faux Paints and Coatings?

The fast growth of the construction sector and availability of raw materials and personnel, are driving demand for Faux Paints and Coatings in India. The market in India is predicted to expand at a CAGR of more than 6.7%. According to Invest India, India's construction industry is rapidly increasing, and the real estate sector is predicted to attract $5 Bn in institutional investment by 2022.

According to the study, the construction sector in India contributed 9% of the country's GDP in 2018, with new investments in road infrastructure totaling US$ 16.6 Bn.

Will China Continue Exhibiting Supremacy in the Faux Paints and Coatings Market?

Due to a sophisticated construction industry and an expansion in the number of highly developed industrial centres, China has stayed in the limelight for manufacturers of Faux Paints and Coatings.

According to the National Bureau of Statistics (NBS), the construction industry in China is progressively growing at an average annual rate of 16.6%, with the number of construction businesses quickly expanding, reaching more than 300,000.

As a consequence, in recent years, China has gained the attention of suppliers of faux finish coating. As a consequence, China is expected to outperform a market value of US$ 2 Bn over the forecast year.

Category-Wise Insights

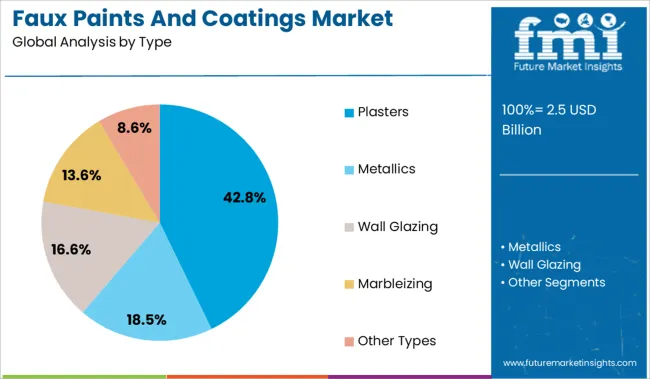
Why is Plasters Category Projected to Witness Fastest Growth among Faux Paints and Coatings Type?

Plasters segment is forecasted to grow at the highest CAGR of over 7% during 2022-2032. Wall glazing fake finish coatings are currently leading the market and are predicted to fuel manufacturer expansion due to their high demand. This category is expected to account for about 2/5th of the worldwide demand.

Owing to its unique qualities, such as boosting thermal efficiency and improving the overall look of walls, this kind is highly sought in industrial, commercial, and even residential sectors. Furthermore, it lets natural light to permeate deeper into the structure.

Competitive Analysis

Some of the key players operating in Faux Paints and Coatings market include The Sherwin-Williams Co., Nippon Paint Holdings Co., Axalta Coating Systems, Kansai Paint Co. Ltd., Faux Effects International, Jotun, PPG, AkzoNobel, RPM International Inc., BASF Coatings, and Asian Paints Ltd.

  • In 2021, Faux Effects International Inc. announced the release of WALLSILKTM, a one-of-a-kind Faux Effects decorative coating that, when combined with ShimmerCoat, evokes the look, feel, and elegance of raw silk and other magnificent materials.
  • In 2020, PPG Industries, Inc. announced that it will introduce a new line of fake finish coatings in a variety of neutral hues.

Similarly, recent developments related to companies Faux Paints and Coatings services have been tracked by the team at Future Market Insights, which are available in the full report.

Faux Paints And Coatings Market Report Scope

Attributes Details
Forecast Period 2022 to 2032
Historical Data Available for 2017 to 2021
Market Analysis US$ Billion for Value
Key Regions Covered North America, Latin America, Europe, Asia Pacific, Middle East & Africa
Key Countries Covered United States, Canada, Brazil, Mexico, Germany, UK, France, Spain, Italy, Russia, China, Japan, South Korea, India, Australia, South Africa, Saudi Arabia, UAE and Israel.
Key Market Segments Covered Type, Application, Region
Key Companies Profiled
  • The Sherwin-Williams Co.
  • Nippon Paint Holdings Co.
  • Axalta Coating Systems
  • Kansai Paint Co. Ltd.
  • Faux Effects International
  • Jotun
  • PPG
  • AkzoNobel
  • RPM International Inc.
  • BASF Coatings
  • Asian Paints Ltd.
Pricing Available upon Request

Market Segments Covered In Faux Paints And Coatings Market Analysis

By Type:

  • Plasters
  • Metallics
  • Wall Glazing
  • Marbleizing
  • Other Types

By Application:

  • Building & Construction
  • Furniture
  • Other Applications

By Region:

  • North America
  • Latin America
  • Europe
  • APAC
  • MEA

Frequently Asked Questions

How much is the current worth of the Faux Paints and Coatings Market?

The global Faux Paints and Coatings Market is worth more than US$ 7.6 Bn at present.

What is the sales forecast for Faux Paints and Coatings Market?

Value of Faux Paints and Coatings Market are projected to increase at a CAGR of around 6.3% during 2022 – 2032.

What was the last 5 year’s market CAGR?

Value of Faux Paints and Coatings Market increased at a CAGR of around 5.7% during 2017 – 2021.

What is a key trend shaping the growth of the market for Faux Paints and Coatings Market?

Rise in demand for advanced coating materials and increase in adoption of Faux Paints and Coatings in construction applications, led by their decorative paint finishes and ability to provide easy, and smooth finishing, are major factors projected to drive the global Faux Paints and Coatings market during the forecast period

At what %age is sales of Faux Paints and Coatings Market going to register growth in China?

The market for Faux Paints and Coatings Market in China is projected to expand at a CAGR of around 8.1% during 2022 – 2032.

What do statistics for South Korea and Japan reveal?

While the market in South Korea is expected to grow at nearly 8.2%, the market in Japan is projected to register a CAGR of nearly 6.7% during 2022 - 2032.

Table of Content

1. Executive Summary

    1.1. Global Market Outlook

    1.2. Demand-side Trends

    1.3. Supply-side Trends

    1.4. Technology Roadmap Analysis

    1.5. Analysis and Recommendations

2. Market Overview

    2.1. Market Coverage / Taxonomy

    2.2. Market Definition / Scope / Limitations

3. Market Background

    3.1. Market Dynamics

        3.1.1. Drivers

        3.1.2. Restraints

        3.1.3. Opportunity

        3.1.4. Trends

    3.2. Scenario Forecast

        3.2.1. Demand in Optimistic Scenario

        3.2.2. Demand in Likely Scenario

        3.2.3. Demand in Conservative Scenario

    3.3. Opportunity Map Analysis

    3.4. Investment Feasibility Matrix

    3.5. PESTLE and Porter’s Analysis

    3.6. Regulatory Landscape

        3.6.1. By Key Regions

        3.6.2. By Key Countries

4. Global Faux Paints and Coatings Market Analysis 2017-2021 and Forecast, 2022-2032

    4.1. Historical Market Size Value (US$ Mn) Analysis, 2017-2021

    4.2. Current and Future Market Size Value (US$ Mn) Projections, 2022-2032

        4.2.1. Y-o-Y Growth Trend Analysis

        4.2.2. Absolute $ Opportunity Analysis

5. Global Faux Paints and Coatings Market Analysis 2017-2021 and Forecast 2022-2032, By Type

    5.1. Introduction / Key Findings

    5.2. Historical Market Size Value (US$ Mn) Analysis By Type, 2017-2021

    5.3. Current and Future Market Size Value (US$ Mn) Analysis and Forecast By Type, 2022-2032

        5.3.1. Plasters

        5.3.2. Metallics

        5.3.3. Wall Glazing

        5.3.4. Marbleizing

        5.3.5. Other Types

    5.4. Y-o-Y Growth Trend Analysis By Type, 2017-2021

    5.5. Absolute $ Opportunity Analysis By Type, 2022-2032

6. Global Faux Paints and Coatings Market Analysis 2017-2021 and Forecast 2022-2032, By Application

    6.1. Introduction / Key Findings

    6.2. Historical Market Size Value (US$ Mn) Analysis By Application, 2017-2021

    6.3. Current and Future Market Size Value (US$ Mn) Analysis and Forecast By Application, 2022-2032

        6.3.1. Building & Construction

        6.3.2. Furniture

        6.3.3. Other Applications

    6.4. Y-o-Y Growth Trend Analysis By Application, 2017-2021

    6.5. Absolute $ Opportunity Analysis By Application, 2022-2032

7. Global Faux Paints and Coatings Market Analysis 2017-2021 and Forecast 2022-2032, By Region

    7.1. Introduction

    7.2. Historical Market Size Value (US$ Mn) Analysis By Region, 2017-2021

    7.3. Current Market Size Value (US$ Mn) Analysis and Forecast By Region, 2022-2032

        7.3.1. North America

        7.3.2. Latin America

        7.3.3. Europe

        7.3.4. Asia Pacific

        7.3.5. MEA

    7.4. Market Attractiveness Analysis By Region

8. North America Faux Paints and Coatings Market Analysis 2017-2021 and Forecast 2022-2032, By Country

    8.1. Historical Market Size Value (US$ Mn) Trend Analysis By Market Taxonomy, 2017-2021

    8.2. Market Size Value (US$ Mn) Forecast By Market Taxonomy, 2022-2032

        8.2.1. By Country

            8.2.1.1. U.S.

            8.2.1.2. Canada

        8.2.2. By Type

        8.2.3. By Application

    8.3. Market Attractiveness Analysis

        8.3.1. By Country

        8.3.2. By Type

        8.3.3. By Application

    8.4. Key Takeaways

9. Latin America Faux Paints and Coatings Market Analysis 2017-2021 and Forecast 2022-2032, By Country

    9.1. Historical Market Size Value (US$ Mn) Trend Analysis By Market Taxonomy, 2017-2021

    9.2. Market Size Value (US$ Mn) Forecast By Market Taxonomy, 2022-2032

        9.2.1. By Country

            9.2.1.1. Brazil

            9.2.1.2. Mexico

            9.2.1.3. Rest of Latin America

        9.2.2. By Type

        9.2.3. By Application

    9.3. Market Attractiveness Analysis

        9.3.1. By Country

        9.3.2. By Type

        9.3.3. By Application

    9.4. Key Takeaways

10. Europe Faux Paints and Coatings Market Analysis 2017-2021 and Forecast 2022-2032, By Country

    10.1. Historical Market Size Value (US$ Mn) Trend Analysis By Market Taxonomy, 2017-2021

    10.2. Market Size Value (US$ Mn) Forecast By Market Taxonomy, 2022-2032

        10.2.1. By Country

            10.2.1.1. Germany

            10.2.1.2. Italy

            10.2.1.3. France

            10.2.1.4. U.K.

            10.2.1.5. Spain

            10.2.1.6. Russia

            10.2.1.7. BENELUX

            10.2.1.8. Rest of Europe

        10.2.2. By Type

        10.2.3. By Application

    10.3. Market Attractiveness Analysis

        10.3.1. By Country

        10.3.2. By Type

        10.3.3. By Application

    10.4. Key Takeaways

11. Asia Pacific Faux Paints and Coatings Market Analysis 2017-2021 and Forecast 2022-2032, By Country

    11.1. Historical Market Size Value (US$ Mn) Trend Analysis By Market Taxonomy, 2017-2021

    11.2. Market Size Value (US$ Mn) Forecast By Market Taxonomy, 2022-2032

        11.2.1. By Country

            11.2.1.1. China

            11.2.1.2. Japan

            11.2.1.3. South Korea

            11.2.1.4. India

            11.2.1.5. Rest of Asia Pacific

        11.2.2. By Type

        11.2.3. By Application

    11.3. Market Attractiveness Analysis

        11.3.1. By Country

        11.3.2. By Type

        11.3.3. By Application

    11.4. Key Takeaways

12. MEA Faux Paints and Coatings Market Analysis 2017-2021 and Forecast 2022-2032, By Country

    12.1. Historical Market Size Value (US$ Mn) Trend Analysis By Market Taxonomy, 2017-2021

    12.2. Market Size Value (US$ Mn) Forecast By Market Taxonomy, 2022-2032

        12.2.1. By Country

            12.2.1.1. GCC

            12.2.1.2. Rest of MEA

        12.2.2. By Type

        12.2.3. By Application

    12.3. Market Attractiveness Analysis

        12.3.1. By Country

        12.3.2. By Type

        12.3.3. By Application

    12.4. Key Takeaways

13. Key Countries Faux Paints and Coatings Market Analysis

    13.1. U.S.

        13.1.1. Pricing Analysis

        13.1.2. Market Share Analysis, 2021

            13.1.2.1. By Type

            13.1.2.2. By Application

    13.2. Canada

        13.2.1. Pricing Analysis

        13.2.2. Market Share Analysis, 2021

            13.2.2.1. By Type

            13.2.2.2. By Application

    13.3. Brazil

        13.3.1. Pricing Analysis

        13.3.2. Market Share Analysis, 2021

            13.3.2.1. By Type

            13.3.2.2. By Application

    13.4. Mexico

        13.4.1. Pricing Analysis

        13.4.2. Market Share Analysis, 2021

            13.4.2.1. By Type

            13.4.2.2. By Application

    13.5. Argentina

        13.5.1. Pricing Analysis

        13.5.2. Market Share Analysis, 2021

            13.5.2.1. By Type

            13.5.2.2. By Application

    13.6. Germany

        13.6.1. Pricing Analysis

        13.6.2. Market Share Analysis, 2021

            13.6.2.1. By Type

            13.6.2.2. By Application

    13.7. Italy

        13.7.1. Pricing Analysis

        13.7.2. Market Share Analysis, 2021

            13.7.2.1. By Type

            13.7.2.2. By Application

    13.8. France

        13.8.1. Pricing Analysis

        13.8.2. Market Share Analysis, 2021

            13.8.2.1. By Type

            13.8.2.2. By Application

    13.9. U.K.

        13.9.1. Pricing Analysis

        13.9.2. Market Share Analysis, 2021

            13.9.2.1. By Type

            13.9.2.2. By Application

    13.10. Spain

        13.10.1. Pricing Analysis

        13.10.2. Market Share Analysis, 2021

            13.10.2.1. By Type

            13.10.2.2. By Application

    13.11. Russia

        13.11.1. Pricing Analysis

        13.11.2. Market Share Analysis, 2021

            13.11.2.1. By Type

            13.11.2.2. By Application

    13.12. BENELUX

        13.12.1. Pricing Analysis

        13.12.2. Market Share Analysis, 2021

            13.12.2.1. By Type

            13.12.2.2. By Application

    13.13. China

        13.13.1. Pricing Analysis

        13.13.2. Market Share Analysis, 2021

            13.13.2.1. By Type

            13.13.2.2. By Application

    13.14. Japan

        13.14.1. Pricing Analysis

        13.14.2. Market Share Analysis, 2021

            13.14.2.1. By Type

            13.14.2.2. By Application

    13.15. South Korea

        13.15.1. Pricing Analysis

        13.15.2. Market Share Analysis, 2021

            13.15.2.1. By Type

            13.15.2.2. By Application

    13.16. India

        13.16.1. Pricing Analysis

        13.16.2. Market Share Analysis, 2021

            13.16.2.1. By Type

            13.16.2.2. By Application

    13.17. GCC Countries

        13.17.1. Pricing Analysis

        13.17.2. Market Share Analysis, 2021

            13.17.2.1. By Type

            13.17.2.2. By Application

14. Market Structure Analysis

    14.1. Competition Dashboard

    14.2. Competition Benchmarking

    14.3. Market Share Analysis of Top Players

        14.3.1. By Regional

        14.3.2. By Type

        14.3.3. By Application

15. Competition Analysis

    15.1. Competition Deep Dive

        15.1.1. The Sherwin-Williams Co.

            15.1.1.1. Overview

            15.1.1.2. Product Portfolio

            15.1.1.3. Profitability by Market Segment

            15.1.1.4. Sales Footprint

            15.1.1.5. Strategy Overview

                15.1.1.5.1. Marketing Strategy

                15.1.1.5.2. Product Strategy

        15.1.2. Nippon Paint Holdings Co.

            15.1.2.1. Overview

            15.1.2.2. Product Portfolio

            15.1.2.3. Profitability by Market Segment

            15.1.2.4. Sales Footprint

            15.1.2.5. Strategy Overview

                15.1.2.5.1. Marketing Strategy

                15.1.2.5.2. Product Strategy

        15.1.3. Axalta Coating Systems

            15.1.3.1. Overview

            15.1.3.2. Product Portfolio

            15.1.3.3. Profitability by Market Segment

            15.1.3.4. Sales Footprint

            15.1.3.5. Strategy Overview

                15.1.3.5.1. Marketing Strategy

                15.1.3.5.2. Product Strategy

        15.1.4. Kansai Paint Co. Ltd.

            15.1.4.1. Overview

            15.1.4.2. Product Portfolio

            15.1.4.3. Profitability by Market Segment

            15.1.4.4. Sales Footprint

            15.1.4.5. Strategy Overview

                15.1.4.5.1. Marketing Strategy

                15.1.4.5.2. Product Strategy

        15.1.5. Faux Effects International

            15.1.5.1. Overview

            15.1.5.2. Product Portfolio

            15.1.5.3. Profitability by Market Segment

            15.1.5.4. Sales Footprint

            15.1.5.5. Strategy Overview

                15.1.5.5.1. Marketing Strategy

                15.1.5.5.2. Product Strategy

        15.1.6. Jotun

            15.1.6.1. Overview

            15.1.6.2. Product Portfolio

            15.1.6.3. Profitability by Market Segment

            15.1.6.4. Sales Footprint

            15.1.6.5. Strategy Overview

                15.1.6.5.1. Marketing Strategy

                15.1.6.5.2. Product Strategy

        15.1.7. PPG

            15.1.7.1. Overview

            15.1.7.2. Product Portfolio

            15.1.7.3. Profitability by Market Segment

            15.1.7.4. Sales Footprint

            15.1.7.5. Strategy Overview

                15.1.7.5.1. Marketing Strategy

                15.1.7.5.2. Product Strategy

        15.1.8. AkzoNobel

            15.1.8.1. Overview

            15.1.8.2. Product Portfolio

            15.1.8.3. Profitability by Market Segment

            15.1.8.4. Sales Footprint

            15.1.8.5. Strategy Overview

                15.1.8.5.1. Marketing Strategy

                15.1.8.5.2. Product Strategy

        15.1.9. RPM International, Inc.

            15.1.9.1. Overview

            15.1.9.2. Product Portfolio

            15.1.9.3. Profitability by Market Segment

            15.1.9.4. Sales Footprint

            15.1.9.5. Strategy Overview

                15.1.9.5.1. Marketing Strategy

                15.1.9.5.2. Product Strategy

        15.1.10. BASF Coatings

            15.1.10.1. Overview

            15.1.10.2. Product Portfolio

            15.1.10.3. Profitability by Market Segment

            15.1.10.4. Sales Footprint

            15.1.10.5. Strategy Overview

                15.1.10.5.1. Marketing Strategy

                15.1.10.5.2. Product Strategy

        15.1.11. Asian Paints Ltd.

            15.1.11.1. Overview

            15.1.11.2. Product Portfolio

            15.1.11.3. Profitability by Market Segment

            15.1.11.4. Sales Footprint

            15.1.11.5. Strategy Overview

                15.1.11.5.1. Marketing Strategy

                15.1.11.5.2. Product Strategy

16. Assumptions & Acronyms Used

17. Research Methodology

Don't pay for what you don't need

Customize your report by selecting specific countries or regions and save 30%!

List of Tables

Table 01: Global Faux Paints and Coatings Market Value (US$ Mn) Forecast by Region, 2017-2032

Table 02: Global Faux Paints and Coatings Market Value (US$ Mn) Forecast by Type, 2017-2032

Table 03: Global Faux Paints and Coatings Market Value (US$ Mn) Forecast by Application, 2017-2032

Table 04: North America Faux Paints and Coatings Market Value (US$ Mn) Forecast by Country, 2017-2032

Table 05: North America Faux Paints and Coatings Market Value (US$ Mn) Forecast by Type, 2017-2032

Table 06: North America Faux Paints and Coatings Market Value (US$ Mn) Forecast by Application, 2017-2032

Table 07: Latin America Faux Paints and Coatings Market Value (US$ Mn) Forecast by Country, 2017-2032

Table 08: Latin America Faux Paints and Coatings Market Value (US$ Mn) Forecast by Type, 2017-2032

Table 09: Latin America Faux Paints and Coatings Market Value (US$ Mn) Forecast by Application, 2017-2032

Table 10: Europe Faux Paints and Coatings Market Value (US$ Mn) Forecast by Country, 2017-2032

Table 11: Europe Faux Paints and Coatings Market Value (US$ Mn) Forecast by Type, 2017-2032

Table 12: Europe Faux Paints and Coatings Market Value (US$ Mn) Forecast by Application, 2017-2032

Table 13: Asia Pacific Faux Paints and Coatings Market Value (US$ Mn) Forecast by Country, 2017-2032

Table 14: Asia Pacific Faux Paints and Coatings Market Value (US$ Mn) Forecast by Type, 2017-2032

Table 15: Asia Pacific Faux Paints and Coatings Market Value (US$ Mn) Forecast by Application, 2017-2032

Table 16: MEA Faux Paints and Coatings Market Value (US$ Mn) Forecast by Country, 2017-2032

Table 17: MEA Faux Paints and Coatings Market Value (US$ Mn) Forecast by Type, 2017-2032

Table 18: MEA Faux Paints and Coatings Market Value (US$ Mn) Forecast by Application, 2017-2032
Nikhil Kaitwade
Nikhil Kaitwade

Principal Consultant

Talk to Analyst

Find your sweet spots for generating winning opportunities in this market.

List of Charts

Figure 01: Global Faux Paints and Coatings Market Value (US$ Mn) by Type, 2022-2032

Figure 02: Global Faux Paints and Coatings Market Value (US$ Mn) by Application, 2022-2032

Figure 03: Global Faux Paints and Coatings Market Value (US$ Mn) by Region, 2022-2032

Figure 04: Global Faux Paints and Coatings Market Value (US$ Mn) Analysis by Region, 2017-2032

Figure 05: Global Faux Paints and Coatings Market Value Share (%) and BPS Analysis by Region, 2022-2032

Figure 06: Global Faux Paints and Coatings Market Y-o-Y Growth (%) Projections by Region, 2022-2032

Figure 07: Global Faux Paints and Coatings Market Value (US$ Mn) Analysis by Type, 2017-2032

Figure 08: Global Faux Paints and Coatings Market Value Share (%) and BPS Analysis by Type, 2022-2032

Figure 09: Global Faux Paints and Coatings Market Y-o-Y Growth (%) Projections by Type, 2022-2032

Figure 10: Global Faux Paints and Coatings Market Value (US$ Mn) Analysis by Application, 2017-2032

Figure 11: Global Faux Paints and Coatings Market Value Share (%) and BPS Analysis by Application, 2022-2032

Figure 12: Global Faux Paints and Coatings Market Y-o-Y Growth (%) Projections by Application, 2022-2032

Figure 13: Global Faux Paints and Coatings Market Attractiveness by Type, 2022-2032

Figure 14: Global Faux Paints and Coatings Market Attractiveness by Application, 2022-2032

Figure 15: Global Faux Paints and Coatings Market Attractiveness by Region, 2022-2032

Figure 16: North America Faux Paints and Coatings Market Value (US$ Mn) by Type, 2022-2032

Figure 17: North America Faux Paints and Coatings Market Value (US$ Mn) by Application, 2022-2032

Figure 18: North America Faux Paints and Coatings Market Value (US$ Mn) by Country, 2022-2032

Figure 19: North America Faux Paints and Coatings Market Value (US$ Mn) Analysis by Country, 2017-2032

Figure 20: North America Faux Paints and Coatings Market Value Share (%) and BPS Analysis by Country, 2022-2032

Figure 21: North America Faux Paints and Coatings Market Y-o-Y Growth (%) Projections by Country, 2022-2032

Figure 22: North America Faux Paints and Coatings Market Value (US$ Mn) Analysis by Type, 2017-2032

Figure 23: North America Faux Paints and Coatings Market Value Share (%) and BPS Analysis by Type, 2022-2032

Figure 24: North America Faux Paints and Coatings Market Y-o-Y Growth (%) Projections by Type, 2022-2032

Figure 25: North America Faux Paints and Coatings Market Value (US$ Mn) Analysis by Application, 2017-2032

Figure 26: North America Faux Paints and Coatings Market Value Share (%) and BPS Analysis by Application, 2022-2032

Figure 27: North America Faux Paints and Coatings Market Y-o-Y Growth (%) Projections by Application, 2022-2032

Figure 28: North America Faux Paints and Coatings Market Attractiveness by Type, 2022-2032

Figure 29: North America Faux Paints and Coatings Market Attractiveness by Application, 2022-2032

Figure 30: North America Faux Paints and Coatings Market Attractiveness by Country, 2022-2032

Figure 31: Latin America Faux Paints and Coatings Market Value (US$ Mn) by Type, 2022-2032

Figure 32: Latin America Faux Paints and Coatings Market Value (US$ Mn) by Application, 2022-2032

Figure 33: Latin America Faux Paints and Coatings Market Value (US$ Mn) by Country, 2022-2032

Figure 34: Latin America Faux Paints and Coatings Market Value (US$ Mn) Analysis by Country, 2017-2032

Figure 35: Latin America Faux Paints and Coatings Market Value Share (%) and BPS Analysis by Country, 2022-2032

Figure 36: Latin America Faux Paints and Coatings Market Y-o-Y Growth (%) Projections by Country, 2022-2032

Figure 37: Latin America Faux Paints and Coatings Market Value (US$ Mn) Analysis by Type, 2017-2032

Figure 38: Latin America Faux Paints and Coatings Market Value Share (%) and BPS Analysis by Type, 2022-2032

Figure 39: Latin America Faux Paints and Coatings Market Y-o-Y Growth (%) Projections by Type, 2022-2032

Figure 40: Latin America Faux Paints and Coatings Market Value (US$ Mn) Analysis by Application, 2017-2032

Figure 41: Latin America Faux Paints and Coatings Market Value Share (%) and BPS Analysis by Application, 2022-2032

Figure 42: Latin America Faux Paints and Coatings Market Y-o-Y Growth (%) Projections by Application, 2022-2032

Figure 43: Latin America Faux Paints and Coatings Market Attractiveness by Type, 2022-2032

Figure 44: Latin America Faux Paints and Coatings Market Attractiveness by Application, 2022-2032

Figure 45: Latin America Faux Paints and Coatings Market Attractiveness by Country, 2022-2032

Figure 46: Europe Faux Paints and Coatings Market Value (US$ Mn) by Type, 2022-2032

Figure 47: Europe Faux Paints and Coatings Market Value (US$ Mn) by Application, 2022-2032

Figure 48: Europe Faux Paints and Coatings Market Value (US$ Mn) by Country, 2022-2032

Figure 49: Europe Faux Paints and Coatings Market Value (US$ Mn) Analysis by Country, 2017-2032

Figure 50: Europe Faux Paints and Coatings Market Value Share (%) and BPS Analysis by Country, 2022-2032

Figure 51: Europe Faux Paints and Coatings Market Y-o-Y Growth (%) Projections by Country, 2022-2032

Figure 52: Europe Faux Paints and Coatings Market Value (US$ Mn) Analysis by Type, 2017-2032

Figure 53: Europe Faux Paints and Coatings Market Value Share (%) and BPS Analysis by Type, 2022-2032

Figure 54: Europe Faux Paints and Coatings Market Y-o-Y Growth (%) Projections by Type, 2022-2032

Figure 55: Europe Faux Paints and Coatings Market Value (US$ Mn) Analysis by Application, 2017-2032

Figure 56: Europe Faux Paints and Coatings Market Value Share (%) and BPS Analysis by Application, 2022-2032

Figure 57: Europe Faux Paints and Coatings Market Y-o-Y Growth (%) Projections by Application, 2022-2032

Figure 58: Europe Faux Paints and Coatings Market Attractiveness by Type, 2022-2032

Figure 59: Europe Faux Paints and Coatings Market Attractiveness by Application, 2022-2032

Figure 60: Europe Faux Paints and Coatings Market Attractiveness by Country, 2022-2032

Figure 61: Asia Pacific Faux Paints and Coatings Market Value (US$ Mn) by Type, 2022-2032

Figure 62: Asia Pacific Faux Paints and Coatings Market Value (US$ Mn) by Application, 2022-2032

Figure 63: Asia Pacific Faux Paints and Coatings Market Value (US$ Mn) by Country, 2022-2032

Figure 64: Asia Pacific Faux Paints and Coatings Market Value (US$ Mn) Analysis by Country, 2017-2032

Figure 65: Asia Pacific Faux Paints and Coatings Market Value Share (%) and BPS Analysis by Country, 2022-2032

Figure 66: Asia Pacific Faux Paints and Coatings Market Y-o-Y Growth (%) Projections by Country, 2022-2032

Figure 67: Asia Pacific Faux Paints and Coatings Market Value (US$ Mn) Analysis by Type, 2017-2032

Figure 68: Asia Pacific Faux Paints and Coatings Market Value Share (%) and BPS Analysis by Type, 2022-2032

Figure 69: Asia Pacific Faux Paints and Coatings Market Y-o-Y Growth (%) Projections by Type, 2022-2032

Figure 70: Asia Pacific Faux Paints and Coatings Market Value (US$ Mn) Analysis by Application, 2017-2032

Figure 71: Asia Pacific Faux Paints and Coatings Market Value Share (%) and BPS Analysis by Application, 2022-2032

Figure 72: Asia Pacific Faux Paints and Coatings Market Y-o-Y Growth (%) Projections by Application, 2022-2032

Figure 73: Asia Pacific Faux Paints and Coatings Market Attractiveness by Type, 2022-2032

Figure 74: Asia Pacific Faux Paints and Coatings Market Attractiveness by Application, 2022-2032

Figure 75: Asia Pacific Faux Paints and Coatings Market Attractiveness by Country, 2022-2032

Figure 76: MEA Faux Paints and Coatings Market Value (US$ Mn) by Type, 2022-2032

Figure 77: MEA Faux Paints and Coatings Market Value (US$ Mn) by Application, 2022-2032

Figure 78: MEA Faux Paints and Coatings Market Value (US$ Mn) by Country, 2022-2032

Figure 79: MEA Faux Paints and Coatings Market Value (US$ Mn) Analysis by Country, 2017-2032

Figure 80: MEA Faux Paints and Coatings Market Value Share (%) and BPS Analysis by Country, 2022-2032

Figure 81: MEA Faux Paints and Coatings Market Y-o-Y Growth (%) Projections by Country, 2022-2032

Figure 82: MEA Faux Paints and Coatings Market Value (US$ Mn) Analysis by Type, 2017-2032

Figure 83: MEA Faux Paints and Coatings Market Value Share (%) and BPS Analysis by Type, 2022-2032

Figure 84: MEA Faux Paints and Coatings Market Y-o-Y Growth (%) Projections by Type, 2022-2032

Figure 85: MEA Faux Paints and Coatings Market Value (US$ Mn) Analysis by Application, 2017-2032

Figure 86: MEA Faux Paints and Coatings Market Value Share (%) and BPS Analysis by Application, 2022-2032

Figure 87: MEA Faux Paints and Coatings Market Y-o-Y Growth (%) Projections by Application, 2022-2032

Figure 88: MEA Faux Paints and Coatings Market Attractiveness by Type, 2022-2032

Figure 89: MEA Faux Paints and Coatings Market Attractiveness by Application, 2022-2032

Figure 90: MEA Faux Paints and Coatings Market Attractiveness by Country, 2022-2032

Explore Chemicals & Materials Insights

View Reports

Faux Paints And Coatings Market