The global coil coatings market is valued at USD 5.8 billion in 2025 and is slated to reach USD 9.2 billion by 2035, recording an absolute increase of USD 3.4 billion over the forecast period. This translates into a total growth of 58.6%, with the market forecast to expand at a CAGR of 4.7% between 2025 and 2035.
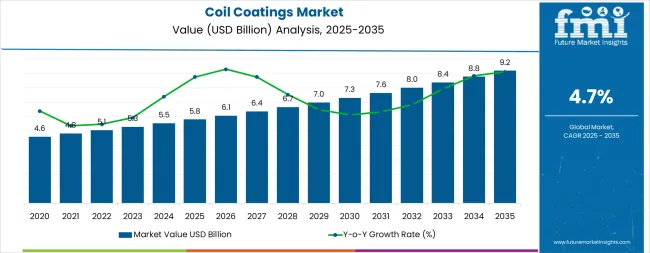
The market size is expected to grow by nearly 1.59X during the same period, supported by increasing construction activity for architectural facades and roofing systems, growing adoption of pre-finished metal products reducing on-site painting requirements, and rising demand for durable and corrosion-resistant coatings across building envelope, transportation, and appliance manufacturing applications.
Between 2025 and 2030, the market is projected to expand from USD 5.8 billion to USD 7.3 billion, resulting in a value increase of USD 1.5 billion, which represents 44.1% of the total forecast growth for the decade. This phase of development will be shaped by increasing infrastructure investment programs, rising adoption of low-VOC and water-borne coating formulations meeting environmental regulations, and growing demand for energy-efficient building envelope systems incorporating pre-finished metal cladding and roofing products.
Coil coating manufacturers are expanding their production capabilities to address the growing demand for high-performance polyester and PVDF systems, textured and metallic finishes, and ecofriendly coating technologies for architectural and industrial metal substrate applications.
From 2030 to 2035, the market is forecast to grow from USD 7.3 billion to USD 9.2 billion, adding another USD 1.9 billion, which constitutes 55.9% of the overall ten-year expansion. This period is expected to be characterized by the expansion of digital color matching and customization technologies, the integration of smart coating formulations with self-cleaning and antimicrobial properties, and the development of ultra-durable fluoropolymer systems for extreme climate applications and coastal environments.
The growing adoption of circular economy principles in building materials and the proliferation of solar-reflective cool roof coatings will drive demand for coil coating products with enhanced sustainability credentials, superior weathering resistance, and comprehensive performance documentation.
Between 2020 and 2025, the coil coatings market experienced steady growth, driven by increasing construction activity and growing recognition of coil-coated metal products as efficient alternatives to field-applied coatings offering superior finish quality, enhanced durability, and reduced labor requirements.
The market developed as architects and contractors recognized the potential for pre-finished metal to accelerate construction schedules while delivering consistent appearance and long-term performance. Technological advancement in coating chemistry and application processes began focusing the critical importance of environmental compliance, color retention, and corrosion protection in modern building and industrial applications.
| Metric | Value |
|---|---|
| Estimated Value in (2025E) | USD 5.8 billion |
| Forecast Value in (2035F) | USD 9.2 billion |
| Forecast CAGR (2025 to 2035) | 4.7% |
Market expansion is being supported by the increasing global construction activity for commercial, industrial, and residential buildings requiring durable and aesthetically appealing metal cladding, roofing, and building envelope systems that provide long-term weather protection, color stability, and low-maintenance performance across diverse architectural applications.
Modern architects and building owners are increasingly focused on implementing pre-finished metal products that can reduce on-site installation time, eliminate field painting costs and quality variability, and provide factory-controlled coating application ensuring uniform appearance and comprehensive corrosion protection. Coil coatings' proven ability to deliver superior durability, design flexibility, and application efficiency make them essential materials for contemporary metal building systems and architectural facades.
The growing focus on environmental sustainability and regulatory compliance is driving demand for low-VOC and water-borne coil coating formulations that reduce emissions during manufacturing and application while meeting stringent REACH, EPA, and regional air quality regulations. Building material manufacturers' preference for coating systems that combine technical performance with environmental responsibility and energy efficiency is creating opportunities for innovative coil coating implementations.
The rising influence of green building certification programs, cool roof initiatives, and green construction practices is also contributing to increased adoption of solar-reflective coatings, recycled-content formulations, and extended-life coating systems that support building energy performance and lifecycle environmental impact reduction.
The coil coatings market is poised for steady growth driven by construction modernization and ecofriendly advancement. As building owners, architects, and metal product manufacturers across developed and emerging markets seek coating solutions that deliver exceptional durability, aesthetic versatility, environmental compliance, and application efficiency, coil coatings are gaining prominence not just as protective finishes but as value-added building materials enabling architectural expression, lifecycle cost reduction, and sustainable construction practices.
Rising infrastructure investment, accelerating building retrofit programs, and expanding metal construction adoption in Asia-Pacific amplify demand, while coating manufacturers are advancing innovations in fluoropolymer systems, textured finishes, antimicrobial surfaces, and bio-based formulations.
Pathways like premium PVDF and super-durable systems, low-VOC and water-borne technologies, and functional smart coatings promise margin improvement, especially in architectural and high-performance industrial segments. Geographic expansion and technical service localization will capture volume growth in emerging Asian construction markets. Regulatory drivers around VOC restrictions, energy efficiency mandates, circular economy requirements, and building performance standards provide structural support.
The market is segmented by material type, end use, product type, and region. By material type, the market is divided into polyester (silicone-modified polyester, standard polyester, super-durable/HD polyester), polyurethane, PVDF, epoxy, acrylic, PVC/plastisols, and silicone.
By end use, it covers construction (roofing & facades, wall panels & cladding, rainwater systems/doors/shutters, industrial buildings & warehouses), transportation (automotive, trailers/railcars, containers), HVAC, metal furniture, and appliances/other.
By product type, it is categorized into topcoats (polyester topcoats, PVDF topcoats, polyurethane topcoats, acrylic topcoats), primers, backing coats, and others. Regionally, the market is divided into North America, Europe, East Asia, South Asia & Pacific, Latin America, and the Middle East & Africa.
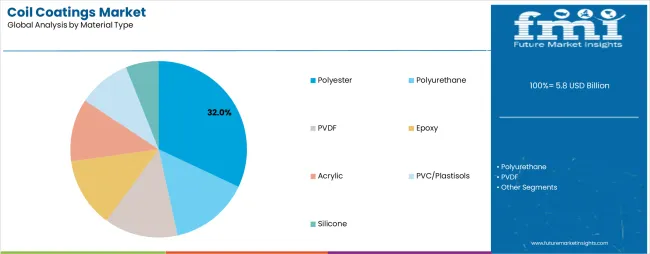
The polyester segment is projected to account for 32.0% of the coil coatings market in 2025, reaffirming its position as the leading material type category. Building product manufacturers and metal coaters increasingly utilize polyester coil coatings for their excellent cost-performance balance, good weathering resistance, broad color availability, and versatile application compatibility across architectural metal roofing, wall panels, and industrial metal products. Polyester coating technology's proven durability and economic value directly address the building material industry requirements for reliable performance at competitive pricing in moderate climate applications and standard architectural exposures.
Within the polyester segment, silicone-modified polyester formulations command 14.0% of the material type market, offering enhanced gloss retention and superior weathering performance compared to standard polyester systems while maintaining cost advantages over premium fluoropolymer coatings. Standard polyester represents 12.0% of the segment, providing cost-effective solutions for commercial and industrial building applications with moderate durability requirements. Super-durable and high-durability polyester systems account for 6.0% of the material type market, delivering extended service life approaching premium coating performance in demanding architectural applications.
This material type segment forms the foundation of modern coil coating operations, as it represents the chemistry family with the broadest application scope and widest market acceptance across building envelope and industrial metal products. Coating manufacturer investments in resin technology advancement and pigment selection continue to strengthen polyester performance characteristics. With building owners balancing lifecycle cost and appearance retention, polyester coatings align with both budget objectives and performance expectations, making them the central component of comprehensive coil coating portfolios.
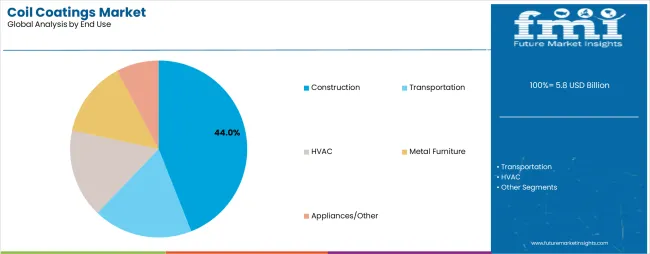
Construction applications are projected to represent 44.0% of coil coatings demand in 2025, underscoring their critical role as the dominant end-use sector consuming pre-finished metal products for building envelope systems, architectural facades, roofing installations, and interior building applications. Construction industry professionals prefer coil-coated metal for its factory-applied finish quality, accelerated installation schedules, reduced on-site labor requirements, and comprehensive warranty coverage supporting long-term building performance and aesthetic appearance.
Within the construction segment, roofing and facades represent 22.0% of end-use demand, serving both new construction and retrofit applications requiring durable and weather-resistant metal cladding systems. Wall panels and cladding account for 12.0% of the construction market, providing exterior envelope solutions for commercial, industrial, and residential buildings. Rainwater systems, doors, and shutters command 6.0% of construction demand, while industrial buildings and warehouses represent 4.0% of the segment, requiring cost-effective and durable metal building systems.
The segment is supported by continuous innovation in architectural metal systems and the growing adoption of energy-efficient building envelopes incorporating insulated metal panels. Building developers and contractors are investing in pre-engineered metal building systems to accelerate construction schedules. As green construction practices expand and building codes prioritizes energy performance, construction applications will continue to dominate the end-user market while supporting next-generation building envelope technologies and prefabricated construction methods.
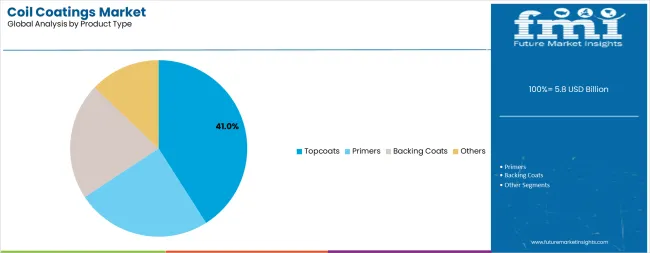
Topcoats are projected to represent 41.0% of coil coatings demand in 2025, underscoring their importance as the primary coating layer providing color, gloss, weathering resistance, and aesthetic appearance for finished metal products across architectural and industrial applications. Coating manufacturers and metal coaters prioritize topcoat performance for its direct impact on product appearance, customer satisfaction, and warranty commitments requiring proven durability and color retention characteristics.
Within the topcoats segment, polyester topcoats command 18.0% of product type demand, offering cost-effective color and protection for standard architectural and industrial applications. PVDF topcoats represent 10.0% of the segment, providing premium durability and extended warranty coverage for high-profile architectural projects and coastal environments. Polyurethane topcoats account for 7.0% of product type demand, delivering enhanced flexibility and impact resistance for transportation and appliance applications. Acrylic topcoats command 6.0% of the segment, serving specialized applications requiring specific performance characteristics.
The topcoats segment is supported by continuous color and texture innovation enabling architectural design flexibility and brand differentiation for building product manufacturers. Coating companies are investing in digital color matching technologies and custom formulation capabilities. As aesthetic expectations increase and durability requirements become more demanding, topcoats will continue to represent the highest-value coating layer while supporting architectural vision and building performance objectives.
The market is advancing steadily due to increasing construction activity and growing adoption of pre-finished metal building products that deliver factory-controlled coating quality, accelerated installation schedules, and superior long-term performance compared to field-applied painting systems across architectural facades, metal roofing, and industrial building applications.
The market faces challenges, including raw material cost volatility affecting coating formulation economics, competition from alternative building materials including fiber cement and composite panels in some applications, and the need for continuous investment in coating line automation and environmental compliance technologies. Innovation in low-temperature cure systems, antimicrobial surface technologies, and bio-based resin chemistries continues to influence product development and market differentiation strategies.
The growing stringency of environmental regulations including REACH in Europe, SCAQMD rules in California, and national air quality standards in China is enabling coating manufacturers to develop advanced low-VOC solvent-based and water-borne formulations that meet emission limits while maintaining application performance, coating appearance, and durability characteristics required for architectural and industrial metal coating applications.
Low-emission coating technologies provide regulatory compliance and environmental differentiation while allowing metal coaters to serve environmentally regulated markets and support customer sustainability initiatives. Manufacturers are increasingly recognizing the competitive advantages of environmental technology leadership for accessing premium market segments and supporting long-term regulatory compliance strategies.
Modern building owners and architects are specifying solar-reflective cool roof coatings with high total solar reflectance and thermal emittance properties that reduce building cooling loads, improve occupant comfort, and support energy code compliance including ASHRAE 90.1, California Title 24, and LEED certification requirements in commercial and industrial roofing applications.
Cool roof coatings enable energy performance differentiation while addressing climate adaptation needs in warming urban environments and supporting building owners' operational cost reduction and green objectives. Advanced cool roof technology also allows coating manufacturers to offer value-added performance benefits with documented energy savings supporting premium pricing and specification preference in energy-conscious building markets.
Coating companies are developing sophisticated color palettes, textured surfaces, metallic effects, and customized finishes that enable architects to achieve specific design visions and building owners to differentiate projects through distinctive facade appearance while maintaining the durability and maintenance benefits of factory-applied coil coatings. Premium architectural systems enable margin enhancement and stronger customer relationships through design collaboration and technical specification support addressing aesthetic objectives alongside performance requirements.
The focus on design innovation is creating opportunities for coating manufacturers to support architectural creativity while maintaining the cost and schedule advantages of pre-finished metal products in high-profile building projects and design-sensitive applications.
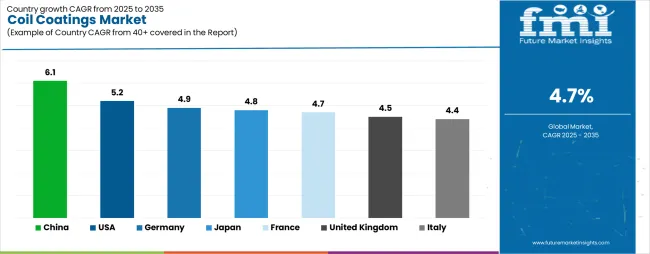
| Country | CAGR (2025-2035) |
|---|---|
| China | 6.1% |
| USA | 5.2% |
| Germany | 4.9% |
| Japan | 4.8% |
| France | 4.7% |
| United Kingdom | 4.5% |
| Italy | 4.4% |
The market is experiencing strong growth globally, with China leading at a 6.1% CAGR through 2035, driven by mega infrastructure development programs, expanding automotive production, and domestic coating manufacturers scaling low-VOC production lines for environmental compliance. The USA follows at 5.2%, supported by residential and commercial re-roofing activity, remodeling market strength, and stringent VOC regulations pushing adoption of water-borne and low-bake coating systems.
Germany shows growth at 4.9%, focusing premium automotive and machinery exports combined with automated coil coating line investments. Japan records 4.8%, focusing on electronics and appliance manufacturing requirements plus long-life facade performance standards.
France demonstrates 4.7% growth, driven by energy-efficient building code implementation and public infrastructure retrofit programs. The United Kingdom exhibits 4.5% growth, supported by green building focus and industrial park refurbishment activities. Italy shows 4.4% growth, prioritizing architectural facades, solar roof installations, and coastal corrosion-resistant specification requirements.
The report covers an in-depth analysis of 40+ countries, top-performing countries are highlighted below.
China is projected to exhibit exceptional growth with a CAGR of 6.1% through 2035, driven by massive infrastructure development programs including commercial buildings, transportation facilities, and industrial complexes requiring extensive metal cladding and roofing systems combined with large-scale automotive and appliance manufacturing consuming pre-finished metal components. The country's comprehensive coating industry infrastructure and substantial investment in environmental compliance technologies are creating significant demand for advanced coating formulations. Major coating manufacturers and metal coaters are establishing extensive production and technical service capabilities.
Government focus on environmental protection and air quality improvement is driving adoption of low-VOC coating technologies throughout major industrial regions. Strong construction activity and an expanding manufacturing base are supporting rapid consumption growth of polyester, PVDF, and specialty coil coating systems among building material producers and industrial metal fabricators seeking performance and regulatory compliance in domestic and export markets.
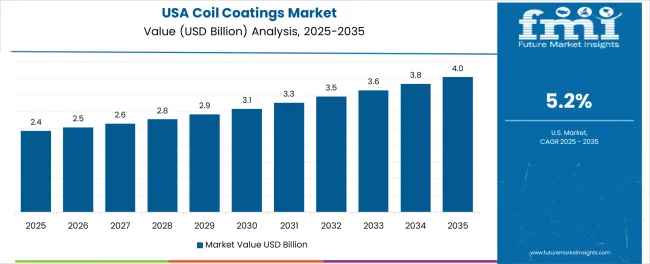
The USA is expanding at a CAGR of 5.2%, supported by the country's extensive residential and commercial re-roofing market, strong remodeling activity, and comprehensive VOC regulations including state-specific requirements driving adoption of compliant coating formulations. The nation's sophisticated building materials industry and focus on durability and warranty performance are maintaining strong demand for premium coil coating systems. Building product manufacturers and metal coaters are investing in coating line upgrades and environmental technologies.
Rising preference for metal roofing in residential applications and growing adoption of insulated metal panels in commercial construction are creating demand for architectural-grade coil coatings with extended warranties and superior appearance retention. Strong regulatory environment and comprehensive building code requirements are supporting adoption of cool roof coatings and low-emission formulations across roofing and building envelope applications.
Germany is growing at a CAGR of 4.9%, driven by the country's premium automotive and machinery manufacturing sectors requiring high-quality pre-finished metal components, sophisticated coating line automation supporting efficiency and consistency, and strong export orientation requiring internationally competitive quality standards. Germany's engineering excellence and manufacturing sophistication are supporting steady demand for advanced coil coating technologies. Automotive suppliers and appliance manufacturers are maintaining comprehensive coating quality programs.
Innovations in coating chemistry and application technology are creating demand for specialized formulations supporting automotive lightweighting initiatives and premium appliance aesthetics. Strong focus on environmental compliance and energy efficiency is driving adoption of low-emission coating systems and process optimization throughout manufacturing operations.
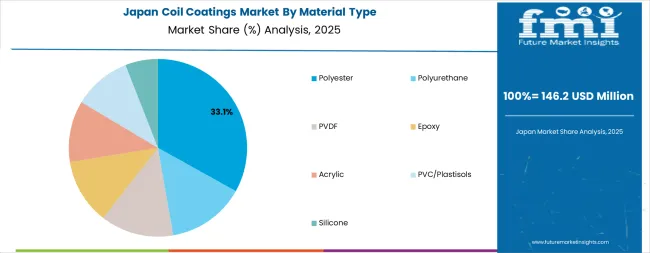
Japan is expanding at a CAGR of 4.8%, supported by the country's sophisticated electronics and appliance manufacturing requiring precise coating appearance and performance characteristics, stringent building facade durability standards demanding extended service life, and focus on quality and consistency in industrial manufacturing operations. Japan's technology leadership and quality culture are driving demand for premium coil coating formulations. Manufacturing companies and building material producers are investing in advanced coating specifications.
Regional specialization in high-quality consumer products and demanding architectural applications is creating opportunities for specialty coil coating formulations with exceptional appearance, durability, and performance characteristics. Strong focus on lifecycle performance and maintenance reduction is driving adoption of premium coating systems throughout building and industrial applications.
France is growing at a CAGR of 4.7%, driven by the country's comprehensive energy-efficient building code requirements including RE2020 regulations, substantial public infrastructure retrofit and modernization programs, and established building materials industry serving domestic and European markets. France's commitment to building energy performance and architectural quality are supporting steady coil coatings demand. Building product manufacturers and construction companies are implementing energy-efficient building envelope systems.
Government investment in building renovation programs and green construction initiatives are creating opportunities for coil-coated metal products in facade retrofits and roofing system upgrades. Growing focus on building lifecycle performance and environmental impact is supporting adoption of durable coating systems with verified performance characteristics.
The United Kingdom is expanding at a CAGR of 4.5%, supported by the country's strong green building certification adoption including BREEAM standards, growing industrial park refurbishment activity, and continuing construction sector recovery requiring building material supply including pre-finished metal products. The UK's focus on ecofriendly construction and building performance are maintaining steady coil coatings consumption. Building developers and industrial facility owners are specifying environmentally preferable building materials.
Rising focus on building energy efficiency and growing adoption of offsite construction methods incorporating pre-finished metal components are creating demand for coil coating systems supporting modular building production and accelerated construction schedules. Strong architectural metal systems market and comprehensive building regulations are supporting adoption of premium coating formulations.
Italy is growing at a CAGR of 4.4%, driven by the country's strong architectural facades tradition focusing aesthetic quality, expanding solar roof installations integrated with building envelope systems, and extensive coastal construction requiring superior corrosion-resistant coating specifications for maritime environments. Italy's design culture and building materials expertise are supporting steady demand for architectural-grade coil coatings. Architects and building product manufacturers are investing in design-oriented metal systems.
Traditional focus on building aesthetics combined with growing renewable energy integration is creating opportunities for premium coil coating systems supporting architectural vision and solar panel mounting applications. Coastal exposure requirements and Mediterranean climate conditions are driving adoption of advanced corrosion protection and UV-resistant coating formulations throughout major construction markets.

Europe accounts for an estimated 28.0% of global coil coatings demand in 2025, representing approximately USD 1.6 billion in market value, led by stringent REACH and VOC regulations driving adoption of low-VOC and water-borne coating systems, strong architectural facade and roofing demand in building retrofit programs, and comprehensive OEM manufacturing base for appliances and transportation applications.
Within Europe, Germany maintains market leadership driven by automotive and machinery export industries, premium manufacturing quality requirements, and sophisticated coating line automation supporting high-volume production efficiency. France demonstrates strong market presence supported by energy-efficient building codes, public infrastructure investment, and established building materials industry serving domestic and European markets.
Italy shows significant consumption driven by architectural facade applications, solar roofing installations, and coastal construction requiring corrosion-resistant specifications. The United Kingdom maintains substantial market presence supported by green building certification adoption and industrial facility modernization programs.
Spain demonstrates growing consumption driven by construction sector recovery and renewable energy infrastructure development. Southern European markets including Italy and Spain benefit particularly from construction activity and solar-roofing installations incorporating pre-finished metal products.
By 2035, Europe is projected to reach approximately USD 2.4 billion at a CAGR of around 4.2%, with Germany remaining the largest single market supported by automotive and industrial manufacturing strength, while Southern European markets continue expanding driven by building renovation programs and renewable energy integration creating constant demand for architectural and industrial coil coating systems.
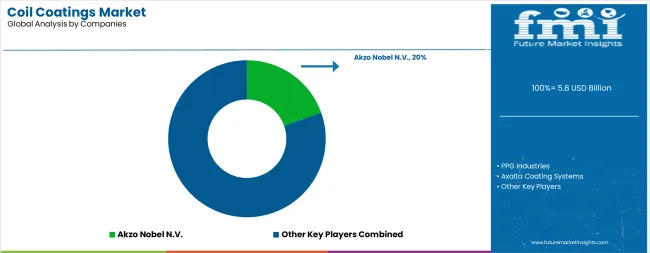
The market is characterized by competition among established coating manufacturers, specialty resin producers, and integrated chemical companies. Companies are investing in environmental technology development, architectural color and texture innovation, digital service platforms, and comprehensive product portfolios to deliver consistent, high-performance, and environmentally compliant coil coating solutions. Innovation in fluoropolymer formulations, low-VOC chemistries, and functional smart coatings is central to strengthening market position and competitive advantage.
Akzo Nobel N.V. leads the market with a strong 20.0% market share, offering comprehensive coil coating solutions including the CERAM-A-STAR and FIDURA systems with focus on architectural applications, textured finishes, and standardized color palettes supporting metal building products globally. The company's recent product launches including textured SMP formulations demonstrate continued innovation leadership and market development capabilities.
PPG Industries provides diversified coil coating technologies including DURANAR and CORAFLON systems for architectural and industrial applications with focus on sustainability and performance. Axalta Coating Systems delivers comprehensive coating solutions including FLUROPON systems for premium architectural applications and transportation coatings.
Beckers Group focuses on sustainable coil coating technologies with recent FutureLab innovation center opening and science-based emissions reduction targets validated by SBTi demonstrating environmental leadership. The Chemours Company specializes in fluoropolymer resins and PVDF coating systems including Tedlar technologies for ultra-durable applications. Sherwin-Williams through its Valspar division offers comprehensive coil coating systems serving building products and industrial applications with extensive color capabilities.
| Items | Values |
|---|---|
| Quantitative Units (2025) | USD 5.8 billion |
| Material Type | Polyester (Silicone-Modified Polyester, Standard Polyester, Super-durable/HD Polyester), Polyurethane, PVDF, Epoxy, Acrylic, PVC/Plastisols, Silicone |
| End Use | Construction (Roofing & Facades, Wall Panels & Cladding, Rainwater Systems/Doors/Shutters, Industrial Buildings & Warehouses), Transportation (Automotive, Trailers/Railcars, Containers), HVAC, Metal Furniture, Appliances/Other |
| Product Type | Topcoats (Polyester Topcoats, PVDF Topcoats, Polyurethane Topcoats, Acrylic Topcoats), Primers, Backing Coats, Others |
| Application Substrate | Steel, Aluminum |
| Regions Covered | North America, Europe, East Asia, South Asia & Pacific, Latin America, Middle East & Africa |
| Countries Covered | United States, Germany, France, United Kingdom, China, Japan, Italy, Spain, South Korea, India, and 40+ countries |
| Key Companies Profiled | Akzo Nobel N.V., PPG Industries, Axalta Coating Systems, Beckers Group, The Chemours Company, and Sherwin-Williams |
| Additional Attributes | Dollar sales by material type, end use, and product type category, regional demand trends, competitive landscape, technological advancements in low-VOC formulations, fluoropolymer systems, textured finishes, and ecofriendly coating technologies |
The global coil coatings market is estimated to be valued at USD 5.8 billion in 2025.
The market size for the coil coatings market is projected to reach USD 9.2 billion by 2035.
The coil coatings market is expected to grow at a 4.7% CAGR between 2025 and 2035.
The key product types in coil coatings market are polyester, polyurethane, pvdf, epoxy, acrylic, pvc/plastisols and silicone.
In terms of end use, construction segment to command 44.0% share in the coil coatings market in 2025.


Our Research Products

The "Full Research Suite" delivers actionable market intel, deep dives on markets or technologies, so clients act faster, cut risk, and unlock growth.

The Leaderboard benchmarks and ranks top vendors, classifying them as Established Leaders, Leading Challengers, or Disruptors & Challengers.

Locates where complements amplify value and substitutes erode it, forecasting net impact by horizon

We deliver granular, decision-grade intel: market sizing, 5-year forecasts, pricing, adoption, usage, revenue, and operational KPIs—plus competitor tracking, regulation, and value chains—across 60 countries broadly.

Spot the shifts before they hit your P&L. We track inflection points, adoption curves, pricing moves, and ecosystem plays to show where demand is heading, why it is changing, and what to do next across high-growth markets and disruptive tech

Real-time reads of user behavior. We track shifting priorities, perceptions of today’s and next-gen services, and provider experience, then pace how fast tech moves from trial to adoption, blending buyer, consumer, and channel inputs with social signals (#WhySwitch, #UX).

Partner with our analyst team to build a custom report designed around your business priorities. From analysing market trends to assessing competitors or crafting bespoke datasets, we tailor insights to your needs.
Supplier Intelligence
Discovery & Profiling
Capacity & Footprint
Performance & Risk
Compliance & Governance
Commercial Readiness
Who Supplies Whom
Scorecards & Shortlists
Playbooks & Docs
Category Intelligence
Definition & Scope
Demand & Use Cases
Cost Drivers
Market Structure
Supply Chain Map
Trade & Policy
Operating Norms
Deliverables
Buyer Intelligence
Account Basics
Spend & Scope
Procurement Model
Vendor Requirements
Terms & Policies
Entry Strategy
Pain Points & Triggers
Outputs
Pricing Analysis
Benchmarks
Trends
Should-Cost
Indexation
Landed Cost
Commercial Terms
Deliverables
Brand Analysis
Positioning & Value Prop
Share & Presence
Customer Evidence
Go-to-Market
Digital & Reputation
Compliance & Trust
KPIs & Gaps
Outputs
Full Research Suite comprises of:
Market outlook & trends analysis
Interviews & case studies
Strategic recommendations
Vendor profiles & capabilities analysis
5-year forecasts
8 regions and 60+ country-level data splits
Market segment data splits
12 months of continuous data updates
DELIVERED AS:
PDF EXCEL ONLINE
Technical Coil Coatings Market Growth 2025 to 2035
Demand for Coil Coatings in EU Size and Share Forecast Outlook 2025 to 2035
Functional Coil Coatings Market Analysis – Size, Share & Forecast 2025 to 2035
Coiled Tubing Market Analysis by Service, Operation, Application and Region Through 2035
Coatings and Application Technologies for Robotics Market Outlook – Trends & Innovations 2025-2035
Coil Assisted Flow Diverters Market – Growth, Demand & Forecast 2025 to 2035
Coil Winding Machine Market Growth – Trends & Forecast 2024 to 2034
Recoilless Disruptor Market Size and Share Forecast Outlook 2025 to 2035
UV Coatings Market Growth & Forecast 2025 to 2035
2K Coatings Market Growth – Trends & Forecast 2025 to 2035
HVAC Coil Coating Market Size and Share Forecast Outlook 2025 to 2035
Acid Coil Cleaner Market Size and Share Forecast Outlook 2025 to 2035
Pipe Coatings Market Size and Share Forecast Outlook 2025 to 2035
Wood Coatings Market Size, Growth, and Forecast for 2025 to 2035
Smart Coatings Market Size and Share Forecast Outlook 2025 to 2035
Metal Coil Lamination Market Size and Share Forecast Outlook 2025 to 2035
Green Coatings Market Analysis by Technology, Application, and Region Forecast through 2035
Marine Coatings Market Size and Share Forecast Outlook 2025 to 2035
Filter Coatings Market Size and Share Forecast Outlook 2025 to 2035
Rubber Coatings Market Growth - Trends & Forecast 2025 to 2035

Thank you!
You will receive an email from our Business Development Manager. Please be sure to check your SPAM/JUNK folder too.
Chat With
MaRIA