Mechanical Coil Tester Market Size, Share, and Forecast Outlook 2025 to 2035

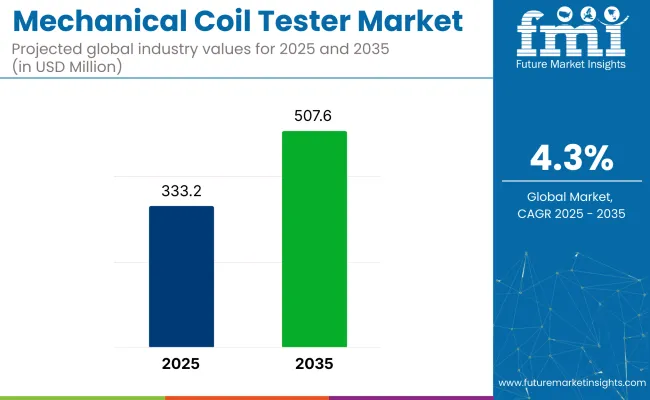
The mechanical coil tester market is expected to reach a valuation of USD 333.2 million in 2025 and USD 507.6 million by 2035 at a CAGR of 4.3% over the forecast period. Mechanical coil testers play a critical role in evaluating the strength, elasticity, and fatigue life of coil springs and similar mechanical components.
Quick Stats for the Mechanical Coil Tester Market

  • Market Value (2025): USD 333.2 million
  • Forecast Value (2035): USD 507.6 million
  • Forecast CAGR (2025 to 2035): 4.3%
  • Leading Segment in 2025: Automotive Sector (45% share)
  • Key Growth Region: Asia Pacific (India)
  • Key Players: ZwickRoell, Qingdao AIP Intelligent Instrument Co., Ltd., ADMET Universal Testing Systems, Blue Star Engineering & Electronics Ltd., Shimadzu Corporation, and Presto Group.

Mechanical Coil Tester Market

As industries such as automotive, aerospace, heavy machinery, and electronics place greater emphasis on quality control and component performance, the demand for precise and reliable testing equipment continues to grow. The industry, while niche, forms an essential component of industrial testing infrastructure globally.

The industry is characterized by ongoing technological improvements, particularly in automation and the digitization of test processes. Mechanical coil testers are increasingly being integrated with digital measurement systems, real-time data analytics, and software-driven control interfaces, allowing for more accurate, repeatable, and efficient testing processes.

These advancements are crucial as manufacturers strive to meet stricter safety and performance standards. Additionally, the adoption of Industry 4.0 practices is encouraging the use of smart testing devices, where mechanical coil testers are networked into broader production and quality assurance systems. As per the NASSCOM report on India Industry 4.0 Adoption, digital technologies are projected to register 40% of total manufacturing expenditure by 2025 as compared to 20% of expenditure in 2021.

A major driver of industry growth is the continued expansion of the automotive sector, where coil springs are critical for suspension systems. As vehicle manufacturers prioritize ride comfort, durability, and performance, they require rigorous testing of spring components under various load conditions. Similarly, in the aerospace industry, the need for lightweight yet high-performance components has led to increased adoption of mechanical coil testers to verify product integrity.

Other contributing factors include the rise of electric vehicles, increased infrastructure development, and greater emphasis on regulatory compliance. As global manufacturing output continues to grow, so too will the need for dependable mechanical coil testing solutions.

Mechanical Coil Tester Market Analyzed by Top Investment Segments

The 50-250 kN load capacity segment dominates the industry due to its versatility and cost-effectiveness for testing various coil springs. Hydraulic drive systems lead the industry because of their precision, durability, and suitability for diverse testing applications, while the automotive sector drives demand with its focus on quality and safety in coil spring testing.

By Load Capacity, 50-250 kN Segment Accounts for Over 28% Industry Share in 2025

The 50-250 kN load capacity is expected to dominate the product segment with a 28% industry share in 2025.
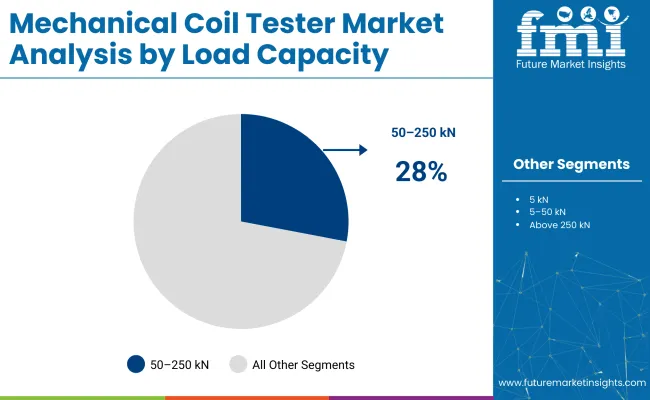
  • The 50-250 kN capacity range is widely used and dominates the industry because it effectively meets the testing requirements of most coil springs and similar mechanical components across various industries. This range provides a balanced combination of strength and versatility, allowing it to handle small to medium-sized springs commonly found in automotive suspensions, aerospace components, and industrial machinery.
  • Testers, within this capacity, are often more cost-efficient and easier to maintain compared to higher-capacity models, making them attractive for manufacturers focused on quality control without excessive investment. Their widespread adoption is further driven by their ability to deliver precise and repeatable results, ensuring components meet stringent safety and performance standards while supporting the demands of high-volume production environments. This makes the 50-250 kN range the optimal choice for many applications, contributing to its dominance in the industry.

Mechanical Coil Tester Market Analysis By Load Capacity

Hydraulic Segment Dominates Drive Type with 36% Share

The hydraulic segment is anticipated to lead the application category with a 46% industry share in 2025, primarily due to its superior power, precision, and reliability in handling a wide range of testing applications.

  • Hydraulic systems provide smooth and consistent force control, which is essential for accurately measuring the strength, elasticity, and fatigue of coil springs and similar components. Their ability to generate high force with fine control makes them suitable for testing both small and large coils under varying load conditions.
  • Hydraulic testers tend to be more durable and require less maintenance compared to other drive types, such as electric or pneumatic systems. This robustness, combined with the flexibility to accommodate diverse testing needs in industries like automotive and aerospace, makes hydraulic drive systems the preferred choice for many manufacturers. Furthermore, hydraulic systems often integrate well with automated and computerized testing setups, enhancing efficiency and repeatability, which further cements their leading position in the industry.

Automotive Sector to be the Major End User with 45% Industry Share

The automotive sector dominates the industry, holding approximately 45% of the total industry share in 2025. This dominance stems from the critical role coil springs play in vehicle suspension systems, which directly impact ride comfort, handling, and safety.
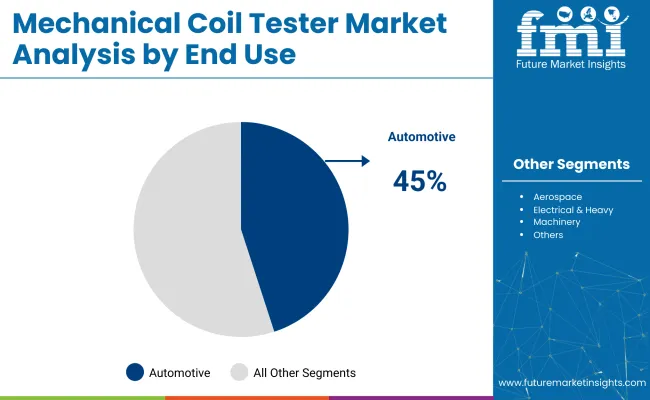
  • As vehicles undergo continuous advancements, especially with the rise of electric vehicles and hybrid models, the demand for high-quality coil springs that meet stringent durability and performance standards increases significantly. To ensure these components can withstand varying stress and fatigue over time, rigorous and precise mechanical coil testing is essential.
  • The automotive industry's commitment to regulatory compliance and enhanced safety features drives manufacturers to invest heavily in advanced testing equipment. This sustained focus on quality assurance, combined with growing vehicle production volumes globally, particularly in emerging industries, solidifies the automotive sector’s position as the primary growth driver for the industry in 2025 and beyond.

Mechanical Coil Tester Market Analysis By End Use

Top Mechanical Coil Tester Market Dynamics

The industry is growing rapidly due to increasing demand from the automotive and aerospace sectors, driven by quality assurance and technological advancements. However, high initial investment and maintenance challenges may slow growth, though emerging industries and innovations in testing methods offer new opportunities.

Rising Product Demand from the Automotive Industry

The industry is primarily driven by increasing demand from the automotive and aerospace industries, where coil springs are critical for suspension and structural components. Rising focus on quality assurance, safety standards, and regulatory compliance compels manufacturers to adopt advanced testing solutions.

Additionally, the growing production of electric and hybrid vehicles is boosting the need for precise and reliable coil testing equipment. Technological advancements such as automation, digitization, and integration with Industry 4.0 are also enhancing testing accuracy and operational efficiency, further fueling industry growth.

High Initial Investment May Hamper Market Growth

Despite steady growth, the industry faces challenges like high initial investment costs for advanced testing systems and the need for skilled operators. Maintenance requirements and calibration complexities can also pose hurdles, especially for small and medium-sized enterprises.

However, emerging markets in Asia-Pacific offer significant opportunities due to expanding manufacturing activities and infrastructure development. Furthermore, increasing adoption of non-destructive testing methods and AI-powered analytics presents new avenues for innovation, enabling manufacturers to improve testing speed, reduce errors, and optimize product quality.

Analyzing Top Countries Manufacturing, Distributing, and Supplying Mechanical Coil Testers

The industry study identifies key trends across major countries, including the United States, China, India, Japan, and Germany. Manufacturers in these regions can align strategies around automation, evolving quality standards, and rising demand from the automotive and aerospace sectors to boost dollar sales, share, and product innovation.
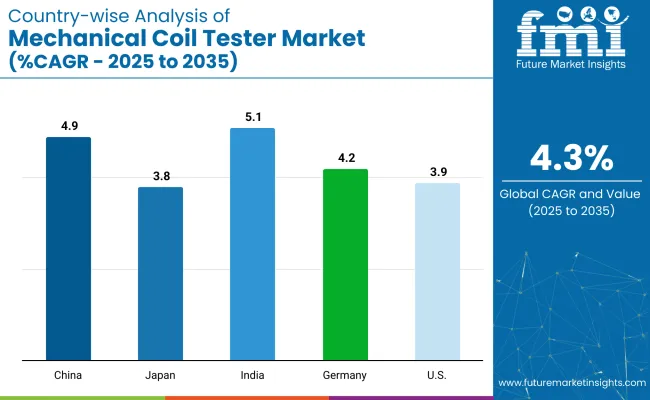
Country Wise Anlysis Of Mechanical Coil Tester Market Cagr 2025 To 2035

Countries CAGR (2025 to 2035)
China 4.9%
Japan 3.8%
India 5.1%
Germany 4.2%
United States 3.9%

In-depth Analysis of the United States Mechanical Coil Tester Market

The United States industry is estimated to grow at a 3.9% CAGR during the study period.

  • The growth is largely supported by the country’s well-established automotive and aerospace industries, which require stringent quality control measures to ensure the durability and safety of coil springs used in various applications.
  • The increasing integration of Industry 4.0 technologies, such as automation, IoT, and data analytics, is driving manufacturers to adopt more precise and automated mechanical coil testers.

China Mechanical Coil Tester Market Analysis

The industry in China is projected to grow at a 4.9% CAGR between 2025 and 2035.

  • China’s rapid industrialization and the expansion of its automotive manufacturing sector play significant roles in driving this industry growth. The country is one of the largest producers of automobiles and heavy machinery, which rely heavily on coil springs that must be tested rigorously to meet both domestic and international quality standards.
  • Rising vehicle production, the government’s push toward infrastructure development, is fueling demand for robust testing equipment to ensure the reliability of critical components.

India Mechanical Coil Tester Market Growth and Trends

The industry in India is expected to witness a 5.1% CAGR during the forecast period.

  • Robust growth is primarily driven by India’s rapidly expanding automotive and heavy machinery sectors, which are experiencing significant investment and modernization. The country is witnessing a surge in electric vehicle production, which necessitates advanced coil testing to ensure the performance and safety of newly designed suspension components.
  • India’s favorable policies toward foreign direct investment are encouraging global manufacturers to establish production facilities domestically, increasing the demand for precise testing equipment.

Mechanical Coil Tester Market Growth in Japan

The industry in Japan is anticipated to grow at a 3.8% CAGR from 2025 to 2035.

  • Renowned for its precision manufacturing capabilities, Japan’s automotive and electronics industries are key drivers of the demand for highly accurate mechanical coil testers. Japanese manufacturers emphasize continuous innovation and quality improvement, which requires advanced testing equipment capable of delivering precise and repeatable results.
  • The country’s strict regulatory framework ensures that all components, including coil springs, comply with rigorous safety and performance standards, leading to widespread adoption of sophisticated testing systems.

Analysis of Sales of Mechanical Coil Testers in Germany

The industry in Germany is estimated to expand at a 4.2% CAGR during the study period.

  • As a global leader in automotive engineering and industrial manufacturing, Germany maintains demanding quality and safety standards that necessitate comprehensive coil testing. The country hosts numerous original equipment manufacturers (OEMs) and suppliers who continuously invest in cutting-edge testing technologies to uphold their reputation for precision and reliability.
  • Germany’s commitment to Industry 4.0 and the integration of automation within manufacturing plants further enhances the need for efficient and accurate mechanical coil testers.

Leading Mechanical Coil Tester Market Suppliers

Leading Company -ZwickRoell Market Share-25%

The industry features a competitive landscape with dominant players, key players, and emerging players. Dominant players like ZwickRoell, Qingdao AIP Intelligent Instrument Co., Ltd., and ADMET Universal Testing Systems lead the industry with high-precision testing technologies, versatile testing solutions, and strong global distribution networks across industries like automotive, aerospace, and manufacturing.

Key players such as Blue Star Engineering & Electronics Ltd., Shimadzu Corporation, and Presto Group provide specialized testing equipment for various industrial applications and focus on regional and specific industry needs. Emerging players, including Siward Crystal Technology Co., Ltd., offer cost-effective and innovative testing solutions for niche applications and smaller industries.

Recent Mechanical Coil Tester Market Development

In March 2025, Shimadzu Scientific Instruments opened a new R&D center in Boston, focusing on customer-oriented development to expand business in the pharmaceutical field.

Report Scope - Mechanical Coil Tester Market

Report Attributes Details
Industry Size (2025) USD 333.2 million
Projected Industry Size (2035) USD 507.6 million
CAGR (2025 to 2035) 4.3%
Base Year for Estimation 2024
Historical Period 2020 to 2024
Projections Period 2025 to 2035
Quantitative Units USD million for value and units
Load Capacity Analyzed (Segment 1) Up to 5 kN , 5 - 50 kN , 50 - 250 kN , and above 250 kN
Drive Type Analyzed (Segment 2) Electromechanical, Hydraulic, And Servo-Electric
End Use Analyzed (Segment 3) Automotive, Aerospace, Electrical & Heavy Machinery, Electronics & Appliances, Research & Certification Labs, And Other Manufacturing
Regions Covered North America, Europe, Asia Pacific, Latin America, Middle East & Africa
Countries Covered United States, Canada, Germany, United Kingdom, France, Italy, Spain, China, India, Japan, South Korea, Australia, Brazil, Mexico, Argentina, Saudi Arabia, UAE, South Africa
Key Players Influencing the Industry ZwickRoell , Qingdao AIP Intelligent Instrument Co., Ltd., ADMET Universal Testing Systems, Blue Star Engineering & Electronics Ltd., Shimadzu Corporation, and Presto Group.
Additional Attributes Dollar sales, share, pricing trends, and regulatory impacts.

Key Mechanical Coil Tester Market Players

  • ZwickRoell
  • Qingdao AIP Intelligent Instrument Co., Ltd.
  • ADMET Universal Testing Systems
  • Blue Star Engineering & Electronics Ltd.
  • Shimadzu Corporation
  • Presto Group
  • Siward Crystal Technology Co., Ltd.

Key Segments Studied in the Mechanical Coil Tester Market

By Load Capacity:

In terms of load capacity, the industry is classified into Up to 5 kN, 5-50 kN, 50-250 kN, and above 250 kN.

By Drive Type:

With respect to drive type, the industry is divided into electromechanical, hydraulic, and servo-electric.

By End Use:

In terms of end use, the industry is classified into automotive, aerospace, electrical & heavy machinery, electronics & appliances, research & certification labs, and other manufacturing.

By Region:

From the regional standpoint, the industry is segregated into Latin America, Asia Pacific, the Middle East & Africa, North America, and Europe.

Table of Content

  1. Executive Summary
    • Global Market Outlook
    • Demand-side Trends
    • Supply-side Trends
    • Technology Roadmap Analysis
    • Analysis and Recommendations
  2. Market Overview
    • Market Coverage / Taxonomy
    • Market Definition / Scope / Limitations
  3. Market Background
    • Market Dynamics
      • Drivers
      • Restraints
      • Opportunity
      • Trends
    • Scenario Forecast
      • Demand in Optimistic Scenario
      • Demand in Likely Scenario
      • Demand in Conservative Scenario
    • Opportunity Map Analysis
    • Product Life Cycle Analysis
    • Supply Chain Analysis
      • Supply Side Participants and their Roles
        • Producers
        • Mid-Level Participants (Traders/ Agents/ Brokers)
        • Wholesalers and Distributors
      • Value Added and Value Created at Node in the Supply Chain
      • List of Raw Material Suppliers
      • List of Existing and Potential Buyer’s
    • Investment Feasibility Matrix
    • Value Chain Analysis
      • Profit Margin Analysis
      • Wholesalers and Distributors
      • Retailers
    • PESTLE and Porter’s Analysis
    • Regulatory Landscape
      • By Key Regions
      • By Key Countries
    • Regional Parent Market Outlook
    • Production and Consumption Statistics
    • Import and Export Statistics
  4. Global Market Analysis 2020 to 2024 and Forecast, 2025 to 2035
    • Historical Market Size Value (USD Million) & Volume (Units) Analysis, 2020 to 2024
    • Current and Future Market Size Value (USD Million) & Volume (Units) Projections, 2025 to 2035
      • Y-o-Y Growth Trend Analysis
      • Absolute $ Opportunity Analysis
  5. Global Market Pricing Analysis 2020 to 2024 and Forecast 2025 to 2035
  6. Global Market Analysis 2020 to 2024 and Forecast 2025 to 2035, By Load Capacity
    • Introduction / Key Findings
    • Historical Market Size Value (USD Million) & Volume (Units) Analysis By Load Capacity, 2020 to 2024
    • Current and Future Market Size Value (USD Million) & Volume (Units) Analysis and Forecast By Load Capacity, 2025 to 2035
      • Up to 5 kN
      • 5-50 kN
      • 50-250 kN
      • Above 250 kN
    • Y-o-Y Growth Trend Analysis By Load Capacity, 2020 to 2024
    • Absolute $ Opportunity Analysis By Load Capacity, 2025 to 2035
  7. Global Market Analysis 2020 to 2024 and Forecast 2025 to 2035, By Drive Type
    • Introduction / Key Findings
    • Historical Market Size Value (USD Million) & Volume (Units) Analysis By Drive Type, 2020 to 2024
    • Current and Future Market Size Value (USD Million) & Volume (Units) Analysis and Forecast By Drive Type, 2025 to 2035
      • Electromechanical
      • Hydraulic
      • Servo Electric
    • Y-o-Y Growth Trend Analysis By Drive Type, 2020 to 2024
    • Absolute $ Opportunity Analysis By Drive Type, 2025 to 2035
  8. Global Market Analysis 2020 to 2024 and Forecast 2025 to 2035, By End Use
    • Introduction / Key Findings
    • Historical Market Size Value (USD Million) & Volume (Units) Analysis By End Use, 2020 to 2024
    • Current and Future Market Size Value (USD Million) & Volume (Units) Analysis and Forecast By End Use, 2025 to 2035
      • Automotive
      • Aerospace
      • Electrical & Heavy Machinery
      • Electronics & Appliances
      • Research & Certification Labs
      • Other Manufacturing
    • Y-o-Y Growth Trend Analysis By End Use, 2020 to 2024
    • Absolute $ Opportunity Analysis By End Use, 2025 to 2035
  9. Global Market Analysis 2020 to 2024 and Forecast 2025 to 2035, By Region
    • Introduction
    • Historical Market Size Value (USD Million) & Volume (Units) Analysis By Region, 2020 to 2024
    • Current Market Size Value (USD Million) & Volume (Units) Analysis and Forecast By Region, 2025 to 2035
      • North America
      • Latin America
      • Western Europe
      • Eastern Europe
      • East Asia
      • South Asia & Pacific
      • Middle East and Africa
    • Market Attractiveness Analysis By Region
  10. North America Market Analysis 2020 to 2024 and Forecast 2025 to 2035, By Country
    • Historical Market Size Value (USD Million) & Volume (Units) Trend Analysis By Market Taxonomy, 2020 to 2024
    • Market Size Value (USD Million) & Volume (Units) Forecast By Market Taxonomy, 2025 to 2035
      • By Country
        • USA
        • Canada
        • Mexico
      • By Load Capacity
      • By Drive Type
      • By End Use
    • Market Attractiveness Analysis
      • By Country
      • By Load Capacity
      • By Drive Type
      • By End Use
    • Key Takeaways
  11. Latin America Market Analysis 2020 to 2024 and Forecast 2025 to 2035, By Country
    • Historical Market Size Value (USD Million) & Volume (Units) Trend Analysis By Market Taxonomy, 2020 to 2024
    • Market Size Value (USD Million) & Volume (Units) Forecast By Market Taxonomy, 2025 to 2035
      • By Country
        • Brazil
        • Argentina
        • Rest of LATAM
      • By Load Capacity
      • By Drive Type
      • By End Use
    • Market Attractiveness Analysis
      • By Country
      • By Load Capacity
      • By Drive Type
      • By End Use
    • Key Takeaways
  12. Western Europe Market Analysis 2020 to 2024 and Forecast 2025 to 2035, By Country
    • Historical Market Size Value (USD Million) & Volume (Units) Trend Analysis By Market Taxonomy, 2020 to 2024
    • Market Size Value (USD Million) & Volume (Units) Forecast By Market Taxonomy, 2025 to 2035
      • By Country
        • Germany
        • Italy
        • France
        • UK
        • Spain
        • BENELUX
        • Nordic
        • Rest of W. Europe
      • By Load Capacity
      • By Drive Type
      • By End Use
    • Market Attractiveness Analysis
      • By Country
      • By Load Capacity
      • By Drive Type
      • By End Use
    • Key Takeaways
  13. Eastern Europe Market Analysis 2020 to 2024 and Forecast 2025 to 2035, By Country
    • Historical Market Size Value (USD Million) & Volume (Units) Trend Analysis By Market Taxonomy, 2020 to 2024
    • Market Size Value (USD Million) & Volume (Units) Forecast By Market Taxonomy, 2025 to 2035
      • By Country
        • Russia
        • Hungary
        • Poland
        • Balkan & Baltics
        • Rest of E. Europe
      • By Load Capacity
      • By Drive Type
      • By End Use
    • Market Attractiveness Analysis
      • By Country
      • By Load Capacity
      • By Drive Type
      • By End Use
    • Key Takeaways
  14. East Asia Market Analysis 2020 to 2024 and Forecast 2025 to 2035, By Country
    • Historical Market Size Value (USD Million) & Volume (Units) Trend Analysis By Market Taxonomy, 2020 to 2024
    • Market Size Value (USD Million) & Volume (Units) Forecast By Market Taxonomy, 2025 to 2035
      • By Country
        • China
        • Japan
        • South Korea
      • By Load Capacity
      • By Drive Type
      • By End Use
    • Market Attractiveness Analysis
      • By Country
      • By Load Capacity
      • By Drive Type
      • By End Use
    • Key Takeaways
  15. South Asia & Pacific Market Analysis 2020 to 2024 and Forecast 2025 to 2035, By Country
    • Historical Market Size Value (USD Million) & Volume (Units) Trend Analysis By Market Taxonomy, 2020 to 2024
    • Market Size Value (USD Million) & Volume (Units) Forecast By Market Taxonomy, 2025 to 2035
      • By Country
        • India
        • Australia & New Zealand
        • ASEAN
        • Rest of SAP
      • By Load Capacity
      • By Drive Type
      • By End Use
    • Market Attractiveness Analysis
      • By Country
      • By Load Capacity
      • By Drive Type
      • By End Use
    • Key Takeaways
  16. Middle East and Africa Market Analysis 2020 to 2024 and Forecast 2025 to 2035, By Country
    • Historical Market Size Value (USD Million) & Volume (Units) Trend Analysis By Market Taxonomy, 2020 to 2024
    • Market Size Value (USD Million) & Volume (Units) Forecast By Market Taxonomy, 2025 to 2035
      • By Country
        • GCC Countries
        • Northern Africa
        • South Africa
        • Turkiye
        • Rest of MEA
      • By Load Capacity
      • By Drive Type
      • By End Use
    • Market Attractiveness Analysis
      • By Country
      • By Load Capacity
      • By Drive Type
      • By End Use
    • Key Takeaways
  17. Key Countries Market Analysis
    • USA
      • Pricing Analysis
      • Market Share Analysis, 2024
        • By Load Capacity
        • By Drive Type
        • By End Use
    • Canada
      • Pricing Analysis
      • Market Share Analysis, 2024
        • By Load Capacity
        • By Drive Type
        • By End Use
    • Brazil
      • Pricing Analysis
      • Market Share Analysis, 2024
        • By Load Capacity
        • By Drive Type
        • By End Use
    • Mexico
      • Pricing Analysis
      • Market Share Analysis, 2024
        • By Load Capacity
        • By Drive Type
        • By End Use
    • Argentina
      • Pricing Analysis
      • Market Share Analysis, 2024
        • By Load Capacity
        • By Drive Type
        • By End Use
  18. Market Structure Analysis
    • Competition Dashboard
    • Competition Benchmarking
    • Market Share Analysis of Top Players
      • By Regional
      • By Load Capacity
      • By Drive Type
      • By End Use
  19. Competition Analysis
    • Competition Deep Dive
      • ZwickRoell
        • Overview
        • Product Portfolio
        • Profitability by Market Segments (Product/Age /Sales Channel/Region)
        • Sales Footprint
        • Strategy Overview
          • Marketing Strategy
          • Product Strategy
          • Channel Strategy
      • Qingdao AIP Intelligent Instrument Co., Ltd.
        • Overview
        • Product Portfolio
        • Profitability by Market Segments (Product/Age /Sales Channel/Region)
        • Sales Footprint
        • Strategy Overview
          • Marketing Strategy
          • Product Strategy
          • Channel Strategy
      • ADMET Universal Testing Systems
        • Overview
        • Product Portfolio
        • Profitability by Market Segments (Product/Age /Sales Channel/Region)
        • Sales Footprint
        • Strategy Overview
          • Marketing Strategy
          • Product Strategy
          • Channel Strategy
      • Blue Star Engineering & Electronics Ltd.
        • Overview
        • Product Portfolio
        • Profitability by Market Segments (Product/Age /Sales Channel/Region)
        • Sales Footprint
        • Strategy Overview
          • Marketing Strategy
          • Product Strategy
          • Channel Strategy
      • Shimadzu Corporation
        • Overview
        • Product Portfolio
        • Profitability by Market Segments (Product/Age /Sales Channel/Region)
        • Sales Footprint
        • Strategy Overview
          • Marketing Strategy
          • Product Strategy
          • Channel Strategy
      • Presto Group
        • Overview
        • Product Portfolio
        • Profitability by Market Segments (Product/Age /Sales Channel/Region)
        • Sales Footprint
        • Strategy Overview
          • Marketing Strategy
          • Product Strategy
          • Channel Strategy
  20. Assumptions & Acronyms Used
  21. Research Methodology

List of Tables

  • Table 1: Global Market Value (USD Million) Forecast by Region, 2020 to 2035
  • Table 2: Global Market Volume (Units) Forecast by Region, 2020 to 2035
  • Table 3: Global Market Value (USD Million) Forecast by Load Capacity, 2020 to 2035
  • Table 4: Global Market Volume (Units) Forecast by Load Capacity, 2020 to 2035
  • Table 5: Global Market Value (USD Million) Forecast by Drive Type, 2020 to 2035
  • Table 6: Global Market Volume (Units) Forecast by Drive Type, 2020 to 2035
  • Table 7: Global Market Value (USD Million) Forecast by End Use, 2020 to 2035
  • Table 8: Global Market Volume (Units) Forecast by End Use, 2020 to 2035
  • Table 9: North America Market Value (USD Million) Forecast by Country, 2020 to 2035
  • Table 10: North America Market Volume (Units) Forecast by Country, 2020 to 2035
  • Table 11: North America Market Value (USD Million) Forecast by Load Capacity, 2020 to 2035
  • Table 12: North America Market Volume (Units) Forecast by Load Capacity, 2020 to 2035
  • Table 13: North America Market Value (USD Million) Forecast by Drive Type, 2020 to 2035
  • Table 14: North America Market Volume (Units) Forecast by Drive Type, 2020 to 2035
  • Table 15: North America Market Value (USD Million) Forecast by End Use, 2020 to 2035
  • Table 16: North America Market Volume (Units) Forecast by End Use, 2020 to 2035
  • Table 17: Latin America Market Value (USD Million) Forecast by Country, 2020 to 2035
  • Table 18: Latin America Market Volume (Units) Forecast by Country, 2020 to 2035
  • Table 19: Latin America Market Value (USD Million) Forecast by Load Capacity, 2020 to 2035
  • Table 20: Latin America Market Volume (Units) Forecast by Load Capacity, 2020 to 2035
  • Table 21: Latin America Market Value (USD Million) Forecast by Drive Type, 2020 to 2035
  • Table 22: Latin America Market Volume (Units) Forecast by Drive Type, 2020 to 2035
  • Table 23: Latin America Market Value (USD Million) Forecast by End Use, 2020 to 2035
  • Table 24: Latin America Market Volume (Units) Forecast by End Use, 2020 to 2035
  • Table 25: Western Europe Market Value (USD Million) Forecast by Country, 2020 to 2035
  • Table 26: Western Europe Market Volume (Units) Forecast by Country, 2020 to 2035
  • Table 27: Western Europe Market Value (USD Million) Forecast by Load Capacity, 2020 to 2035
  • Table 28: Western Europe Market Volume (Units) Forecast by Load Capacity, 2020 to 2035
  • Table 29: Western Europe Market Value (USD Million) Forecast by Drive Type, 2020 to 2035
  • Table 30: Western Europe Market Volume (Units) Forecast by Drive Type, 2020 to 2035
  • Table 31: Western Europe Market Value (USD Million) Forecast by End Use, 2020 to 2035
  • Table 32: Western Europe Market Volume (Units) Forecast by End Use, 2020 to 2035
  • Table 33: Eastern Europe Market Value (USD Million) Forecast by Country, 2020 to 2035
  • Table 34: Eastern Europe Market Volume (Units) Forecast by Country, 2020 to 2035
  • Table 35: Eastern Europe Market Value (USD Million) Forecast by Load Capacity, 2020 to 2035
  • Table 36: Eastern Europe Market Volume (Units) Forecast by Load Capacity, 2020 to 2035
  • Table 37: Eastern Europe Market Value (USD Million) Forecast by Drive Type, 2020 to 2035
  • Table 38: Eastern Europe Market Volume (Units) Forecast by Drive Type, 2020 to 2035
  • Table 39: Eastern Europe Market Value (USD Million) Forecast by End Use, 2020 to 2035
  • Table 40: Eastern Europe Market Volume (Units) Forecast by End Use, 2020 to 2035
  • Table 41: East Asia Market Value (USD Million) Forecast by Country, 2020 to 2035
  • Table 42: East Asia Market Volume (Units) Forecast by Country, 2020 to 2035
  • Table 43: East Asia Market Value (USD Million) Forecast by Load Capacity, 2020 to 2035
  • Table 44: East Asia Market Volume (Units) Forecast by Load Capacity, 2020 to 2035
  • Table 45: East Asia Market Value (USD Million) Forecast by Drive Type, 2020 to 2035
  • Table 46: East Asia Market Volume (Units) Forecast by Drive Type, 2020 to 2035
  • Table 47: East Asia Market Value (USD Million) Forecast by End Use, 2020 to 2035
  • Table 48: East Asia Market Volume (Units) Forecast by End Use, 2020 to 2035
  • Table 49: South Asia & Pacific Market Value (USD Million) Forecast by Country, 2020 to 2035
  • Table 50: South Asia & Pacific Market Volume (Units) Forecast by Country, 2020 to 2035
  • Table 51: South Asia & Pacific Market Value (USD Million) Forecast by Load Capacity, 2020 to 2035
  • Table 52: South Asia & Pacific Market Volume (Units) Forecast by Load Capacity, 2020 to 2035
  • Table 53: South Asia & Pacific Market Value (USD Million) Forecast by Drive Type, 2020 to 2035
  • Table 54: South Asia & Pacific Market Volume (Units) Forecast by Drive Type, 2020 to 2035
  • Table 55: South Asia & Pacific Market Value (USD Million) Forecast by End Use, 2020 to 2035
  • Table 56: South Asia & Pacific Market Volume (Units) Forecast by End Use, 2020 to 2035
  • Table 57: Middle East and Africa Market Value (USD Million) Forecast by Country, 2020 to 2035
  • Table 58: Middle East and Africa Market Volume (Units) Forecast by Country, 2020 to 2035
  • Table 59: Middle East and Africa Market Value (USD Million) Forecast by Load Capacity, 2020 to 2035
  • Table 60: Middle East and Africa Market Volume (Units) Forecast by Load Capacity, 2020 to 2035
  • Table 61: Middle East and Africa Market Value (USD Million) Forecast by Drive Type, 2020 to 2035
  • Table 62: Middle East and Africa Market Volume (Units) Forecast by Drive Type, 2020 to 2035
  • Table 63: Middle East and Africa Market Value (USD Million) Forecast by End Use, 2020 to 2035
  • Table 64: Middle East and Africa Market Volume (Units) Forecast by End Use, 2020 to 2035

List of Figures

  • Figure 1: Global Market Volume (Units) Forecast 2020 to 2035
  • Figure 2: Global Market Pricing Analysis
  • Figure 3: Global Market Value (USD Million) Forecast 2020 to 2035
  • Figure 4: Global Market Value Share and BPS Analysis by Load Capacity, 2025 and 2035
  • Figure 5: Global Market Y-o-Y Growth Comparison by Load Capacity, 2025 to 2035
  • Figure 6: Global Market Attractiveness Analysis by Load Capacity
  • Figure 7: Global Market Value Share and BPS Analysis by Drive Type, 2025 and 2035
  • Figure 8: Global Market Y-o-Y Growth Comparison by Drive Type, 2025 to 2035
  • Figure 9: Global Market Attractiveness Analysis by Drive Type
  • Figure 10: Global Market Value Share and BPS Analysis by End Use, 2025 and 2035
  • Figure 11: Global Market Y-o-Y Growth Comparison by End Use, 2025 to 2035
  • Figure 12: Global Market Attractiveness Analysis by End Use
  • Figure 13: Global Market Value (USD Million) Share and BPS Analysis by Region, 2025 and 2035
  • Figure 14: Global Market Y-o-Y Growth Comparison by Region, 2025 to 2035
  • Figure 15: Global Market Attractiveness Analysis by Region
  • Figure 16: North America Market Incremental $ Opportunity, 2025 to 2035
  • Figure 17: Latin America Market Incremental $ Opportunity, 2025 to 2035
  • Figure 18: Western Europe Market Incremental $ Opportunity, 2025 to 2035
  • Figure 19: Eastern Europe Market Incremental $ Opportunity, 2025 to 2035
  • Figure 20: East Asia Market Incremental $ Opportunity, 2025 to 2035
  • Figure 21: South Asia & Pacific Market Incremental $ Opportunity, 2025 to 2035
  • Figure 22: Middle East and Africa Market Incremental $ Opportunity, 2025 to 2035
  • Figure 23: North America Market Value Share and BPS Analysis by Country, 2025 and 2035
  • Figure 24: North America Market Value Share and BPS Analysis by Load Capacity, 2025 and 2035
  • Figure 25: North America Market Y-o-Y Growth Comparison by Load Capacity, 2025 to 2035
  • Figure 26: North America Market Attractiveness Analysis by Load Capacity
  • Figure 27: North America Market Value Share and BPS Analysis by Drive Type, 2025 and 2035
  • Figure 28: North America Market Y-o-Y Growth Comparison by Drive Type, 2025 to 2035
  • Figure 29: North America Market Attractiveness Analysis by Drive Type
  • Figure 30: North America Market Value Share and BPS Analysis by End Use, 2025 and 2035
  • Figure 31: North America Market Y-o-Y Growth Comparison by End Use, 2025 to 2035
  • Figure 32: North America Market Attractiveness Analysis by End Use
  • Figure 33: Latin America Market Value Share and BPS Analysis by Country, 2025 and 2035
  • Figure 34: Latin America Market Value Share and BPS Analysis by Load Capacity, 2025 and 2035
  • Figure 35: Latin America Market Y-o-Y Growth Comparison by Load Capacity, 2025 to 2035
  • Figure 36: Latin America Market Attractiveness Analysis by Load Capacity
  • Figure 37: Latin America Market Value Share and BPS Analysis by Drive Type, 2025 and 2035
  • Figure 38: Latin America Market Y-o-Y Growth Comparison by Drive Type, 2025 to 2035
  • Figure 39: Latin America Market Attractiveness Analysis by Drive Type
  • Figure 40: Latin America Market Value Share and BPS Analysis by End Use, 2025 and 2035
  • Figure 41: Latin America Market Y-o-Y Growth Comparison by End Use, 2025 to 2035
  • Figure 42: Latin America Market Attractiveness Analysis by End Use
  • Figure 43: Western Europe Market Value Share and BPS Analysis by Country, 2025 and 2035
  • Figure 44: Western Europe Market Value Share and BPS Analysis by Load Capacity, 2025 and 2035
  • Figure 45: Western Europe Market Y-o-Y Growth Comparison by Load Capacity, 2025 to 2035
  • Figure 46: Western Europe Market Attractiveness Analysis by Load Capacity
  • Figure 47: Western Europe Market Value Share and BPS Analysis by Drive Type, 2025 and 2035
  • Figure 48: Western Europe Market Y-o-Y Growth Comparison by Drive Type, 2025 to 2035
  • Figure 49: Western Europe Market Attractiveness Analysis by Drive Type
  • Figure 50: Western Europe Market Value Share and BPS Analysis by End Use, 2025 and 2035
  • Figure 51: Western Europe Market Y-o-Y Growth Comparison by End Use, 2025 to 2035
  • Figure 52: Western Europe Market Attractiveness Analysis by End Use
  • Figure 53: Eastern Europe Market Value Share and BPS Analysis by Country, 2025 and 2035
  • Figure 54: Eastern Europe Market Value Share and BPS Analysis by Load Capacity, 2025 and 2035
  • Figure 55: Eastern Europe Market Y-o-Y Growth Comparison by Load Capacity, 2025 to 2035
  • Figure 56: Eastern Europe Market Attractiveness Analysis by Load Capacity
  • Figure 57: Eastern Europe Market Value Share and BPS Analysis by Drive Type, 2025 and 2035
  • Figure 58: Eastern Europe Market Y-o-Y Growth Comparison by Drive Type, 2025 to 2035
  • Figure 59: Eastern Europe Market Attractiveness Analysis by Drive Type
  • Figure 60: Eastern Europe Market Value Share and BPS Analysis by End Use, 2025 and 2035
  • Figure 61: Eastern Europe Market Y-o-Y Growth Comparison by End Use, 2025 to 2035
  • Figure 62: Eastern Europe Market Attractiveness Analysis by End Use
  • Figure 63: East Asia Market Value Share and BPS Analysis by Country, 2025 and 2035
  • Figure 64: East Asia Market Value Share and BPS Analysis by Load Capacity, 2025 and 2035
  • Figure 65: East Asia Market Y-o-Y Growth Comparison by Load Capacity, 2025 to 2035
  • Figure 66: East Asia Market Attractiveness Analysis by Load Capacity
  • Figure 67: East Asia Market Value Share and BPS Analysis by Drive Type, 2025 and 2035
  • Figure 68: East Asia Market Y-o-Y Growth Comparison by Drive Type, 2025 to 2035
  • Figure 69: East Asia Market Attractiveness Analysis by Drive Type
  • Figure 70: East Asia Market Value Share and BPS Analysis by End Use, 2025 and 2035
  • Figure 71: East Asia Market Y-o-Y Growth Comparison by End Use, 2025 to 2035
  • Figure 72: East Asia Market Attractiveness Analysis by End Use
  • Figure 73: South Asia & Pacific Market Value Share and BPS Analysis by Country, 2025 and 2035
  • Figure 74: South Asia & Pacific Market Value Share and BPS Analysis by Load Capacity, 2025 and 2035
  • Figure 75: South Asia & Pacific Market Y-o-Y Growth Comparison by Load Capacity, 2025 to 2035
  • Figure 76: South Asia & Pacific Market Attractiveness Analysis by Load Capacity
  • Figure 77: South Asia & Pacific Market Value Share and BPS Analysis by Drive Type, 2025 and 2035
  • Figure 78: South Asia & Pacific Market Y-o-Y Growth Comparison by Drive Type, 2025 to 2035
  • Figure 79: South Asia & Pacific Market Attractiveness Analysis by Drive Type
  • Figure 80: South Asia & Pacific Market Value Share and BPS Analysis by End Use, 2025 and 2035
  • Figure 81: South Asia & Pacific Market Y-o-Y Growth Comparison by End Use, 2025 to 2035
  • Figure 82: South Asia & Pacific Market Attractiveness Analysis by End Use
  • Figure 83: Middle East and Africa Market Value Share and BPS Analysis by Country, 2025 and 2035
  • Figure 84: Middle East and Africa Market Value Share and BPS Analysis by Load Capacity, 2025 and 2035
  • Figure 85: Middle East and Africa Market Y-o-Y Growth Comparison by Load Capacity, 2025 to 2035
  • Figure 86: Middle East and Africa Market Attractiveness Analysis by Load Capacity
  • Figure 87: Middle East and Africa Market Value Share and BPS Analysis by Drive Type, 2025 and 2035
  • Figure 88: Middle East and Africa Market Y-o-Y Growth Comparison by Drive Type, 2025 to 2035
  • Figure 89: Middle East and Africa Market Attractiveness Analysis by Drive Type
  • Figure 90: Middle East and Africa Market Value Share and BPS Analysis by End Use, 2025 and 2035
  • Figure 91: Middle East and Africa Market Y-o-Y Growth Comparison by End Use, 2025 to 2035
  • Figure 92: Middle East and Africa Market Attractiveness Analysis by End Use
  • Figure 93: Global Market - Tier Structure Analysis
  • Figure 94: Global Market - Company Share Analysis

Frequently Asked Questions

What is the estimated size of the mechanical coil tester market in 2025?

The industry is valued at USD 333.2 million in 2025.

What is the projected value of the mechanical coil tester by 2035?

The industry is forecast to reach USD 507.6 million by 2035.

Who is the leading company in the mechanical coil tester market?

ZwickRoell is the leading player in the industry with a 25% market share.

What is the expected CAGR of the mechanical coil tester market from 2025 to 2035?

The industry is projected to grow at a CAGR of 4.3%.

Which end-user segment holds the largest share in the mechanical coil tester market?

The automotive sector holds 45% industry share in 2025.

Explore Testing Apparatus Insights

Future Market Insights

Mechanical Coil Tester Market