Mechanical Testing Equipment Market (2022-2032)

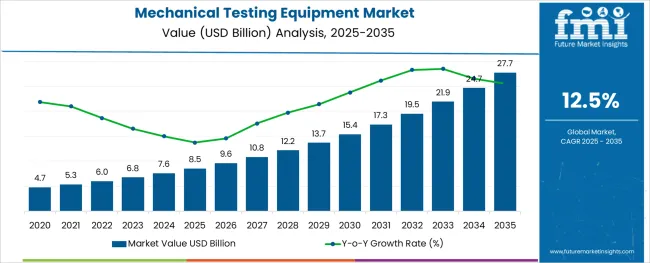
[250 Pages Report] The global mechanical testing equipment market is estimated total US$ 6 Bn by 2022, projecting growth at a remarkable CAGR of around 12% to 13% during the forecast period 2022-2032. The sales of mechanical testing equipment are expected to exceed US$ 7 Bn by the end of 2032, in comparison to the US$ 5.8 Bn registered in the year 2021.

Report Attribute Details
Mechanical Testing Equipment Market Value (2021) US$ 5.8 Billion
Mechanical Testing Equipment Market Estimated Value (2022) US$ 6 Billion
Mechanical Testing Equipment Market Anticipated Value (2032) US$ 7 Billion
Mechanical Testing Equipment Market Projected Growth Rate (2022 to 2032) 12% to 13% CAGR

Mechanical testing equipments are machines used to assess the mechanical properties of different materials. These machines are used during mechanical testing for measuring aspects such as breaking point, tensile strength, adhesion, compression strength, and others.

Mechanical tests use torsion, tension, vibrations, drop (shock), and shearing forces among others on samples and are generally conducted in quality testing laboratories using mechanical testing instruments such as universal testing machines.

Don't pay for what you don't need

Customize your report by selecting specific countries or regions and save 30%!

Which are Some Prominent Drivers Spearheading Mechanical Testing Equipment Market Growth

As the trend of industrialization continues to create deeper inroad, a substantial rise in manufacturer activities is being witnessed, especially across emerging economies such as China, India, Australia, Brazil, and others. With rising rate of production, it is becoming crucial for manufacturers to integrate mechanical testing equipments in manufacturing processes to maintain and control the quality of the products.

Physical and mechanical tests are of great importance for the purpose of quality control in manufacturing industries as well as assess the product damage after accidents. Thus, growing adoption of quality control and quality assurance process across the industrial manufacturing sector is estimated to create high revenue generation opportunities in the global market.

What are the Challenges Faced by the Mechanical Testing Equipment Market

Extravagant initial cost of mechanical testing equipments, high installation cost, and high cost of maintenance are the factors hindering the sales in the market. In addition to this, need for skilled professionals and stringent regulations & standards for mechanical testing across various countries are restraining the growth in the global market.
Nikhil Kaitwade
Nikhil Kaitwade

Principal Consultant

Talk to Analyst

Find your sweet spots for generating winning opportunities in this market.

Why is Asia Pacific Excluding Japan Emerging as an Opportunistic Mechanical Testing Equipment Market

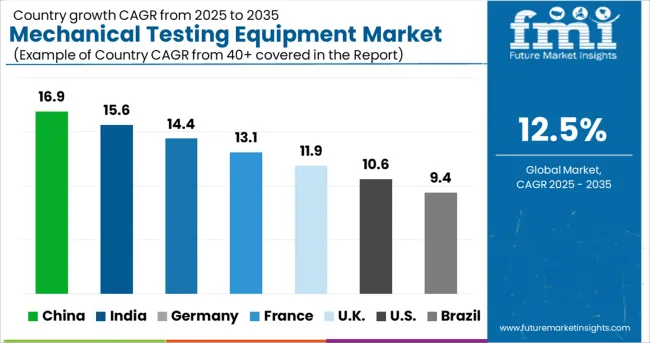
FMI reveals that Asia Pacific excluding Japan is estimated to emerge as the most lucrative market for mechanical testing equipment during the forecast period 2022-2032.

Due to the surging trend of urbanization and growing emphasis on sustainable infrastructure developments, a rapid surge in building and construction activities is being witnessed across Asia Pacific. Hence, governments in several countries are aiming on undertaking numerous initiatives for urbanizing rural areas and constructing smart cities.

For instance, according to a study by the India Brand Equity Foundation, the Indian Government announced allocating around US$ 868 Mn under the country’s Smart City Mission to build more than 100 smart cities across India for the period 2021-2022. As mechanical testing equipment plays a critical role in testing the durability, strength, and safety of material used in building activities, such rise in construction activities will bolster the sales in the market.
How is North America Contributing to the Growth of the Chemical Analyzer Market

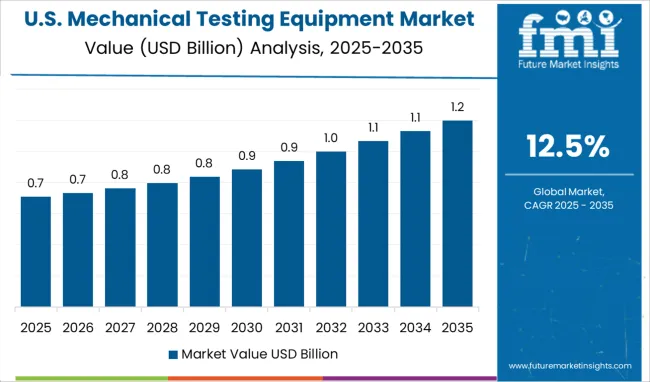
As per Future Market Insights, North America is expected to account for a significant share in the global mechanical testing equipment market between 2022 and 2032.

Mechanical testing equipment is finding a wide array of usages in the manufacturing industry for various applications ranging from determining the strength of a bridge to the elasticity of a rubber band.

These equipments are increasingly gaining popularity for the testing of packaging materials for food & beverages, industrial goods, medical & pharmaceutical products, and others. They are extensively used in testing various parameters such as elasticity, flexibility, rigidity, adhesion shock, vibration, tensile, and shear tests of packaging solutions. This is expected to favor the demand for mechanical testing equipments in the North America market.
Get the data you need at a Fraction of the cost

Personalize your report by choosing insights you need
and save 40%!

Market Competition

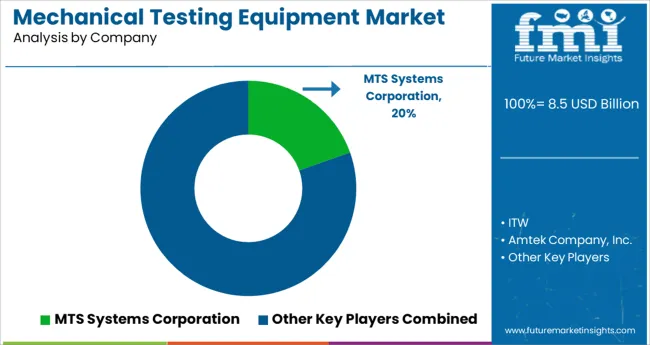
Some of the leading players in the mechanical testing equipment market are Torontech Group International, AMETEK, Shimadzu, Applied Test Systems, Hegewald & Peschke, INSTRON, Zwick/ Roell, MTS Systems, and others.

The market is highly competitive attributed to the presence of such a large number of participants and increasing adoption of product launch and collaboration, partnership, and acquisition strategies.

Scope of Report

Report Attribute Details
Growth Rate CAGR of 12% to 13% from 2022 to 2032
Base Year for Estimation 2021
Historical Data 2015 to 2020
Forecast Period 2022 to 2032
Quantitative Units Revenue in USD Million and CAGR from 2022 to 2032
Report Coverage Revenue Forecast, Volume Forecast, Company Ranking, Competitive Landscape, Growth Factors, Trends and Pricing Analysis
Segments Covered

Equipment Type, End Use, Region

Countries Covered North America, Latin America, Europe, CIS & Russia, APEJ, Japan, Middle East and Africa
Key Companies Profiled

Torontech Group International; AMETEK; Shimadzu; Applied Test Systems; Hegewald & Peschke; INSTRON; Zwick/ Roell; MTS Systems; Others

Customization Available Upon Request

Key Segments Profiled in the Mechanical Testing Equipment Market Survey

By Equipment Type:

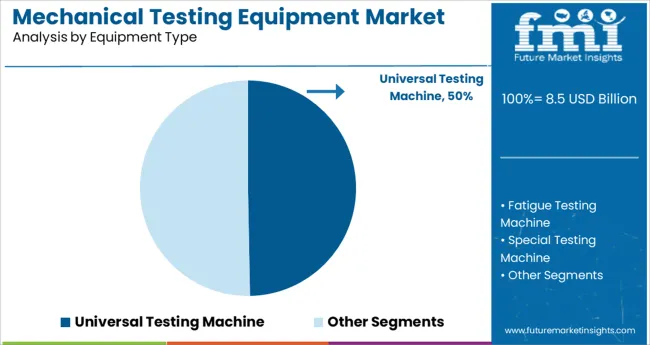
  • Universal Testing Machine
  • Fatigue Testing Machine
  • Special Testing Machine

By End Use:

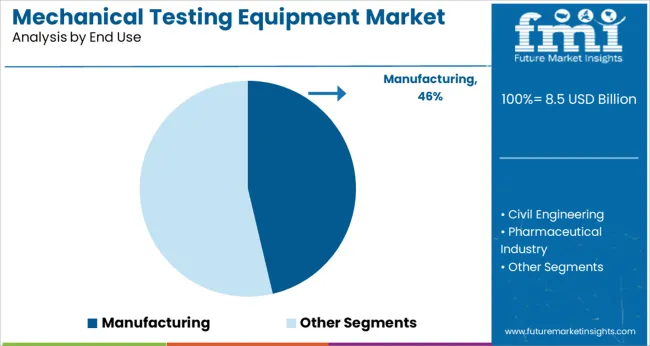
  • Manufacturing
  • Civil Engineering
  • Pharmaceutical Industry
  • Scientific Institutions
  • Others

By Region:

  • North America
  • Latin America
  • Europe
  • CIS & Russia
  • APEJ
  • Japan
  • Middle East and Africa

Frequently Asked Questions

How is the Mechanical Testing Equipment Market Growing?

The mechanical testing equipment market is predicted to grow at 12.1% CAGR through 2032.

Which Region Holds the Highest Revenue Potential in the Mechanical Testing Equipment Market?

Asia Pacific mechanical testing equipment market holds the highest revenue potential.

What is the Future Scope of Growth for the Mechanical Testing Equipment Market?

The mechanical testing equipment market is expected to surpass US$ 7 Bn by 2032

What is the Current Mechanical Testing Equipment Market Size?

The mechanical testing equipment market size is anticipated to be over US$ 6 Bn in 2022.

Table of Content
1. Executive Summary

    1.1. Global Market Outlook

    1.2. Demand-side Trends

    1.3. Supply-side Trends

    1.4. Technology Roadmap Analysis

    1.5. Analysis and Recommendations

2. Market Overview

    2.1. Market Coverage / Taxonomy

    2.2. Market Definition / Scope / Limitations

3. Market Background

    3.1. Market Dynamics

        3.1.1. Drivers

        3.1.2. Restraints

        3.1.3. Opportunity

        3.1.4. Trends

    3.2. Scenario Forecast

        3.2.1. Demand in Optimistic Scenario

        3.2.2. Demand in Likely Scenario

        3.2.3. Demand in Conservative Scenario

    3.3. Opportunity Map Analysis

    3.4. Product Life Cycle Analysis

    3.5. Supply Chain Analysis

        3.5.1. Supply Side Participants and their Roles

            3.5.1.1. Producers

            3.5.1.2. Mid-Level Participants (Traders/ Agents/ Brokers)

            3.5.1.3. Wholesalers and Distributors

        3.5.2. Value Added and Value Created at Node in the Supply Chain

        3.5.3. List of Raw Material Suppliers

        3.5.4. List of Existing and Potential Buyer’s

    3.6. Investment Feasibility Matrix

    3.7. Value Chain Analysis

        3.7.1. Profit Margin Analysis

        3.7.2. Wholesalers and Distributors

        3.7.3. Retailers

    3.8. PESTLE and Porter’s Analysis

    3.9. Regulatory Landscape

        3.9.1. By Key Regions

        3.9.2. By Key Countries

    3.10. Regional Parent Market Outlook

    3.11. Production and Consumption Statistics

    3.12. Import and Export Statistics

4. Global Mechanical Testing Equipment Market Analysis 2017-2021 and Forecast, 2022-2032

    4.1. Historical Market Size Value (US$ Mn) & Volume (Units) Analysis, 2017-2021

    4.2. Current and Future Market Size Value (US$ Mn) & Volume (Units) Projections, 2022-2032

        4.2.1. Y-o-Y Growth Trend Analysis

        4.2.2. Absolute $ Opportunity Analysis

5. Global Mechanical Testing Equipment Market Analysis 2017-2021 and Forecast 2022-2032, By Equipment Type

    5.1. Introduction / Key Findings

    5.2. Historical Market Size Value (US$ Mn) & Volume (Units) Analysis By Equipment Type, 2017-2021

    5.3. Current and Future Market Size Value (US$ Mn) & Volume (Units) Analysis and Forecast By Equipment Type, 2022-2032

        5.3.1. Fatigue Testing Machine

        5.3.2. Universal Testing Machine

        5.3.3. Bend Testing Machine

        5.3.4. Torsion Testing Machine

        5.3.5. Compression Testing Machine

    5.4. Y-o-Y Growth Trend Analysis By Equipment Type, 2017-2021

    5.5. Absolute $ Opportunity Analysis By Equipment Type, 2022-2032

Deep-dive segmentation will be available in the sample on request

6. Global Mechanical Testing Equipment Market Analysis 2017-2021 and Forecast 2022-2032, By Application

    6.1. Introduction / Key Findings

    6.2. Historical Market Size Value (US$ Mn) & Volume (Units) Analysis By Application, 2017-2021

    6.3. Current and Future Market Size Value (US$ Mn) & Volume (Units) Analysis and Forecast By Application, 2022-2032

        6.3.1. Tensile Strength & Stress rupture

        6.3.2. Elongation& Ductility test

        6.3.3. Hardness

        6.3.4. Impact resistance

        6.3.5. Elasticity

        6.3.6. Fracture toughness

        6.3.7. Fatigue limit

        6.3.8. Compression test

        6.3.9. Shear

    6.4. Y-o-Y Growth Trend Analysis By Application, 2017-2021

    6.5. Absolute $ Opportunity Analysis By Application, 2022-2032

Deep-dive segmentation will be available in the sample on request

7. Global Mechanical Testing Equipment Market Analysis 2017-2021 and Forecast 2022-2032, By Technology

    7.1. Introduction / Key Findings

    7.2. Historical Market Size Value (US$ Mn) & Volume (Units) Analysis By Technology, 2017-2021

    7.3. Current and Future Market Size Value (US$ Mn) & Volume (Units) Analysis and Forecast By Technology, 2022-2032

        7.3.1. Hydraulic

        7.3.2. Electro Mechanical

    7.4. Y-o-Y Growth Trend Analysis By Technology, 2017-2021

    7.5. Absolute $ Opportunity Analysis By Technology, 2022-2032

Deep-dive segmentation will be available in the sample on request

8. Global Mechanical Testing Equipment Market Analysis 2017-2021 and Forecast 2022-2032, By End Use

    8.1. Introduction / Key Findings

    8.2. Historical Market Size Value (US$ Mn) & Volume (Units) Analysis By End Use, 2017-2021

    8.3. Current and Future Market Size Value (US$ Mn) & Volume (Units) Analysis and Forecast By End Use, 2022-2032

        8.3.1. Testing & Certification Agencies

        8.3.2. General Manufacturing

        8.3.3. Automotive & Transportation

        8.3.4. Heavy Engineering

        8.3.5. Oil & Gas

        8.3.6. Water Utilities

        8.3.7. Construction & Civil engineering

        8.3.8. Material Science

    8.4. Y-o-Y Growth Trend Analysis By End Use, 2017-2021

    8.5. Absolute $ Opportunity Analysis By End Use, 2022-2032

Deep-dive segmentation will be available in the sample on request

9. Global Mechanical Testing Equipment Market Analysis 2017-2021 and Forecast 2022-2032, By Region

    9.1. Introduction

    9.2. Historical Market Size Value (US$ Mn) & Volume (Units) Analysis By Region, 2017-2021

    9.3. Current Market Size Value (US$ Mn) & Volume (Units) Analysis and Forecast By Region, 2022-2032

        9.3.1. North America

        9.3.2. Latin America

        9.3.3. Europe

        9.3.4. East Asia

        9.3.5. South Asia & Pacific

        9.3.6. MEA

    9.4. Market Attractiveness Analysis By Region

10. North America Mechanical Testing Equipment Market Analysis 2017-2021 and Forecast 2022-2032, By Country

    10.1. Historical Market Size Value (US$ Mn) & Volume (Units) Trend Analysis By Market Taxonomy, 2017-2021

    10.2. Market Size Value (US$ Mn) & Volume (Units) Forecast By Market Taxonomy, 2022-2032

        10.2.1. By Country

            10.2.1.1. U.S.

            10.2.1.2. Canada

        10.2.2. By Equipment Type

        10.2.3. By Application

        10.2.4. By Technology

        10.2.5. By End Use

    10.3. Market Attractiveness Analysis

        10.3.1. By Country

        10.3.2. By Equipment Type

        10.3.3. By Application

        10.3.4. By Technology

        10.3.5. By End Use

    10.4. Key Takeaways

11. Latin America Mechanical Testing Equipment Market Analysis 2017-2021 and Forecast 2022-2032, By Country

    11.1. Historical Market Size Value (US$ Mn) & Volume (Units) Trend Analysis By Market Taxonomy, 2017-2021

    11.2. Market Size Value (US$ Mn) & Volume (Units) Forecast By Market Taxonomy, 2022-2032

        11.2.1. By Country

            11.2.1.1. Mexico

            11.2.1.2. Brazil

            11.2.1.3. Rest of Latin America

        11.2.2. By Equipment Type

        11.2.3. By Application

        11.2.4. By Technology

        11.2.5. By End Use

    11.3. Market Attractiveness Analysis

        11.3.1. By Country

        11.3.2. By Equipment Type

        11.3.3. By Application

        11.3.4. By Technology

        11.3.5. By End Use

    11.4. Key Takeaways

12. Europe Mechanical Testing Equipment Market Analysis 2017-2021 and Forecast 2022-2032, By Country

    12.1. Historical Market Size Value (US$ Mn) & Volume (Units) Trend Analysis By Market Taxonomy, 2017-2021

    12.2. Market Size Value (US$ Mn) & Volume (Units) Forecast By Market Taxonomy, 2022-2032

        12.2.1. By Country

            12.2.1.1. Germany

            12.2.1.2. Italy

            12.2.1.3. France

            12.2.1.4. U.K.

            12.2.1.5. Spain

            12.2.1.6. BENELUX

            12.2.1.7. Russia

            12.2.1.8. Rest of Europe

        12.2.2. By Equipment Type

        12.2.3. By Application

        12.2.4. By Technology

        12.2.5. By End Use

    12.3. Market Attractiveness Analysis

        12.3.1. By Country

        12.3.2. By Equipment Type

        12.3.3. By Application

        12.3.4. By Technology

        12.3.5. By End Use

    12.4. Key Takeaways

13. East Asia Mechanical Testing Equipment Market Analysis 2017-2021 and Forecast 2022-2032, By Country

    13.1. Historical Market Size Value (US$ Mn) & Volume (Units) Trend Analysis By Market Taxonomy, 2017-2021

    13.2. Market Size Value (US$ Mn) & Volume (Units) Forecast By Market Taxonomy, 2022-2032

        13.2.1. By Country

            13.2.1.1. China

            13.2.1.2. Japan

            13.2.1.3. South Korea

        13.2.2. By Equipment Type

        13.2.3. By Application

        13.2.4. By Technology

        13.2.5. By End Use

    13.3. Market Attractiveness Analysis

        13.3.1. By Country

        13.3.2. By Equipment Type

        13.3.3. By Application

        13.3.4. By Technology

        13.3.5. By End Use

    13.4. Key Takeaways

14. South Asia & Pacific Mechanical Testing Equipment Market Analysis 2017-2021 and Forecast 2022-2032, By Country

    14.1. Historical Market Size Value (US$ Mn) & Volume (Units) Trend Analysis By Market Taxonomy, 2017-2021

    14.2. Market Size Value (US$ Mn) & Volume (Units) Forecast By Market Taxonomy, 2022-2032

        14.2.1. By Country

            14.2.1.1. India

            14.2.1.2. ASEAN

            14.2.1.3. Australia and New Zealand

            14.2.1.4. Rest of South Asia & Pacific

        14.2.2. By Equipment Type

        14.2.3. By Application

        14.2.4. By Technology

        14.2.5. By End Use

    14.3. Market Attractiveness Analysis

        14.3.1. By Country

        14.3.2. By Equipment Type

        14.3.3. By Application

        14.3.4. By Technology

        14.3.5. By End Use

    14.4. Key Takeaways

15. MEA Mechanical Testing Equipment Market Analysis 2017-2021 and Forecast 2022-2032, By Country

    15.1. Historical Market Size Value (US$ Mn) & Volume (Units) Trend Analysis By Market Taxonomy, 2017-2021

    15.2. Market Size Value (US$ Mn) & Volume (Units) Forecast By Market Taxonomy, 2022-2032

        15.2.1. By Country

            15.2.1.1. GCC Countries

            15.2.1.2. Turkey

            15.2.1.3. South Africa

            15.2.1.4. Rest of MEA

        15.2.2. By Equipment Type

        15.2.3. By Application

        15.2.4. By Technology

        15.2.5. By End Use

    15.3. Market Attractiveness Analysis

        15.3.1. By Country

        15.3.2. By Equipment Type

        15.3.3. By Application

        15.3.4. By Technology

        15.3.5. By End Use

    15.4. Key Takeaways

16. Key Countries Mechanical Testing Equipment Market Analysis

    16.1. U.S.

        16.1.1. Pricing Analysis

        16.1.2. Market Share Analysis, 2021

            16.1.2.1. By Equipment Type

            16.1.2.2. By Application

            16.1.2.3. By Technology

            16.1.2.4. By End Use

    16.2. Canada

        16.2.1. Pricing Analysis

        16.2.2. Market Share Analysis, 2021

            16.2.2.1. By Equipment Type

            16.2.2.2. By Application

            16.2.2.3. By Technology

            16.2.2.4. By End Use

    16.3. Mexico

        16.3.1. Pricing Analysis

        16.3.2. Market Share Analysis, 2021

            16.3.2.1. By Equipment Type

            16.3.2.2. By Application

            16.3.2.3. By Technology

            16.3.2.4. By End Use

    16.4. Brazil

        16.4.1. Pricing Analysis

        16.4.2. Market Share Analysis, 2021

            16.4.2.1. By Equipment Type

            16.4.2.2. By Application

            16.4.2.3. By Technology

            16.4.2.4. By End Use

    16.5. Germany

        16.5.1. Pricing Analysis

        16.5.2. Market Share Analysis, 2021

            16.5.2.1. By Equipment Type

            16.5.2.2. By Application

            16.5.2.3. By Technology

            16.5.2.4. By End Use

    16.6. Italy

        16.6.1. Pricing Analysis

        16.6.2. Market Share Analysis, 2021

            16.6.2.1. By Equipment Type

            16.6.2.2. By Application

            16.6.2.3. By Technology

            16.6.2.4. By End Use

    16.7. France

        16.7.1. Pricing Analysis

        16.7.2. Market Share Analysis, 2021

            16.7.2.1. By Equipment Type

            16.7.2.2. By Application

            16.7.2.3. By Technology

            16.7.2.4. By End Use

    16.8. U.K.

        16.8.1. Pricing Analysis

        16.8.2. Market Share Analysis, 2021

            16.8.2.1. By Equipment Type

            16.8.2.2. By Application

            16.8.2.3. By Technology

            16.8.2.4. By End Use

    16.9. Spain

        16.9.1. Pricing Analysis

        16.9.2. Market Share Analysis, 2021

            16.9.2.1. By Equipment Type

            16.9.2.2. By Application

            16.9.2.3. By Technology

            16.9.2.4. By End Use

    16.10. BENELUX

        16.10.1. Pricing Analysis

        16.10.2. Market Share Analysis, 2021

            16.10.2.1. By Equipment Type

            16.10.2.2. By Application

            16.10.2.3. By Technology

            16.10.2.4. By End Use

    16.11. Russia

        16.11.1. Pricing Analysis

        16.11.2. Market Share Analysis, 2021

            16.11.2.1. By Equipment Type

            16.11.2.2. By Application

            16.11.2.3. By Technology

            16.11.2.4. By End Use

    16.12. China

        16.12.1. Pricing Analysis

        16.12.2. Market Share Analysis, 2021

            16.12.2.1. By Equipment Type

            16.12.2.2. By Application

            16.12.2.3. By Technology

            16.12.2.4. By End Use

    16.13. Japan

        16.13.1. Pricing Analysis

        16.13.2. Market Share Analysis, 2021

            16.13.2.1. By Equipment Type

            16.13.2.2. By Application

            16.13.2.3. By Technology

            16.13.2.4. By End Use

    16.14. South Korea

        16.14.1. Pricing Analysis

        16.14.2. Market Share Analysis, 2021

            16.14.2.1. By Equipment Type

            16.14.2.2. By Application

            16.14.2.3. By Technology

            16.14.2.4. By End Use

    16.15. India

        16.15.1. Pricing Analysis

        16.15.2. Market Share Analysis, 2021

            16.15.2.1. By Equipment Type

            16.15.2.2. By Application

            16.15.2.3. By Technology

            16.15.2.4. By End Use

    16.16. ASEAN

        16.16.1. Pricing Analysis

        16.16.2. Market Share Analysis, 2021

            16.16.2.1. By Equipment Type

            16.16.2.2. By Application

            16.16.2.3. By Technology

            16.16.2.4. By End Use

    16.17. Australia and New Zealand

        16.17.1. Pricing Analysis

        16.17.2. Market Share Analysis, 2021

            16.17.2.1. By Equipment Type

            16.17.2.2. By Application

            16.17.2.3. By Technology

            16.17.2.4. By End Use

    16.18. GCC Countries

        16.18.1. Pricing Analysis

        16.18.2. Market Share Analysis, 2021

            16.18.2.1. By Equipment Type

            16.18.2.2. By Application

            16.18.2.3. By Technology

            16.18.2.4. By End Use

    16.19. Turkey

        16.19.1. Pricing Analysis

        16.19.2. Market Share Analysis, 2021

            16.19.2.1. By Equipment Type

            16.19.2.2. By Application

            16.19.2.3. By Technology

            16.19.2.4. By End Use

    16.20. South Africa

        16.20.1. Pricing Analysis

        16.20.2. Market Share Analysis, 2021

            16.20.2.1. By Equipment Type

            16.20.2.2. By Application

            16.20.2.3. By Technology

            16.20.2.4. By End Use

17. Market Structure Analysis

    17.1. Competition Dashboard

    17.2. Competition Benchmarking

    17.3. Market Share Analysis of Top Players

        17.3.1. By Regional

        17.3.2. By Equipment Type

        17.3.3. By Application

        17.3.4. By Technology

        17.3.5. By End Use

18. Competition Analysis

    18.1. Competition Deep Dive

        18.1.1. MTS Systems Corporation

            18.1.1.1. Overview

            18.1.1.2. Product Portfolio

            18.1.1.3. Profitability by Market Segments

            18.1.1.4. Sales Footprint

            18.1.1.5. Strategy Overview

                18.1.1.5.1. Marketing Strategy

                18.1.1.5.2. Product Strategy

                18.1.1.5.3. Channel Strategy

        18.1.2. ITW

            18.1.2.1. Overview

            18.1.2.2. Product Portfolio

            18.1.2.3. Profitability by Market Segments

            18.1.2.4. Sales Footprint

            18.1.2.5. Strategy Overview

                18.1.2.5.1. Marketing Strategy

                18.1.2.5.2. Product Strategy

                18.1.2.5.3. Channel Strategy

        18.1.3. Amtek Company, Inc.

            18.1.3.1. Overview

            18.1.3.2. Product Portfolio

            18.1.3.3. Profitability by Market Segments

            18.1.3.4. Sales Footprint

            18.1.3.5. Strategy Overview

                18.1.3.5.1. Marketing Strategy

                18.1.3.5.2. Product Strategy

                18.1.3.5.3. Channel Strategy

        18.1.4. Emerson 

            18.1.4.1. Overview

            18.1.4.2. Product Portfolio

            18.1.4.3. Profitability by Market Segments

            18.1.4.4. Sales Footprint

            18.1.4.5. Strategy Overview

                18.1.4.5.1. Marketing Strategy

                18.1.4.5.2. Product Strategy

                18.1.4.5.3. Channel Strategy

        18.1.5. Shimadzu

            18.1.5.1. Overview

            18.1.5.2. Product Portfolio

            18.1.5.3. Profitability by Market Segments

            18.1.5.4. Sales Footprint

            18.1.5.5. Strategy Overview

                18.1.5.5.1. Marketing Strategy

                18.1.5.5.2. Product Strategy

                18.1.5.5.3. Channel Strategy

        18.1.6. Zwick Roell

            18.1.6.1. Overview

            18.1.6.2. Product Portfolio

            18.1.6.3. Profitability by Market Segments

            18.1.6.4. Sales Footprint

            18.1.6.5. Strategy Overview

                18.1.6.5.1. Marketing Strategy

                18.1.6.5.2. Product Strategy

                18.1.6.5.3. Channel Strategy

        18.1.7. Buehler

            18.1.7.1. Overview

            18.1.7.2. Product Portfolio

            18.1.7.3. Profitability by Market Segments

            18.1.7.4. Sales Footprint

            18.1.7.5. Strategy Overview

                18.1.7.5.1. Marketing Strategy

                18.1.7.5.2. Product Strategy

                18.1.7.5.3. Channel Strategy

        18.1.8. PCE Holding GmbH

            18.1.8.1. Overview

            18.1.8.2. Product Portfolio

            18.1.8.3. Profitability by Market Segments

            18.1.8.4. Sales Footprint

            18.1.8.5. Strategy Overview

                18.1.8.5.1. Marketing Strategy

                18.1.8.5.2. Product Strategy

                18.1.8.5.3. Channel Strategy

        18.1.9. Labortech s.r.o.

            18.1.9.1. Overview

            18.1.9.2. Product Portfolio

            18.1.9.3. Profitability by Market Segments

            18.1.9.4. Sales Footprint

            18.1.9.5. Strategy Overview

                18.1.9.5.1. Marketing Strategy

                18.1.9.5.2. Product Strategy

                18.1.9.5.3. Channel Strategy

        18.1.10. Tinius Olsen Ltd

            18.1.10.1. Overview

            18.1.10.2. Product Portfolio

            18.1.10.3. Profitability by Market Segments

            18.1.10.4. Sales Footprint

            18.1.10.5. Strategy Overview

                18.1.10.5.1. Marketing Strategy

                18.1.10.5.2. Product Strategy

                18.1.10.5.3. Channel Strategy

        18.1.11. Hegewald & Peschke

            18.1.11.1. Overview

            18.1.11.2. Product Portfolio

            18.1.11.3. Profitability by Market Segments

            18.1.11.4. Sales Footprint

            18.1.11.5. Strategy Overview

                18.1.11.5.1. Marketing Strategy

                18.1.11.5.2. Product Strategy

                18.1.11.5.3. Channel Strategy

        18.1.12. TA Instruments

            18.1.12.1. Overview

            18.1.12.2. Product Portfolio

            18.1.12.3. Profitability by Market Segments

            18.1.12.4. Sales Footprint

            18.1.12.5. Strategy Overview

                18.1.12.5.1. Marketing Strategy

                18.1.12.5.2. Product Strategy

                18.1.12.5.3. Channel Strategy

        18.1.13. Applied Test Systems

            18.1.13.1. Overview

            18.1.13.2. Product Portfolio

            18.1.13.3. Profitability by Market Segments

            18.1.13.4. Sales Footprint

            18.1.13.5. Strategy Overview

                18.1.13.5.1. Marketing Strategy

                18.1.13.5.2. Product Strategy

                18.1.13.5.3. Channel Strategy

        18.1.14. Hung Ta Instrument

            18.1.14.1. Overview

            18.1.14.2. Product Portfolio

            18.1.14.3. Profitability by Market Segments

            18.1.14.4. Sales Footprint

            18.1.14.5. Strategy Overview

                18.1.14.5.1. Marketing Strategy

                18.1.14.5.2. Product Strategy

                18.1.14.5.3. Channel Strategy

        18.1.15. Cometech Testing Machines Co., Ltd.

            18.1.15.1. Overview

            18.1.15.2. Product Portfolio

            18.1.15.3. Profitability by Market Segments

            18.1.15.4. Sales Footprint

            18.1.15.5. Strategy Overview

                18.1.15.5.1. Marketing Strategy

                18.1.15.5.2. Product Strategy

                18.1.15.5.3. Channel Strategy

        18.1.16. Blue Star Limited

            18.1.16.1. Overview

            18.1.16.2. Product Portfolio

            18.1.16.3. Profitability by Market Segments

            18.1.16.4. Sales Footprint

            18.1.16.5. Strategy Overview

                18.1.16.5.1. Marketing Strategy

                18.1.16.5.2. Product Strategy

                18.1.16.5.3. Channel Strategy

        18.1.17. AIMIL Ltd.

            18.1.17.1. Overview

            18.1.17.2. Product Portfolio

            18.1.17.3. Profitability by Market Segments

            18.1.17.4. Sales Footprint

            18.1.17.5. Strategy Overview

                18.1.17.5.1. Marketing Strategy

                18.1.17.5.2. Product Strategy

                18.1.17.5.3. Channel Strategy

        18.1.18. A&D Company Limited

            18.1.18.1. Overview

            18.1.18.2. Product Portfolio

            18.1.18.3. Profitability by Market Segments

            18.1.18.4. Sales Footprint

            18.1.18.5. Strategy Overview

                18.1.18.5.1. Marketing Strategy

                18.1.18.5.2. Product Strategy

                18.1.18.5.3. Channel Strategy

19. Assumptions & Acronyms Used

20. Research Methodology
Recommendations

Testing Equipment

Soil Field Testing Equipment Market

January 2019

REP-GB-8165

February 2023

345 pages

Explore Testing Equipment Insights

View Reports
Future Market Insights

Mechanical Testing Equipment Market