Mechanical Locks Market Size, Share, and Forecast Outlook 2025 to 2035

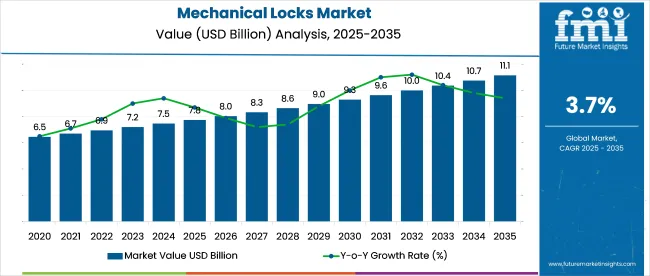
Global mechanical lock market is forecast to increase from USD 7.75 billion in 2025 to USD 11.15 billion by 2035, at a 3.7% CAGR. North America is expected to retain the largest revenue share, but higher growth momentum is being recorded in Southeast Asia, Eastern Europe, and parts of Latin America.
Quick Stats of the Mechanical Locks Market

  • Industry Value (2025): USD 7.75 billion
  • Forecast Value (2035): USD 11.15 billion
  • Global CAGR (2025 to 2035): 3.7%
  • Leading Segment in 2025: Deadbolt (~41.3% share)
  • Key Growth Region: GCC (5.1% CAGR)
  • Key Players: Assa Abloy AB, Allegion plc, Dormakaba Holding AG, Spectrum Brands Holdings, Inc., Stanley Black & Decker, Inc.

Mechanical Locks Market Market Value Analysis

Metric Value
Industry Size (2025E) USD 7.75 billion
Industry Value (2035F) USD 11.15 billion
CAGR (2025 to 2035) 3.7%

Over 210 million new residential units across BRICS and ASEAN are projected to adopt mechanical or hybrid locking systems by 2030, driven by policy-backed housing and lower per-unit installation costs. Production capacity in India, Vietnam, and Poland is being raised by 12% by 2027 to meet expanding regional demand. 38% of new lock SKUs introduced in 2024 offer compatibility with digital upgrades.

On June 3, 2025, Allegion plc announced the acquisition of Nova Hardware Pty Ltd (Novas), a premium architectural door hardware manufacturer based in Victoria, Australia. Novas specializes in mechanical and electronic locks, closers, hinges, and master keying systems for multifamily and commercial sectors.

The acquisition strengthens Allegion’s footprint in the Australian market and aligns with its international growth strategy. Novas will operate under Allegion International, with its founder, Todd Foster, joining in an advisory role. The deal excludes Novas’ kitchen and bathroom business, which will be retained as a separate entity. Terms of the acquisition were not disclosed.

The mechanical locks market occupies different levels of importance across its parent segments. It holds approximately 41% of the door hardware market due to its core role in latch and lock assemblies. In physical security equipment, its share stands near 17%, reduced by the presence of surveillance and biometric systems.

Within access control, it captures about 11%, primarily from hybrid lock applications. Its contribution to the building products and materials segment is around 6%, and just 4% in the residential and commercial construction market, where locks form a smaller fraction of structural investments relative to roofing, flooring, or insulation.

Analyzing Mechanical Locks Market by Top Investment Segments

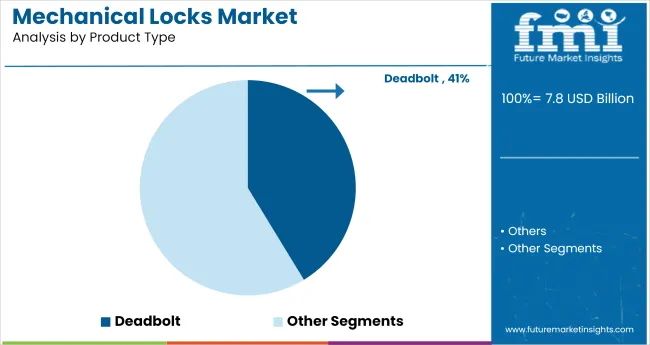
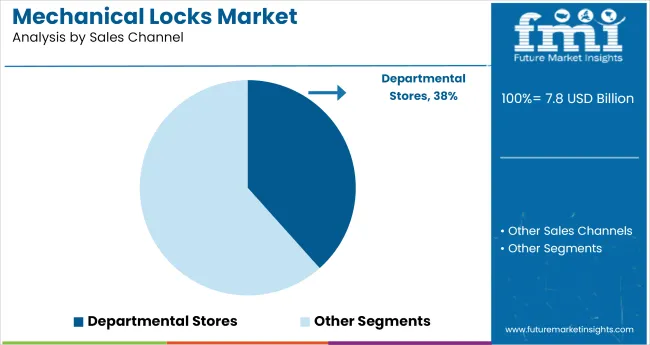
The market is segmented by product type, sales channel, and region. Deadbolts are projected to dominate the product type segment, capturing 41.3% share in 2025. Departmental stores are expected to lead the sales channel segment, holding a 38.6% share.

Strong growth is expected in regions like North America, Western Europe, and East Asia, driven by security concerns and rising construction activities. Other regions such as Latin America, South Asia & Pacific, and the Middle East & Africa are also anticipated to witness steady growth.
Dominance of Deadbolt Product Segment

Mechanical Locks Market Analysis By Product Type

The deadbolt product segment is expected to capture 41.3% share in 2025. Deadbolts are widely used for both residential and commercial security due to their robust ability to prevent forced entry. Their popularity is driven by their simplicity, effectiveness, and relatively low cost compared to electronic alternatives.

Companies like ASSA ABLOY, Schlage, and Kwikset are key players, offering various models designed to meet the needs of different applications, from high-security areas to standard residential use. The deadbolt’s effectiveness and durability in high-security environments continue to drive its demand, particularly in regions with increasing security concerns.
  • Increasing demand for high-security locking solutions in commercial applications
  • Growing preference for affordable and durable locks.
  • Ongoing innovation in deadbolt designs for enhanced security and ease of use

Departmental Stores Lead Sales Channels

Mechanical Locks Market Analysis By Sales Channel

Departmental stores are expected to account for 38.6% of the industry in 2025. These stores are preferred by consumers for their ability to offer a wide variety of mechanical locks, allowing for side-by-side product comparisons. Retailers like Home Depot, Lowe's, and Walmart dominate this segment, offering in-store inspections, expert assistance, and a wide range of security solutions.

The convenience of physical retail locations, combined with knowledgeable staff, enhances consumer confidence and purchasing decisions. Departmental stores offer consumers the opportunity to evaluate product quality firsthand, which is crucial in the decision-making process.

  • Increasing reliance on in-store shopping for product inspection and comparison
  • Strong growth of DIY home improvement projects driving lock sales in retail stores
  • Consumer preference for personalized assistance in selecting security solutions

Top Market Dynamics in Mechanical Locks

The market is projected to grow steadily, driven by increasing demand for security solutions across residential, commercial, and industrial sectors. Despite the growth of smart and electronic locking systems, mechanical locks remain popular due to their simplicity, affordability, and reliability. The market faces challenges, including competition from advanced lock technologies and the need for constant innovation to meet evolving consumer preferences.

Rising Security Demands and Affordability Drive Growth

The market is benefiting from growing security concerns, particularly in residential and commercial sectors. According to a recent report, the global burglary rate has increased by 12% over the past decade, pushing demand for reliable locking systems.

The construction industry's rapid expansion, particularly in emerging economies, is contributing to an uptick in demand. It is estimated that emerging industries such as Asia-Pacific and Latin America will witness a 6% rise in construction activities annually, further driving mechanical lock demand. These locks are often 20-30% more affordable than their electronic counterparts, making them more appealing in price-sensitive sectors.

  • Growing demand for security in residential and commercial sectors
  • Increased construction activities boost the need for locking solutions
  • Cost-effectiveness makes mechanical locks a preferred choice

Competition from Advanced Locking Technologies

Mechanical locks are encountering significant competition from electronic and smart locks. These advanced systems are gaining traction, particularly in developed industries like North America and Western Europe. Their appeal lies in features such as remote access and compatibility with smart home systems. These locks require more frequent maintenance, with 45% of users reporting higher repair rates compared to electronic systems. Only 38% of homeowners are aware of the benefits of mechanical locks over digital alternatives.

  • Competition from electronic and smart locks offering advanced features
  • Mechanical locks require higher maintenance and are prone to wear
  • Limited consumer awareness of the benefits over electronic alternatives

Top Countries Designing, Assembling, Certifying, and Distributing Mechanical Locks

Country CAGR (2025 to 2035)
USA 2.3%
UK 3.1%
Germany 2.9%
Japan 4.4%
GCC 5.1%

The mechanical locks industry is projected to grow at a global CAGR of 3.7% from 2025 to 2035. Among the profiled regions, GCC markets lead at 5.1%, outperforming the global average by 1.4 percentage points, supported by a construction pipeline concentrated in mid-rise residential, hospitality, and retail developments.

Japan follows at 4.4%, driven by a mix of retrofitting in aging multifamily units and security upgrades in schools and public infrastructure. Both regions are increasing imports of Grade 1 and Grade 2 certified cylinders and mortise locks from OEM hubs in Taiwan and Korea.

Germany and the United Kingdom, both within the OECD, grow at 2.9% and 3.1% respectively, tracking below the baseline. These markets rely heavily on standard-compliant, insurance-approved hardware and face slower volume expansion due to stable housing turnover.

The United States lags with a 2.3% CAGR, reflecting saturation in primary housing segments and limited institutional renovations. Domestic players are focusing on contract wins tied to federal facility maintenance and university housing retrofits to offset replacement cycle stagnation.

The report covers detailed analysis of 40+ countries and the top five countries have been shared as a reference.

In-depth Analysis of Mechanical Locks Market in the United States

Demand for mechanical locks in the United States is projected to grow at a CAGR of 2.3% from 2025 to 2035. Rising security concerns in residential and commercial sectors continue to drive the demand for these locks, which are favored for their cost-effectiveness, simplicity, and reliability.

Homeowners prefer these locks for their affordability, while businesses and commercial properties rely on them to secure premises effectively. These locks offer ease of installation and low maintenance compared to newer smart lock systems. With the ongoing construction and renovation boom, the demand for these traditional, reliable security solutions is set to increase.

  • Rising preference for these locks due to affordability compared to electronic alternatives
  • Continued investment in residential security systems and infrastructure projects
  • Growth of DIY home improvement projects driving demand for these locks in retail stores

Demand Forecast for Mechanical Locks Market in the United Kingdom

The UK market, growing at a CAGR of 3.1% from 2025 to 2035. This growth is driven by the need for secure, affordable solutions in residential, commercial, and high-risk sectors such as healthcare and financial institutions. These locks are widely preferred for their proven reliability, durability, and ease of installation.

Despite the increasing popularity of smart locks, traditional locks continue to be favored due to their cost-effectiveness. Ongoing urban construction and stringent security regulations in the UK further support the demand for these locks, ensuring their long-term dominance in the security market.

  • Increase in home security upgrades due to rising crime rates.
  • Preference for easy-to-install and cost-effective locks.
  • Expansion of the retail network for better accessibility of locks.

Growth Analysis of Mechanical Locks in Germany

Sales for mechanical locks in Germany are expanding at a CAGR of 2.9% from 2025 to 2035. The continued demand for locks in both residential and commercial sectors is driven by their affordability, reliability, and long lifespan. In high-security environments, such as government buildings and industrial sites, mechanical locks remain a trusted security solution due to their ease of use and low maintenance.

The industry is supported by strict security standards and ongoing infrastructure development. Despite the increasing adoption of electronic locks, mechanical solutions remain essential for both new constructions and renovations.

  • Growing demand for high-security locking solutions in industrial and commercial spaces
  • Increased focus on product innovation and improved functionality in locks
  • Continued reliance on durable, long-lasting locks due to their simplicity and performance

Opportunity Analysis for Mechanical Locks in Japan

Demand for mechanical locks in Japan is forecasted to rise at a CAGR of 4.4% from 2025 to 2035. The demand for these locks remains strong due to their durability, affordability, and reliability in securing both residential and commercial properties. Japan’s focus on high-security standards, especially in government institutions and financial sectors, ensures continued demand for these locks.

While smart locks are increasingly popular, mechanical locks continue to dominate in various sectors due to their effectiveness, ease of maintenance, and lower cost. With ongoing construction growth, particularly in commercial real estate and urban development, mechanical locks are set to remain a trusted security solution.

  • Increased demand for compact and space-efficient locking solutions
  • Rising integration of locks in high-tech residential and commercial properties
  • Shift towards user-friendly lock designs that combine traditional security with modern needs

Demand Outlook for Mechanical Locks in GCC

The mechanical locks market in the GCC region is projected to grow at a CAGR of 5.1% from 2025 to 2035. This growth is largely driven by the rapid urbanization and expansion of the construction and real estate sectors in countries such as the UAE, Saudi Arabia, and Qatar.

Mechanical locks continue to be the preferred security solution due to their reliability, affordability, and ease of installation. In high-rise buildings, residential complexes, and commercial properties, these locks provide effective and cost-efficient security measures. As the region modernizes and builds new infrastructure, mechanical locks will remain integral to ensuring the safety of buildings.
  • Demand for locks is driven by construction and security concerns.
  • ASSA ABLOY and Al-Futtaim lead the market in mechanical lock solutions.
  • Carrefour and Lulu Hypermarket are key players in retail distribution.

Leading Manufactures in Mechanical Locks Market

Mechanical Locks Market Analysis By Company

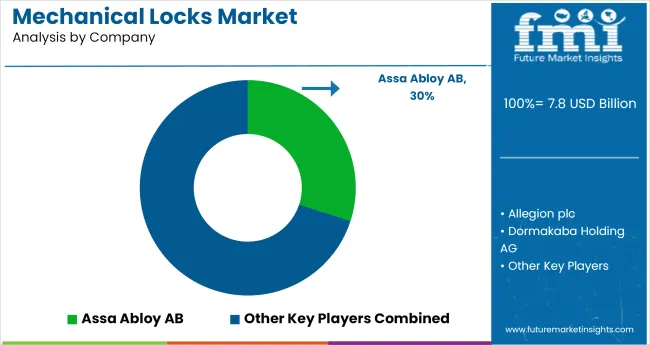
In the mechanical locks market, leading companies are pursuing growth through strategic acquisitions, high-volume project bids, and expanded OEM integration across commercial and residential sectors. Assa Abloy AB, the leading player, is scaling through product consolidation, digital-mechanical convergence, and geographic expansion into Eastern Europe and Southeast Asia. Allegion, Dormakaba, and Stanley Black & Decker are reinforcing their positions through infrastructure contracts, school security upgrades, and institutional lock system deployments.

Spectrum Brands, with its Kwikset and Baldwin brands, remains active in the mid-range residential segment via USA retail and builder channels. Regional manufacturers like Godrej & Boyce, ABUS, and Mul-T-Lock are strengthening their foothold through country-specific product lines and price-tiered distribution networks.

Competitive intensity in this space is increasing as digital retrofitting challenges legacy lock formats and project-based procurement compresses margins. Defending industry share requires backward integration into component sourcing, IP protection across lock families, and multi-year builder or government contracts.

Most players are focused on three strategies: accelerating hybrid lock development using analog shells with digital upgrades, forming co-manufacturing pacts to stabilize input costs, and aligning certifications with evolving OECD and BRICS building standards to retain compliance-led supply advantages.

Recent Industry News

  • In September 2024, ASSA ABLOY acquired USAbased smart lock start-up Level-Home to embed digital components directly into conventional deadbolts. This acquisition aims to streamline lock design and eliminate bulky external modules, positioning the company to offer integrated smart-mechanical solutions that contrast with legacy retrofit models.
  • In July 2024, ASSA ABLOY reported a 1% decline in Q2 sales due to a slowdown in construction activity in China, which impacted its Asia Pacific business. Despite this, overall company sales rose by 10%, attributed to a series of recent acquisitions that helped offset regional weaknesses and reinforce global portfolio strength.

Leading Companies in Mechanical Locks Market

  • Assa Abloy AB
  • Allegion plc
  • Dormakaba Holding AG
  • Spectrum Brands Holdings, Inc.
  • Stanley Black & Decker, Inc.
  • CISA S.p.A.
  • Godrej & Boyce Manufacturing Company Limited
  • ABUS August Bremicker Söhne KG
  • Mul-T-Lock Ltd.
  • Kaba Group
  • Other Players (As Requested)

Report Coverage and Scope Summary

Report Attributes Details
Industry Size (2025) USD 7.75 billion
Projected Industry Size (2035) USD 11.15 billion
CAGR (2025 to 2035) 3.7%
Base Year for Estimation 2024
Historical Period 2020 to 2024
Projections Period 2025 to 2035
Quantitative Units USD billion for value and million units for volume
Product Types Analyzed (Segment 1) Deadbolt, Others
Sales Channels Analyzed (Segment 2) Departmental Stores, Other Sales Channels
Regions Covered North America, Latin America, Western Europe, Eastern Europe, East Asia, South Asia & Pacific, Middle East & Africa
Countries Covered United States, Canada, Germany, United Kingdom, France, Italy, Spain, China, India, Japan, South Korea, Australia, Brazil, Mexico, Argentina, Saudi Arabia, UAE, South Africa
Key Players Assa Abloy AB, Allegion plc, Dormakaba Holding AG, Spectrum Brands Holdings, Inc., Stanley Black & Decker, Inc., CISA S.p.A., Godrej & Boyce Manufacturing Company Limited, ABUS August Bremicker Söhne KG, Mul-T-Lock Ltd., Kaba Group, Other Players (As Requested)
Additional Attributes Dollar sales, share by product type and sales channel, continued demand across residential and commercial segments, price advantages over smart locks, regional channel preferences

Market Segmentation

By Product Type:

The segment includes Deadbolt and Others.

By Sales Channel:

The industry is segmented into Departmental Stores and Other Sales Channels.

By Region:

Regional analysis includes North America, Latin America, Western Europe, Eastern Europe, East Asia, South Asia & Pacific, and Middle East & Africa.

Table of Content

  1. Executive Summary
    • Global Market Outlook
    • Demand-side Trends
    • Supply-side Trends
    • Technology Roadmap Analysis
    • Analysis and Recommendations
  2. Market Overview
    • Market Coverage / Taxonomy
    • Market Definition / Scope / Limitations
  3. Market Background
    • Market Dynamics
      • Drivers
      • Restraints
      • Opportunity
      • Trends
    • Scenario Forecast
      • Demand in Optimistic Scenario
      • Demand in Likely Scenario
      • Demand in Conservative Scenario
    • Opportunity Map Analysis
    • Product Life Cycle Analysis
    • Supply Chain Analysis
      • Supply Side Participants and their Roles
        • Producers
        • Mid-Level Participants (Traders/ Agents/ Brokers)
        • Wholesalers and Distributors
      • Value Added and Value Created at Node in the Supply Chain
      • List of Raw Material Suppliers
      • List of Existing and Potential Buyer’s
    • Investment Feasibility Matrix
    • Value Chain Analysis
      • Profit Margin Analysis
      • Wholesalers and Distributors
      • Retailers
    • PESTLE and Porter’s Analysis
    • Regulatory Landscape
      • By Key Regions
      • By Key Countries
    • Regional Parent Market Outlook
    • Production and Consumption Statistics
    • Import and Export Statistics
  4. Global Market Analysis 2020 to 2024 and Forecast, 2025 to 2035
    • Historical Market Size Value (USD Billion) & Volume (Million Units) Analysis, 2020 to 2024
    • Current and Future Market Size Value (USD Billion) & Volume (Million Units) Projections, 2025 to 2035
      • Y-o-Y Growth Trend Analysis
      • Absolute $ Opportunity Analysis
  5. Global Market Pricing Analysis 2020 to 2024 and Forecast 2025 to 2035
  6. Global Market Analysis 2020 to 2024 and Forecast 2025 to 2035, By Product Type
    • Introduction / Key Findings
    • Historical Market Size Value (USD Billion) & Volume (Million Units) Analysis By Product Type, 2020 to 2024
    • Current and Future Market Size Value (USD Billion) & Volume (Million Units) Analysis and Forecast By Product Type, 2025 to 2035
      • Deadbolt
      • Padlock
      • Mortise Lock
      • Others
    • Y-o-Y Growth Trend Analysis By Product Type, 2020 to 2024
    • Absolute $ Opportunity Analysis By Product Type, 2025 to 2035
  7. Global Market Analysis 2020 to 2024 and Forecast 2025 to 2035, By Sales Channel
    • Introduction / Key Findings
    • Historical Market Size Value (USD Billion) & Volume (Million Units) Analysis By Sales Channel, 2020 to 2024
    • Current and Future Market Size Value (USD Billion) & Volume (Million Units) Analysis and Forecast By Sales Channel, 2025 to 2035
      • Departmental Stores
      • Hardware & Specialty Stores
      • Online Retail
      • Other Sales Channels
    • Y-o-Y Growth Trend Analysis By Sales Channel, 2020 to 2024
    • Absolute $ Opportunity Analysis By Sales Channel, 2025 to 2035
  8. Global Market Analysis 2020 to 2024 and Forecast 2025 to 2035, By Region
    • Introduction
    • Historical Market Size Value (USD Billion) & Volume (Million Units) Analysis By Region, 2020 to 2024
    • Current Market Size Value (USD Billion) & Volume (Million Units) Analysis and Forecast By Region, 2025 to 2035
      • North America
      • Latin America
      • Western Europe
      • Eastern Europe
      • East Asia
      • South Asia & Pacific
      • Middle East and Africa
    • Market Attractiveness Analysis By Region
  9. North America Market Analysis 2020 to 2024 and Forecast 2025 to 2035, By Country
    • Historical Market Size Value (USD Billion) & Volume (Million Units) Trend Analysis By Market Taxonomy, 2020 to 2024
    • Market Size Value (USD Billion) & Volume (Million Units) Forecast By Market Taxonomy, 2025 to 2035
      • By Country
        • USA
        • Canada
        • Mexico
      • By Product Type
      • By Sales Channel
    • Market Attractiveness Analysis
      • By Country
      • By Product Type
      • By Sales Channel
    • Key Takeaways
  10. Latin America Market Analysis 2020 to 2024 and Forecast 2025 to 2035, By Country
    • Historical Market Size Value (USD Billion) & Volume (Million Units) Trend Analysis By Market Taxonomy, 2020 to 2024
    • Market Size Value (USD Billion) & Volume (Million Units) Forecast By Market Taxonomy, 2025 to 2035
      • By Country
        • Brazil
        • Argentina
        • Rest of LATAM
      • By Product Type
      • By Sales Channel
    • Market Attractiveness Analysis
      • By Country
      • By Product Type
      • By Sales Channel
    • Key Takeaways
  11. Western Europe Market Analysis 2020 to 2024 and Forecast 2025 to 2035, By Country
    • Historical Market Size Value (USD Billion) & Volume (Million Units) Trend Analysis By Market Taxonomy, 2020 to 2024
    • Market Size Value (USD Billion) & Volume (Million Units) Forecast By Market Taxonomy, 2025 to 2035
      • By Country
        • Germany
        • Italy
        • France
        • UK
        • Spain
        • BENELUX
        • Nordic
        • Rest of W.Europe
      • By Product Type
      • By Sales Channel
    • Market Attractiveness Analysis
      • By Country
      • By Product Type
      • By Sales Channel
    • Key Takeaways
  12. Eastern Europe Market Analysis 2020 to 2024 and Forecast 2025 to 2035, By Country
    • Historical Market Size Value (USD Billion) & Volume (Million Units) Trend Analysis By Market Taxonomy, 2020 to 2024
    • Market Size Value (USD Billion) & Volume (Million Units) Forecast By Market Taxonomy, 2025 to 2035
      • By Country
        • Russia
        • Hungary
        • Poland
        • Balkan & Baltics
        • Rest of E. Europe
      • By Product Type
      • By Sales Channel
    • Market Attractiveness Analysis
      • By Country
      • By Product Type
      • By Sales Channel
    • Key Takeaways
  13. East Asia Market Analysis 2020 to 2024 and Forecast 2025 to 2035, By Country
    • Historical Market Size Value (USD Billion) & Volume (Million Units) Trend Analysis By Market Taxonomy, 2020 to 2024
    • Market Size Value (USD Billion) & Volume (Million Units) Forecast By Market Taxonomy, 2025 to 2035
      • By Country
        • China
        • Japan
        • South Korea
      • By Product Type
      • By Sales Channel
    • Market Attractiveness Analysis
      • By Country
      • By Product Type
      • By Sales Channel
    • Key Takeaways
  14. South Asia & Pacific Market Analysis 2020 to 2024 and Forecast 2025 to 2035, By Country
    • Historical Market Size Value (USD Billion) & Volume (Million Units) Trend Analysis By Market Taxonomy, 2020 to 2024
    • Market Size Value (USD Billion) & Volume (Million Units) Forecast By Market Taxonomy, 2025 to 2035
      • By Country
        • India
        • Australia & New Zealand
        • ASEAN
        • Rest of SAP
      • By Product Type
      • By Sales Channel
    • Market Attractiveness Analysis
      • By Country
      • By Product Type
      • By Sales Channel
    • Key Takeaways
  15. Middle East and Africa Market Analysis 2020 to 2024 and Forecast 2025 to 2035, By Country
    • Historical Market Size Value (USD Billion) & Volume (Million Units) Trend Analysis By Market Taxonomy, 2020 to 2024
    • Market Size Value (USD Billion) & Volume (Million Units) Forecast By Market Taxonomy, 2025 to 2035
      • By Country
        • GCC Countries
        • Northern Africa
        • South Africa
        • Turkiye
        • Rest of MEA
      • By Product Type
      • By Sales Channel
    • Market Attractiveness Analysis
      • By Country
      • By Product Type
      • By Sales Channel
    • Key Takeaways
  16. Key Countries Market Analysis
    • USA
      • Pricing Analysis
      • Market Share Analysis, 2024
        • By Product Type
        • By Sales Channel
    • Canada
      • Pricing Analysis
      • Market Share Analysis, 2024
        • By Product Type
        • By Sales Channel
    • Brazil
      • Pricing Analysis
      • Market Share Analysis, 2024
        • By Product Type
        • By Sales Channel
    • Mexico
      • Pricing Analysis
      • Market Share Analysis, 2024
        • By Product Type
        • By Sales Channel
    • Argentina
      • Pricing Analysis
      • Market Share Analysis, 2024
        • By Product Type
        • By Sales Channel
  17. Market Structure Analysis
    • Competition Dashboard
    • Competition Benchmarking
    • Market Share Analysis of Top Players
      • By Regional
      • By Product Type
      • By Sales Channel
  18. Competition Analysis
    • Competition Deep Dive
      • Assa Abloy AB
        • Overview
        • Product Portfolio
        • Profitability by Market Segments (Product/Age /Sales Channel/Region)
        • Sales Footprint
        • Strategy Overview
          • Marketing Strategy
          • Product Strategy
          • Channel Strategy
      • Allegion plc
        • Overview
        • Product Portfolio
        • Profitability by Market Segments (Product/Age /Sales Channel/Region)
        • Sales Footprint
        • Strategy Overview
          • Marketing Strategy
          • Product Strategy
          • Channel Strategy
      • Dormakaba Holding AG
        • Overview
        • Product Portfolio
        • Profitability by Market Segments (Product/Age /Sales Channel/Region)
        • Sales Footprint
        • Strategy Overview
          • Marketing Strategy
          • Product Strategy
          • Channel Strategy
      • Spectrum Brands Holdings, Inc.
        • Overview
        • Product Portfolio
        • Profitability by Market Segments (Product/Age /Sales Channel/Region)
        • Sales Footprint
        • Strategy Overview
          • Marketing Strategy
          • Product Strategy
          • Channel Strategy
      • Stanley Black & Decker, Inc.
        • Overview
        • Product Portfolio
        • Profitability by Market Segments (Product/Age /Sales Channel/Region)
        • Sales Footprint
        • Strategy Overview
          • Marketing Strategy
          • Product Strategy
          • Channel Strategy
      • CISA S.p.A.
        • Overview
        • Product Portfolio
        • Profitability by Market Segments (Product/Age /Sales Channel/Region)
        • Sales Footprint
        • Strategy Overview
          • Marketing Strategy
          • Product Strategy
          • Channel Strategy
      • Godrej & Boyce Manufacturing Company Limited
        • Overview
        • Product Portfolio
        • Profitability by Market Segments (Product/Age /Sales Channel/Region)
        • Sales Footprint
        • Strategy Overview
          • Marketing Strategy
          • Product Strategy
          • Channel Strategy
      • ABUS August Bremicker Söhne KG
        • Overview
        • Product Portfolio
        • Profitability by Market Segments (Product/Age /Sales Channel/Region)
        • Sales Footprint
        • Strategy Overview
          • Marketing Strategy
          • Product Strategy
          • Channel Strategy
      • Mul-T-Lock Ltd.
        • Overview
        • Product Portfolio
        • Profitability by Market Segments (Product/Age /Sales Channel/Region)
        • Sales Footprint
        • Strategy Overview
          • Marketing Strategy
          • Product Strategy
          • Channel Strategy
      • Kaba Group
        • Overview
        • Product Portfolio
        • Profitability by Market Segments (Product/Age /Sales Channel/Region)
        • Sales Footprint
        • Strategy Overview
          • Marketing Strategy
          • Product Strategy
          • Channel Strategy
      • Other Players (As Requested)
        • Overview
        • Product Portfolio
        • Profitability by Market Segments (Product/Age /Sales Channel/Region)
        • Sales Footprint
        • Strategy Overview
          • Marketing Strategy
          • Product Strategy
          • Channel Strategy
  19. Assumptions & Acronyms Used
  20. Research Methodology

List of Tables

  • Table 1: Global Market Value (USD Billion) Forecast by Region, 2020-2035
  • Table 2: Global Market Volume (Million Units) Forecast by Region, 2020-2035
  • Table 3: Global Market Value (USD Billion) Forecast by Product Type, 2020-2035
  • Table 4: Global Market Volume (Million Units) Forecast by Product Type, 2020-2035
  • Table 5: Global Market Value (USD Billion) Forecast by Sales Channel, 2020-2035
  • Table 6: Global Market Volume (Million Units) Forecast by Sales Channel, 2020-2035
  • Table 7: North America Market Value (USD Billion) Forecast by Country, 2020-2035
  • Table 8: North America Market Volume (Million Units) Forecast by Country, 2020-2035
  • Table 9: North America Market Value (USD Billion) Forecast by Product Type, 2020-2035
  • Table 10: North America Market Volume (Million Units) Forecast by Product Type, 2020-2035
  • Table 11: North America Market Value (USD Billion) Forecast by Sales Channel, 2020-2035
  • Table 12: North America Market Volume (Million Units) Forecast by Sales Channel, 2020-2035
  • Table 13: Latin America Market Value (USD Billion) Forecast by Country, 2020-2035
  • Table 14: Latin America Market Volume (Million Units) Forecast by Country, 2020-2035
  • Table 15: Latin America Market Value (USD Billion) Forecast by Product Type, 2020-2035
  • Table 16: Latin America Market Volume (Million Units) Forecast by Product Type, 2020-2035
  • Table 17: Latin America Market Value (USD Billion) Forecast by Sales Channel, 2020-2035
  • Table 18: Latin America Market Volume (Million Units) Forecast by Sales Channel, 2020-2035
  • Table 19: Western Europe Market Value (USD Billion) Forecast by Country, 2020-2035
  • Table 20: Western Europe Market Volume (Million Units) Forecast by Country, 2020-2035
  • Table 21: Western Europe Market Value (USD Billion) Forecast by Product Type, 2020-2035
  • Table 22: Western Europe Market Volume (Million Units) Forecast by Product Type, 2020-2035
  • Table 23: Western Europe Market Value (USD Billion) Forecast by Sales Channel, 2020-2035
  • Table 24: Western Europe Market Volume (Million Units) Forecast by Sales Channel, 2020-2035
  • Table 25: Eastern Europe Market Value (USD Billion) Forecast by Country, 2020-2035
  • Table 26: Eastern Europe Market Volume (Million Units) Forecast by Country, 2020-2035
  • Table 27: Eastern Europe Market Value (USD Billion) Forecast by Product Type, 2020-2035
  • Table 28: Eastern Europe Market Volume (Million Units) Forecast by Product Type, 2020-2035
  • Table 29: Eastern Europe Market Value (USD Billion) Forecast by Sales Channel, 2020-2035
  • Table 30: Eastern Europe Market Volume (Million Units) Forecast by Sales Channel, 2020-2035
  • Table 31: East Asia Market Value (USD Billion) Forecast by Country, 2020-2035
  • Table 32: East Asia Market Volume (Million Units) Forecast by Country, 2020-2035
  • Table 33: East Asia Market Value (USD Billion) Forecast by Product Type, 2020-2035
  • Table 34: East Asia Market Volume (Million Units) Forecast by Product Type, 2020-2035
  • Table 35: East Asia Market Value (USD Billion) Forecast by Sales Channel, 2020-2035
  • Table 36: East Asia Market Volume (Million Units) Forecast by Sales Channel, 2020-2035
  • Table 37: South Asia & Pacific Market Value (USD Billion) Forecast by Country, 2020-2035
  • Table 38: South Asia & Pacific Market Volume (Million Units) Forecast by Country, 2020-2035
  • Table 39: South Asia & Pacific Market Value (USD Billion) Forecast by Product Type, 2020-2035
  • Table 40: South Asia & Pacific Market Volume (Million Units) Forecast by Product Type, 2020-2035
  • Table 41: South Asia & Pacific Market Value (USD Billion) Forecast by Sales Channel, 2020-2035
  • Table 42: South Asia & Pacific Market Volume (Million Units) Forecast by Sales Channel, 2020-2035
  • Table 43: Middle East and Africa Market Value (USD Billion) Forecast by Country, 2020-2035
  • Table 44: Middle East and Africa Market Volume (Million Units) Forecast by Country, 2020-2035
  • Table 45: Middle East and Africa Market Value (USD Billion) Forecast by Product Type, 2020-2035
  • Table 46: Middle East and Africa Market Volume (Million Units) Forecast by Product Type, 2020-2035
  • Table 47: Middle East and Africa Market Value (USD Billion) Forecast by Sales Channel, 2020-2035
  • Table 48: Middle East and Africa Market Volume (Million Units) Forecast by Sales Channel,

List of Figures

  • Figure 1: Global Market Volume (Million Units) Forecast 2020-2035
  • Figure 2: Global Market Pricing Analysis
  • Figure 3: Global Market Value (USD Billion) Forecast 2020-2035
  • Figure 4: Global Market Value Share and BPS Analysis by Product Type, 2025 and 2035
  • Figure 5: Global Market Y-o-Y Growth Comparison by Product Type, 2025-2035
  • Figure 6: Global Market Attractiveness Analysis by Product Type
  • Figure 7: Global Market Value Share and BPS Analysis by Sales Channel, 2025 and 2035
  • Figure 8: Global Market Y-o-Y Growth Comparison by Sales Channel, 2025-2035
  • Figure 9: Global Market Attractiveness Analysis by Sales Channel
  • Figure 10: Global Market Value (USD Billion) Share and BPS Analysis by Region, 2025 and 2035
  • Figure 11: Global Market Y-o-Y Growth Comparison by Region, 2025-2035
  • Figure 12: Global Market Attractiveness Analysis by Region
  • Figure 13: North America Market Incremental $ Opportunity, 2025-2035
  • Figure 14: Latin America Market Incremental $ Opportunity, 2025-2035
  • Figure 15: Western Europe Market Incremental $ Opportunity, 2025-2035
  • Figure 16: Eastern Europe Market Incremental $ Opportunity, 2025-2035
  • Figure 17: East Asia Market Incremental $ Opportunity, 2025-2035
  • Figure 18: South Asia & Pacific Market Incremental $ Opportunity, 2025-2035
  • Figure 19: Middle East and Africa Market Incremental $ Opportunity, 2025-2035
  • Figure 20: North America Market Value Share and BPS Analysis by Country, 2025 and 2035
  • Figure 21: North America Market Value Share and BPS Analysis by Product Type, 2025 and 2035
  • Figure 22: North America Market Y-o-Y Growth Comparison by Product Type, 2025-2035
  • Figure 23: North America Market Attractiveness Analysis by Product Type
  • Figure 24: North America Market Value Share and BPS Analysis by Sales Channel, 2025 and 2035
  • Figure 25: North America Market Y-o-Y Growth Comparison by Sales Channel, 2025-2035
  • Figure 26: North America Market Attractiveness Analysis by Sales Channel
  • Figure 27: Latin America Market Value Share and BPS Analysis by Country, 2025 and 2035
  • Figure 28: Latin America Market Value Share and BPS Analysis by Product Type, 2025 and 2035
  • Figure 29: Latin America Market Y-o-Y Growth Comparison by Product Type, 2025-2035
  • Figure 30: Latin America Market Attractiveness Analysis by Product Type
  • Figure 31: Latin America Market Value Share and BPS Analysis by Sales Channel, 2025 and 2035
  • Figure 32: Latin America Market Y-o-Y Growth Comparison by Sales Channel, 2025-2035
  • Figure 33: Latin America Market Attractiveness Analysis by Sales Channel
  • Figure 34: Western Europe Market Value Share and BPS Analysis by Country, 2025 and 2035
  • Figure 35: Western Europe Market Value Share and BPS Analysis by Product Type, 2025 and 2035
  • Figure 36: Western Europe Market Y-o-Y Growth Comparison by Product Type, 2025-2035
  • Figure 37: Western Europe Market Attractiveness Analysis by Product Type
  • Figure 38: Western Europe Market Value Share and BPS Analysis by Sales Channel, 2025 and 2035
  • Figure 39: Western Europe Market Y-o-Y Growth Comparison by Sales Channel, 2025-2035
  • Figure 40: Western Europe Market Attractiveness Analysis by Sales Channel
  • Figure 41: Eastern Europe Market Value Share and BPS Analysis by Country, 2025 and 2035
  • Figure 42: Eastern Europe Market Value Share and BPS Analysis by Product Type, 2025 and 2035
  • Figure 43: Eastern Europe Market Y-o-Y Growth Comparison by Product Type, 2025-2035
  • Figure 44: Eastern Europe Market Attractiveness Analysis by Product Type
  • Figure 45: Eastern Europe Market Value Share and BPS Analysis by Sales Channel, 2025 and 2035
  • Figure 46: Eastern Europe Market Y-o-Y Growth Comparison by Sales Channel, 2025-2035
  • Figure 47: Eastern Europe Market Attractiveness Analysis by Sales Channel
  • Figure 48: East Asia Market Value Share and BPS Analysis by Country, 2025 and 2035
  • Figure 49: East Asia Market Value Share and BPS Analysis by Product Type, 2025 and 2035
  • Figure 50: East Asia Market Y-o-Y Growth Comparison by Product Type, 2025-2035
  • Figure 51: East Asia Market Attractiveness Analysis by Product Type
  • Figure 52: East Asia Market Value Share and BPS Analysis by Sales Channel, 2025 and 2035
  • Figure 53: East Asia Market Y-o-Y Growth Comparison by Sales Channel, 2025-2035
  • Figure 54: East Asia Market Attractiveness Analysis by Sales Channel
  • Figure 55: South Asia & Pacific Market Value Share and BPS Analysis by Country, 2025 and 2035
  • Figure 56: South Asia & Pacific Market Value Share and BPS Analysis by Product Type, 2025 and 2035
  • Figure 57: South Asia & Pacific Market Y-o-Y Growth Comparison by Product Type, 2025-2035
  • Figure 58: South Asia & Pacific Market Attractiveness Analysis by Product Type
  • Figure 59: South Asia & Pacific Market Value Share and BPS Analysis by Sales Channel, 2025 and 2035
  • Figure 60: South Asia & Pacific Market Y-o-Y Growth Comparison by Sales Channel, 2025-2035
  • Figure 61: South Asia & Pacific Market Attractiveness Analysis by Sales Channel
  • Figure 62: Middle East and Africa Market Value Share and BPS Analysis by Country, 2025 and 2035
  • Figure 63: Middle East and Africa Market Value Share and BPS Analysis by Product Type, 2025 and 2035
  • Figure 64: Middle East and Africa Market Y-o-Y Growth Comparison by Product Type, 2025-2035
  • Figure 65: Middle East and Africa Market Attractiveness Analysis by Product Type
  • Figure 66: Middle East and Africa Market Value Share and BPS Analysis by Sales Channel, 2025 and 2035
  • Figure 67: Middle East and Africa Market Y-o-Y Growth Comparison by Sales Channel, 2025-2035
  • Figure 68: Middle East and Africa Market Attractiveness Analysis by Sales Channel
  • Figure 69: Global Market - Tier Structure Analysis
  • Figure 70: Global Market - Company Share Analysis

Frequently Asked Questions

What is the projected industry value of the mechanical locks market in 2025?

The industry is projected to reach USD 7.75 billion in 2025.

What is the expected global CAGR for the mechanical locks market from 2025 to 2035?

The industry is expected to grow at a CAGR of 3.7% from 2025 to 2035.

Which segment is expected to dominate the mechanical locks market in 2025?

Deadbolt locks are expected to capture 41.3% in 2025.

Which region is forecasted to show significant growth in the mechanical locks market by 2035?

The GCC region is projected to register a CAGR of 5.1% from 2025 to 2035.

What is the forecasted industry value of the mechanical locks market by 2035?

The industry is projected to reach USD 11.15 billion by 2035.

Explore Similar Insights

Future Market Insights

Mechanical Locks Market