Paint Buckets Market Size and Share Forecast Outlook 2025 to 2035

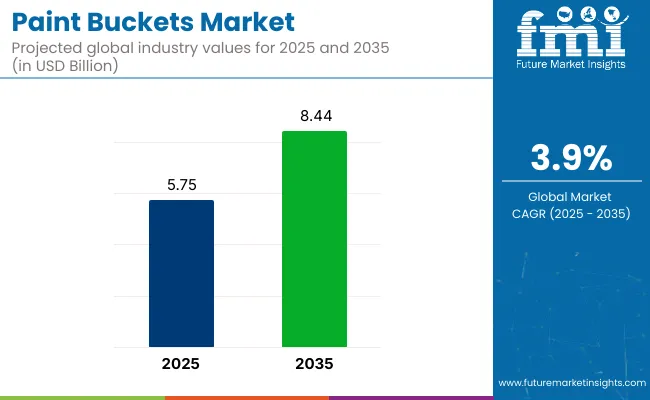
The global paint buckets market is projected to grow from USD 5.75 billion in 2025 to USD 8.44 billion by 2035, registering a CAGR of 3.9% during the forecast period. Sales in 2024 were recorded at USD 5.54 billion. This growth is primarily attributed to the increasing demand for durable and recyclable packaging solutions in the construction and automotive sectors.
Quick Stats of Paint Buckets Market

  • Market Value (2025): USD 5.75 billion
  • Forecast Value (2035): USD 8.44 billion
  • Forecast CAGR: 3.9%
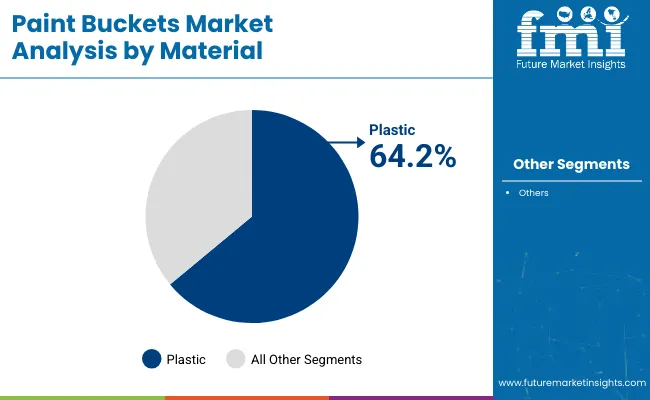
  • Material Leader in 2025: Plastic (64.2% market share)
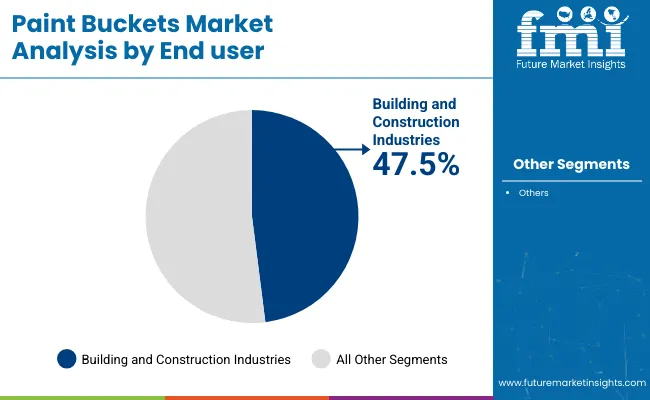
  • Top End user: Building and Construction industries (47.5% share)
  • Key Growth Country: South Asia Pacific (Indonesia is the fastest-growing market with 7.3% CAGR)

Paint Buckets Market

Metric Value
Industry Size (2025E) USD 5.75 billion
Industry Value (2035F) USD 8.44 billion
CAGR (2025 to 2035) 3.9%

The shift towards sustainable materials and the need for efficient storage and transportation of paints and coatings have further propelled the adoption of innovative paint bucket designs. Recent innovations in the paint buckets market have brought about notable improvements in functionality, safety, and customization. Manufacturers are increasingly adopting advanced materials such as high-density polyethylene (HDPE), polypropylene, and corrosion-resistant coatings to produce buckets that are lightweight yet durable.

These materials enhance chemical resistance and prolong the lifecycle of the containers. Design advancements have also resulted in the development of stackable and space-saving buckets, which improve transportation and storage efficiency across supply chains. Additionally, tamper-evident seals, snap-on lids, and ergonomic handles have become standard features, promoting both safety and convenience during handling and use.

Technological developments in manufacturing processes have further enabled automation compatibility, making these buckets ideal for high-volume industrial operations. Paint buckets are now being designed to seamlessly integrate with automated filling, labeling, and palletizing systems, reducing labor costs and boosting overall productivity.

Customization has also become a key differentiator, as companies offer tailored solutions in various sizes, colors, and shapes, along with in-mold labeling for branding. Furthermore, the growing focus on sustainability has led to the development of eco-friendly paint buckets using recyclable, biodegradable, or reusable materials. These advancements are helping manufacturers align with increasingly strict environmental regulations and meet consumer demand for green packaging solutions.

The global paint buckets market is witnessing robust growth, particularly in emerging regions such as Asia-Pacific. Rapid urbanization, rising disposable incomes, and a surge in infrastructure and construction projects are driving demand across both residential and commercial sectors.

Moreover, the growing popularity of DIY home improvement and decorative painting in developed and developing countries alike has expanded the market beyond traditional applications. To remain competitive, manufacturers are expected to continue investing in innovation, cost optimization, and sustainable practices, thereby offering versatile solutions that cater to a broad spectrum of end users and regulatory environments.

Analyzing Paint Buckets Market by Top Investment Segment

The market has been segmented based on material, capacity, application, end user, and region. By material, metal and plastic have been used to offer durability, chemical resistance, and cost efficiency across various coating needs. Capacity ranges such as less than 1 liter, 1 to 10 liters, 11 to 50 liters, and more than 50 liters have been defined to address diverse usage volumes and handling preferences.

Applications have been categorized into industrial coating and architectural coating, where paint buckets are utilized for protective and decorative purposes. End users such as building and construction industries, paint industries, chemical industries, and others have been included to reflect demand from core manufacturing and infrastructure sectors. Regional segmentation has been structured to cover North America, Latin America, Western Europe, Eastern Europe, East Asia, South Asia Pacific, and the Middle East and Africa.
Plastic Materials Selected for Their Flexibility, Strength, and Cost Efficiency

Paint Buckets Market Analysis By Material

The plastic segment is expected to account for 64.2% of the construction film market in 2025, as usage has been led by material versatility, tensile strength, and ease of deployment. Films composed of polyethylene, polypropylene, and PVC have been widely utilized across vapor barriers, moisture wraps, and protective sheeting. Custom formulations for UV resistance and puncture strength have been increasingly adopted in both indoor and outdoor applications. Lightweight rolls and ease of sealing have enabled faster installation on large-scale construction sites.

Plastic-based films have been engineered to support varying site conditions, including thermal shifts and abrasive surfaces. Recyclable and biodegradable variants have been promoted under green building codes and circular economy policies. Enhanced performance coatings have been introduced to improve durability and extend lifespan in exposed environments. The dominance of plastic has been maintained due to its adaptability to both standard and high-performance construction needs.
Building and Construction Industries Drive Usage through Broad Application Scope

Paint Buckets Market Analysis By End User

The building and construction industries are projected to lead the end-user segment with 47.5% of the construction film market share in 2025, driven by demand across insulation, roofing, and foundation work. Construction films have been deployed extensively for moisture control, concrete curing, and surface protection in residential and commercial builds.

Compliance with LEED certifications and regional safety standards has been supported through film-grade selection and manufacturing traceability. Large-scale infrastructure projects and green building mandates have expanded film application across all phases of construction.

Multi-layered and reinforced films have been adopted for enhanced durability in aggressive job site conditions. Transparent and printed variants have facilitated inspection, branding, and utility marking during installation. Cost savings, weather protection, and thermal regulation have been delivered through properly specified film systems. Growth in urbanization, modular construction, and retrofit activities has continued to sustain demand from the building and construction sector.

Challenges and Opportunities

Challenges

Raw Material Cost Volatility and Environmental Regulations

Although paint buckets facilitate effective storage and transportation, peak concerns include the volatility of resin and metal prices, rising environmental concerns about plastic waste, and tightening regulations on non-recyclable packaging, which companies must also respond to. Market growth is also inhibited by competition from flexible pouches and bag-in-box solutions for industrial paints.

Opportunities

Sustainable Packaging and Smart Paint Containers

The global trend towards the use of biodegradable plastic compounds, growing adaptation of lightweight metal buckets, solid growth in smart packaging with anti-spill technology is opening up new avenues for growth. Long-term market growth is expected to be driven by advancements such as multi-layered polymer coatings for rust resistance, tamper-proof bucket seals, and eco-friendly paint bucket manufacturing.

Further, demand for next-generation paint packaging solutions such as digital-printed branding solutions, reusable & refillable paint buckets, and easy-dispensing paint containers are witnessing an upsurge, which in turn is anticipated to be a guiding factor in driving revenue growth of the paint packaging market over the forecast period.
Country-wise Outlook

Paint Buckets Market Country Wise Analysis

United States

A USA-based paint bucket market is anticipated to be dominant over the global landscape, owing to the increasing growth of construction and renovation sector, increasing adoption of sustainable and recyclable packaging solutions along with growing trend of DIY home improvement projects. Increasing sustainable paint bucket packaging initiatives are prompting demand for lightweight and biodegradable plastic paint buckets.

Also, initiatives such as spill-proof lids, ergonomic handles and tamper-proof designs have increased the efficiency of products. Other growing trends in the bulk paint industry include the growing prevalence of e-commerce for bulk paint purchases and the increasing utilization of smart packaging for branding and tracking.

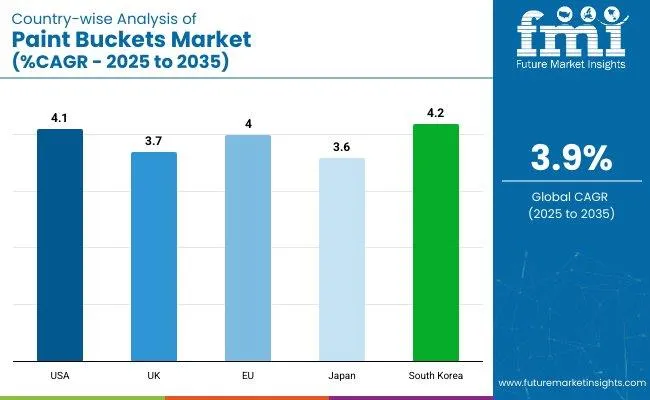
Country CAGR (2025 to 2035)
United States 4.1%

United Kingdom

The UK paint bucket attributed to the increasing consumer inclination toward sustainable and reusable paint containers, rising investment in green home renovation projects, and surging demand from the commercial construction vertical. The development of water-based and low-VOC paints (volatile organic compounds) is encouraging innovation in designs of corrosion-resistant and leak-proof paint buckets.

Furthermore, the growing utilization of lightweight, stackable buckets to improve storage & transportation efficiency is redounding the market approach. Another driving factor for Cross Flow Filtration are the rising commercial and domestic metal and hybrid-material paint buckets since they are long lasting and are likely to support industry expansion.

Country CAGR (2025 to 2035)
United Kingdom 3.7%

European Union

The United Kingdom is leading the paint bucket market in the European Union, with robust regulations supporting recyclable packaging, rising acceptance of advanced paint container designs, and increasing demand for high-quality packaging solutions in the industrial coatings sector. Policies from the EU to dispose of and reduce plastic waste and promote sustainable packaging alternatives are driving forward demand for reusable and biodegradable paint buckets.

Also, development of new UV-resistant and impact-resistant bucket materials are driving innovation in the industry. Market growth is also being driven by the increasing focus on spill-proof lids, easy-pour spouts, and tamper-evident sealing technologies.

Region CAGR (2025 to 2035)
European Union 4.0%

Japan

The expanding investments in precision manufacturing, the demand for compact and lightweight packaging solutions, and the positive regulatory environment supporting sustainable knowledge-based materials have opened lucrative opportunities in Japan’s paint bucket market. The nation’s expertise in polymer technology is spurring advances in high-durability plastic-and-metal paint buckets.

Moreover, trends of implementing smart labeling and digital tracking systems for inventory management are impacting the industry trends. Moreover, with the increasing adoption of space-saving and multi-purpose paint buckets for urban residential renovations, the market is witnessing new growth opportunities.

Country CAGR (2025 to 2035)
Japan 3.6%

South Korea

Paint buckets are becoming an essential part of packaging, and the basic structure of the product leads to the trend of miniaturization and high performance and market focusing on the lightness and features of the products. Hybrid-material paint buckets are in high demand as the country embraces packaging solutions that are lightweight and impact-resistant.

Moreover, the new development of moisture-resistant and anti-corrosive coatings for metal buckets is enhancing product durability. Furthermore, the rising role of AI-powered inventory management systems for optimal bucket distribution and storage is contributing to the market growth.

Country CAGR (2025 to 2035)
South Korea 4.2%

Competitive Outlook

The paint bucket market is driven by the rising demand for long-lasting and sustainable packaging solutions in the paint and coatings sector, innovations in lightweight and recyclable materials, and the increasing adoption of smart packaging technologies.

Market is thriving with applications in residential, commercial, and industrial painting. Key trends influencing the industry are eco-friendly packaging, tamper-proof lids, and innovations in stackable and ergonomic bucket designs.

Key Companies

  • Mauser Packaging Solutions
  • The Emballator Group
  • C.L.Smith
  • M&M Industries Inc.
  • The Cary Company
  • United States Plastic Corporation
  • Cleveland Steel Container Corporation
  • Norton Packaging
  • Mus Packaging
  • Containers Plus

Key Segmentation

By Material:

  • Metal
  • Plastic

By Capacity:

  • Less than 1 Liter
  • 1 to 10 Liters
  • 11 to 50 Liters
  • More than 50 Liters

By Application:

  • Industrial Coating
  • Architectural Coating

By End user:

  • Building and Construction Industries
  • Paint Industries
  • Chemical Industries
  • Others

By Region:

  • North America
  • Latin America
  • Western Europe
  • Eastern Europe
  • East Asia
  • South Asia Pacific
  • Middle East and Africa

Table of Content

  1. Executive Summary
    • Global Market Outlook
    • Demand-side Trends
    • Supply-side Trends
    • Technology Roadmap Analysis
    • Analysis and Recommendations
  2. Market Overview
    • Market Coverage / Taxonomy
    • Market Definition / Scope / Limitations
  3. Market Background
    • Market Dynamics
      • Drivers
      • Restraints
      • Opportunity
      • Trends
    • Scenario Forecast
      • Demand in Optimistic Scenario
      • Demand in Likely Scenario
      • Demand in Conservative Scenario
    • Opportunity Map Analysis
    • Product Life Cycle Analysis
    • Supply Chain Analysis
      • Supply Side Participants and their Roles
        • Producers
        • Mid-Level Participants (Traders/ Agents/ Brokers)
        • Wholesalers and Distributors
      • Value Added and Value Created at Node in the Supply Chain
      • List of Raw Material Suppliers
      • List of Existing and Potential Buyer’s
    • Investment Feasibility Matrix
    • Value Chain Analysis
      • Profit Margin Analysis
      • Wholesalers and Distributors
      • Retailers
    • PESTLE and Porter’s Analysis
    • Regulatory Landscape
      • By Key Regions
      • By Key Countries
    • Regional Parent Market Outlook
    • Production and Consumption Statistics
    • Import and Export Statistics
  4. Global Market Analysis 2020 to 2024 and Forecast, 2025 to 2035
    • Historical Market Size Value (USD Billion) & Volume (Units) Analysis, 2020 to 2024
    • Current and Future Market Size Value (USD Billion) & Volume (Units) Projections, 2025 to 2035
      • Y-o-Y Growth Trend Analysis
      • Absolute $ Opportunity Analysis
  5. Global Market Pricing Analysis 2020 to 2024 and Forecast 2025 to 2035
  6. Global Market Analysis 2020 to 2024 and Forecast 2025 to 2035, By Material
    • Introduction / Key Findings
    • Historical Market Size Value (USD Billion) & Volume (Units) Analysis By Material, 2020 to 2024
    • Current and Future Market Size Value (USD Billion) & Volume (Units) Analysis and Forecast By Material, 2025 to 2035
      • Metal
      • Plastic
    • Y-o-Y Growth Trend Analysis By Material, 2020 to 2024
    • Absolute $ Opportunity Analysis By Material, 2025 to 2035
  7. Global Market Analysis 2020 to 2024 and Forecast 2025 to 2035, By Capacity
    • Introduction / Key Findings
    • Historical Market Size Value (USD Billion) & Volume (Units) Analysis By Capacity, 2020 to 2024
    • Current and Future Market Size Value (USD Billion) & Volume (Units) Analysis and Forecast By Capacity, 2025 to 2035
      • Less than 1 Liter
      • 1 to 10 Liters
      • 11 to 50 Liters
      • More than 50 Liters
    • Y-o-Y Growth Trend Analysis By Capacity, 2020 to 2024
    • Absolute $ Opportunity Analysis By Capacity, 2025 to 2035
  8. Global Market Analysis 2020 to 2024 and Forecast 2025 to 2035, By Application
    • Introduction / Key Findings
    • Historical Market Size Value (USD Billion) & Volume (Units) Analysis By Application, 2020 to 2024
    • Current and Future Market Size Value (USD Billion) & Volume (Units) Analysis and Forecast By Application, 2025 to 2035
      • Industrial Coating
      • Architectural Coating
    • Y-o-Y Growth Trend Analysis By Application, 2020 to 2024
    • Absolute $ Opportunity Analysis By Application, 2025 to 2035
  9. Global Market Analysis 2020 to 2024 and Forecast 2025 to 2035, By End user
    • Introduction / Key Findings
    • Historical Market Size Value (USD Billion) & Volume (Units) Analysis By End user, 2020 to 2024
    • Current and Future Market Size Value (USD Billion) & Volume (Units) Analysis and Forecast By End user, 2025 to 2035
      • Building and Construction Industries
      • Paint Industries
      • Chemical Industries
      • Others
    • Y-o-Y Growth Trend Analysis By End user, 2020 to 2024
    • Absolute $ Opportunity Analysis By End user, 2025 to 2035
  10. Global Market Analysis 2020 to 2024 and Forecast 2025 to 2035, By Region
    • Introduction
    • Historical Market Size Value (USD Billion) & Volume (Units) Analysis By Region, 2020 to 2024
    • Current Market Size Value (USD Billion) & Volume (Units) Analysis and Forecast By Region, 2025 to 2035
      • North America
      • Latin America
      • Europe
      • East Asia
      • South Asia
      • Oceania
      • MEA
    • Market Attractiveness Analysis By Region
  11. North America Market Analysis 2020 to 2024 and Forecast 2025 to 2035, By Country
    • Historical Market Size Value (USD Billion) & Volume (Units) Trend Analysis By Market Taxonomy, 2020 to 2024
    • Market Size Value (USD Billion) & Volume (Units) Forecast By Market Taxonomy, 2025 to 2035
      • By Country
        • USA
        • Canada
      • By Material
      • By Capacity
      • By Application
      • By End user
    • Market Attractiveness Analysis
      • By Country
      • By Material
      • By Capacity
      • By Application
      • By End user
    • Key Takeaways
  12. Latin America Market Analysis 2020 to 2024 and Forecast 2025 to 2035, By Country
    • Historical Market Size Value (USD Billion) & Volume (Units) Trend Analysis By Market Taxonomy, 2020 to 2024
    • Market Size Value (USD Billion) & Volume (Units) Forecast By Market Taxonomy, 2025 to 2035
      • By Country
        • Brazil
        • Mexico
        • Argentina
        • Chile
        • Peru
        • Rest of Latin America
      • By Material
      • By Capacity
      • By Application
      • By End user
    • Market Attractiveness Analysis
      • By Country
      • By Material
      • By Capacity
      • By Application
      • By End user
    • Key Takeaways
  13. Europe Market Analysis 2020 to 2024 and Forecast 2025 to 2035, By Country
    • Historical Market Size Value (USD Billion) & Volume (Units) Trend Analysis By Market Taxonomy, 2020 to 2024
    • Market Size Value (USD Billion) & Volume (Units) Forecast By Market Taxonomy, 2025 to 2035
      • By Country
        • Germany
        • Italy
        • France
        • UK
        • Spain
        • Russia
        • BENELUX
        • Rest of Europe
      • By Material
      • By Capacity
      • By Application
      • By End user
    • Market Attractiveness Analysis
      • By Country
      • By Material
      • By Capacity
      • By Application
      • By End user
    • Key Takeaways
  14. East Asia Market Analysis 2020 to 2024 and Forecast 2025 to 2035, By Country
    • Historical Market Size Value (USD Billion) & Volume (Units) Trend Analysis By Market Taxonomy, 2020 to 2024
    • Market Size Value (USD Billion) & Volume (Units) Forecast By Market Taxonomy, 2025 to 2035
      • By Country
        • China
        • Japan
        • South Korea
      • By Material
      • By Capacity
      • By Application
      • By End user
    • Market Attractiveness Analysis
      • By Country
      • By Material
      • By Capacity
      • By Application
      • By End user
    • Key Takeaways
  15. South Asia Market Analysis 2020 to 2024 and Forecast 2025 to 2035, By Country
    • Historical Market Size Value (USD Billion) & Volume (Units) Trend Analysis By Market Taxonomy, 2020 to 2024
    • Market Size Value (USD Billion) & Volume (Units) Forecast By Market Taxonomy, 2025 to 2035
      • By Country
        • India
        • Thailand
        • Malaysia
        • Indonesia
        • Rest of South Asia
      • By Material
      • By Capacity
      • By Application
      • By End user
    • Market Attractiveness Analysis
      • By Country
      • By Material
      • By Capacity
      • By Application
      • By End user
    • Key Takeaways
  16. Oceania Market Analysis 2020 to 2024 and Forecast 2025 to 2035, By Country
    • Historical Market Size Value (USD Billion) & Volume (Units) Trend Analysis By Market Taxonomy, 2020 to 2024
    • Market Size Value (USD Billion) & Volume (Units) Forecast By Market Taxonomy, 2025 to 2035
      • By Country
        • Australia
        • New Zealand
      • By Material
      • By Capacity
      • By Application
      • By End user
    • Market Attractiveness Analysis
      • By Country
      • By Material
      • By Capacity
      • By Application
      • By End user
    • Key Takeaways
  17. MEA Market Analysis 2020 to 2024 and Forecast 2025 to 2035, By Country
    • Historical Market Size Value (USD Billion) & Volume (Units) Trend Analysis By Market Taxonomy, 2020 to 2024
    • Market Size Value (USD Billion) & Volume (Units) Forecast By Market Taxonomy, 2025 to 2035
      • By Country
        • GCC
        • Rest of MEA
      • By Material
      • By Capacity
      • By Application
      • By End user
    • Market Attractiveness Analysis
      • By Country
      • By Material
      • By Capacity
      • By Application
      • By End user
    • Key Takeaways
  18. Key Countries Market Analysis
    • USA
      • Pricing Analysis
      • Market Share Analysis, 2024
        • By Material
        • By Capacity
        • By Application
        • By End user
    • Canada
      • Pricing Analysis
      • Market Share Analysis, 2024
        • By Material
        • By Capacity
        • By Application
        • By End user
    • Brazil
      • Pricing Analysis
      • Market Share Analysis, 2024
        • By Material
        • By Capacity
        • By Application
        • By End user
    • Mexico
      • Pricing Analysis
      • Market Share Analysis, 2024
        • By Material
        • By Capacity
        • By Application
        • By End user
    • Argentina
      • Pricing Analysis
      • Market Share Analysis, 2024
        • By Material
        • By Capacity
        • By Application
        • By End user
  19. Market Structure Analysis
    • Competition Dashboard
    • Competition Benchmarking
    • Market Share Analysis of Top Players
      • By Regional
      • By Material
      • By Capacity
      • By Application
      • By End user
  20. Competition Analysis
    • Competition Deep Dive
      • Mauser Packaging Solutions
        • Overview
        • Product Portfolio
        • Profitability by Market Segments (Product/Age /Sales Channel/Region)
        • Sales Footprint
        • Strategy Overview
          • Marketing Strategy
          • Product Strategy
          • Channel Strategy
      • The Emballator Group
        • Overview
        • Product Portfolio
        • Profitability by Market Segments (Product/Age /Sales Channel/Region)
        • Sales Footprint
        • Strategy Overview
          • Marketing Strategy
          • Product Strategy
          • Channel Strategy
      • C.L.Smith
        • Overview
        • Product Portfolio
        • Profitability by Market Segments (Product/Age /Sales Channel/Region)
        • Sales Footprint
        • Strategy Overview
          • Marketing Strategy
          • Product Strategy
          • Channel Strategy
      • M&M Industries Inc.
        • Overview
        • Product Portfolio
        • Profitability by Market Segments (Product/Age /Sales Channel/Region)
        • Sales Footprint
        • Strategy Overview
          • Marketing Strategy
          • Product Strategy
          • Channel Strategy
      • The Cary Company
        • Overview
        • Product Portfolio
        • Profitability by Market Segments (Product/Age /Sales Channel/Region)
        • Sales Footprint
        • Strategy Overview
          • Marketing Strategy
          • Product Strategy
          • Channel Strategy
      • Value (USD Billion) & Volume (Units)ed States Plastic Corporation
        • Overview
        • Product Portfolio
        • Profitability by Market Segments (Product/Age /Sales Channel/Region)
        • Sales Footprint
        • Strategy Overview
          • Marketing Strategy
          • Product Strategy
          • Channel Strategy
      • Cleveland Steel Container Corporation
        • Overview
        • Product Portfolio
        • Profitability by Market Segments (Product/Age /Sales Channel/Region)
        • Sales Footprint
        • Strategy Overview
          • Marketing Strategy
          • Product Strategy
          • Channel Strategy
      • Norton Packaging
        • Overview
        • Product Portfolio
        • Profitability by Market Segments (Product/Age /Sales Channel/Region)
        • Sales Footprint
        • Strategy Overview
          • Marketing Strategy
          • Product Strategy
          • Channel Strategy
      • MUS Packaging
        • Overview
        • Product Portfolio
        • Profitability by Market Segments (Product/Age /Sales Channel/Region)
        • Sales Footprint
        • Strategy Overview
          • Marketing Strategy
          • Product Strategy
          • Channel Strategy
      • Containers Plus
        • Overview
        • Product Portfolio
        • Profitability by Market Segments (Product/Age /Sales Channel/Region)
        • Sales Footprint
        • Strategy Overview
          • Marketing Strategy
          • Product Strategy
          • Channel Strategy
  21. Assumptions & Acronyms Used
  22. Research Methodology

List of Tables

  • Table 1: Global Market Value (USD Billion) Forecast by Region, 2020-2035
  • Table 2: Global Market Volume (Units) Forecast by Region, 2020-2035
  • Table 3: Global Market Value (USD Billion) Forecast by By Material, 2020-2035
  • Table 4: Global Market Volume (Units) Forecast by By Material, 2020-2035
  • Table 5: Global Market Value (USD Billion) Forecast by By Capacity, 2020-2035
  • Table 6: Global Market Volume (Units) Forecast by By Capacity, 2020-2035
  • Table 7: Global Market Value (USD Billion) Forecast by By Application, 2020-2035
  • Table 8: Global Market Volume (Units) Forecast by By Application, 2020-2035
  • Table 9: Global Market Value (USD Billion) Forecast by By End user, 2020-2035
  • Table 10: Global Market Volume (Units) Forecast by By End user, 2020-2035
  • Table 11: North America Market Value (USD Billion) Forecast by Country, 2020-2035
  • Table 12: North America Market Volume (Units) Forecast by Country, 2020-2035
  • Table 13: North America Market Value (USD Billion) Forecast by By Material, 2020-2035
  • Table 14: North America Market Volume (Units) Forecast by By Material, 2020-2035
  • Table 15: North America Market Value (USD Billion) Forecast by By Capacity, 2020-2035
  • Table 16: North America Market Volume (Units) Forecast by By Capacity, 2020-2035
  • Table 17: North America Market Value (USD Billion) Forecast by By Application, 2020-2035
  • Table 18: North America Market Volume (Units) Forecast by By Application, 2020-2035
  • Table 19: North America Market Value (USD Billion) Forecast by By End user, 2020-2035
  • Table 20: North America Market Volume (Units) Forecast by By End user, 2020-2035
  • Table 21: Latin America Market Value (USD Billion) Forecast by Country, 2020-2035
  • Table 22: Latin America Market Volume (Units) Forecast by Country, 2020-2035
  • Table 23: Latin America Market Value (USD Billion) Forecast by By Material, 2020-2035
  • Table 24: Latin America Market Volume (Units) Forecast by By Material, 2020-2035
  • Table 25: Latin America Market Value (USD Billion) Forecast by By Capacity, 2020-2035
  • Table 26: Latin America Market Volume (Units) Forecast by By Capacity, 2020-2035
  • Table 27: Latin America Market Value (USD Billion) Forecast by By Application, 2020-2035
  • Table 28: Latin America Market Volume (Units) Forecast by By Application, 2020-2035
  • Table 29: Latin America Market Value (USD Billion) Forecast by By End user, 2020-2035
  • Table 30: Latin America Market Volume (Units) Forecast by By End user, 2020-2035
  • Table 31: Europe Market Value (USD Billion) Forecast by Country, 2020-2035
  • Table 32: Europe Market Volume (Units) Forecast by Country, 2020-2035
  • Table 33: Europe Market Value (USD Billion) Forecast by By Material, 2020-2035
  • Table 34: Europe Market Volume (Units) Forecast by By Material, 2020-2035
  • Table 35: Europe Market Value (USD Billion) Forecast by By Capacity, 2020-2035
  • Table 36: Europe Market Volume (Units) Forecast by By Capacity, 2020-2035
  • Table 37: Europe Market Value (USD Billion) Forecast by By Application, 2020-2035
  • Table 38: Europe Market Volume (Units) Forecast by By Application, 2020-2035
  • Table 39: Europe Market Value (USD Billion) Forecast by By End user, 2020-2035
  • Table 40: Europe Market Volume (Units) Forecast by By End user, 2020-2035
  • Table 41: East Asia Market Value (USD Billion) Forecast by Country, 2020-2035
  • Table 42: East Asia Market Volume (Units) Forecast by Country, 2020-2035
  • Table 43: East Asia Market Value (USD Billion) Forecast by By Material, 2020-2035
  • Table 44: East Asia Market Volume (Units) Forecast by By Material, 2020-2035
  • Table 45: East Asia Market Value (USD Billion) Forecast by By Capacity, 2020-2035
  • Table 46: East Asia Market Volume (Units) Forecast by By Capacity, 2020-2035
  • Table 47: East Asia Market Value (USD Billion) Forecast by By Application, 2020-2035
  • Table 48: East Asia Market Volume (Units) Forecast by By Application, 2020-2035
  • Table 49: East Asia Market Value (USD Billion) Forecast by By End user, 2020-2035
  • Table 50: East Asia Market Volume (Units) Forecast by By End user, 2020-2035
  • Table 51: South Asia Market Value (USD Billion) Forecast by Country, 2020-2035
  • Table 52: South Asia Market Volume (Units) Forecast by Country, 2020-2035
  • Table 53: South Asia Market Value (USD Billion) Forecast by By Material, 2020-2035
  • Table 54: South Asia Market Volume (Units) Forecast by By Material, 2020-2035
  • Table 55: South Asia Market Value (USD Billion) Forecast by By Capacity, 2020-2035
  • Table 56: South Asia Market Volume (Units) Forecast by By Capacity, 2020-2035
  • Table 57: South Asia Market Value (USD Billion) Forecast by By Application, 2020-2035
  • Table 58: South Asia Market Volume (Units) Forecast by By Application, 2020-2035
  • Table 59: South Asia Market Value (USD Billion) Forecast by By End user, 2020-2035
  • Table 60: South Asia Market Volume (Units) Forecast by By End user, 2020-2035
  • Table 61: Oceania Market Value (USD Billion) Forecast by Country, 2020-2035
  • Table 62: Oceania Market Volume (Units) Forecast by Country, 2020-2035
  • Table 63: Oceania Market Value (USD Billion) Forecast by By Material, 2020-2035
  • Table 64: Oceania Market Volume (Units) Forecast by By Material, 2020-2035
  • Table 65: Oceania Market Value (USD Billion) Forecast by By Capacity, 2020-2035
  • Table 66: Oceania Market Volume (Units) Forecast by By Capacity, 2020-2035
  • Table 67: Oceania Market Value (USD Billion) Forecast by By Application, 2020-2035
  • Table 68: Oceania Market Volume (Units) Forecast by By Application, 2020-2035
  • Table 69: Oceania Market Value (USD Billion) Forecast by By End user, 2020-2035
  • Table 70: Oceania Market Volume (Units) Forecast by By End user, 2020-2035
  • Table 71: MEA Market Value (USD Billion) Forecast by Country, 2020-2035
  • Table 72: MEA Market Volume (Units) Forecast by Country, 2020-2035
  • Table 73: MEA Market Value (USD Billion) Forecast by By Material, 2020-2035
  • Table 74: MEA Market Volume (Units) Forecast by By Material, 2020-2035
  • Table 75: MEA Market Value (USD Billion) Forecast by By Capacity, 2020-2035
  • Table 76: MEA Market Volume (Units) Forecast by By Capacity, 2020-2035
  • Table 77: MEA Market Value (USD Billion) Forecast by By Application, 2020-2035
  • Table 78: MEA Market Volume (Units) Forecast by By Application, 2020-2035
  • Table 79: MEA Market Value (USD Billion) Forecast by By End user, 2020-2035
  • Table 80: MEA Market Volume (Units) Forecast by By End user, 2020-2035

List of Figures

  • Figure 1: Global Market Volume (Units) Forecast 2020-2035
  • Figure 2: Global Market Pricing Analysis
  • Figure 3: Global Market Value (USD Billion) Forecast 2020-2035
  • Figure 4: Global Market Value Share and BPS Analysis by By Material, 2025 and 2035
  • Figure 5: Global Market Y-o-Y Growth Comparison by By Material, 2025-2035
  • Figure 6: Global Market Attractiveness Analysis by By Material
  • Figure 7: Global Market Value Share and BPS Analysis by By Capacity, 2025 and 2035
  • Figure 8: Global Market Y-o-Y Growth Comparison by By Capacity, 2025-2035
  • Figure 9: Global Market Attractiveness Analysis by By Capacity
  • Figure 10: Global Market Value Share and BPS Analysis by By Application, 2025 and 2035
  • Figure 11: Global Market Y-o-Y Growth Comparison by By Application, 2025-2035
  • Figure 12: Global Market Attractiveness Analysis by By Application
  • Figure 13: Global Market Value Share and BPS Analysis by By End user, 2025 and 2035
  • Figure 14: Global Market Y-o-Y Growth Comparison by By End user, 2025-2035
  • Figure 15: Global Market Attractiveness Analysis by By End user
  • Figure 16: Global Market Value (USD Billion) Share and BPS Analysis by Region, 2025 and 2035
  • Figure 17: Global Market Y-o-Y Growth Comparison by Region, 2025-2035
  • Figure 18: Global Market Attractiveness Analysis by Region
  • Figure 19: North America Market Incremental $ Opportunity, 2025-2035
  • Figure 20: Latin America Market Incremental $ Opportunity, 2025-2035
  • Figure 21: Europe Market Incremental $ Opportunity, 2025-2035
  • Figure 22: East Asia Market Incremental $ Opportunity, 2025-2035
  • Figure 23: South Asia Market Incremental $ Opportunity, 2025-2035
  • Figure 24: Oceania Market Incremental $ Opportunity, 2025-2035
  • Figure 25: MEA Market Incremental $ Opportunity, 2025-2035
  • Figure 26: North America Market Value Share and BPS Analysis by Country, 2025 and 2035
  • Figure 27: North America Market Value Share and BPS Analysis by By Material, 2025 and 2035
  • Figure 28: North America Market Y-o-Y Growth Comparison by By Material, 2025-2035
  • Figure 29: North America Market Attractiveness Analysis by By Material
  • Figure 30: North America Market Value Share and BPS Analysis by By Capacity, 2025 and 2035
  • Figure 31: North America Market Y-o-Y Growth Comparison by By Capacity, 2025-2035
  • Figure 32: North America Market Attractiveness Analysis by By Capacity
  • Figure 33: North America Market Value Share and BPS Analysis by By Application, 2025 and 2035
  • Figure 34: North America Market Y-o-Y Growth Comparison by By Application, 2025-2035
  • Figure 35: North America Market Attractiveness Analysis by By Application
  • Figure 36: North America Market Value Share and BPS Analysis by By End user, 2025 and 2035
  • Figure 37: North America Market Y-o-Y Growth Comparison by By End user, 2025-2035
  • Figure 38: North America Market Attractiveness Analysis by By End user
  • Figure 39: Latin America Market Value Share and BPS Analysis by Country, 2025 and 2035
  • Figure 40: Latin America Market Value Share and BPS Analysis by By Material, 2025 and 2035
  • Figure 41: Latin America Market Y-o-Y Growth Comparison by By Material, 2025-2035
  • Figure 42: Latin America Market Attractiveness Analysis by By Material
  • Figure 43: Latin America Market Value Share and BPS Analysis by By Capacity, 2025 and 2035
  • Figure 44: Latin America Market Y-o-Y Growth Comparison by By Capacity, 2025-2035
  • Figure 45: Latin America Market Attractiveness Analysis by By Capacity
  • Figure 46: Latin America Market Value Share and BPS Analysis by By Application, 2025 and 2035
  • Figure 47: Latin America Market Y-o-Y Growth Comparison by By Application, 2025-2035
  • Figure 48: Latin America Market Attractiveness Analysis by By Application
  • Figure 49: Latin America Market Value Share and BPS Analysis by By End user, 2025 and 2035
  • Figure 50: Latin America Market Y-o-Y Growth Comparison by By End user, 2025-2035
  • Figure 51: Latin America Market Attractiveness Analysis by By End user
  • Figure 52: Europe Market Value Share and BPS Analysis by Country, 2025 and 2035
  • Figure 53: Europe Market Value Share and BPS Analysis by By Material, 2025 and 2035
  • Figure 54: Europe Market Y-o-Y Growth Comparison by By Material, 2025-2035
  • Figure 55: Europe Market Attractiveness Analysis by By Material
  • Figure 56: Europe Market Value Share and BPS Analysis by By Capacity, 2025 and 2035
  • Figure 57: Europe Market Y-o-Y Growth Comparison by By Capacity, 2025-2035
  • Figure 58: Europe Market Attractiveness Analysis by By Capacity
  • Figure 59: Europe Market Value Share and BPS Analysis by By Application, 2025 and 2035
  • Figure 60: Europe Market Y-o-Y Growth Comparison by By Application, 2025-2035
  • Figure 61: Europe Market Attractiveness Analysis by By Application
  • Figure 62: Europe Market Value Share and BPS Analysis by By End user, 2025 and 2035
  • Figure 63: Europe Market Y-o-Y Growth Comparison by By End user, 2025-2035
  • Figure 64: Europe Market Attractiveness Analysis by By End user
  • Figure 65: East Asia Market Value Share and BPS Analysis by Country, 2025 and 2035
  • Figure 66: East Asia Market Value Share and BPS Analysis by By Material, 2025 and 2035
  • Figure 67: East Asia Market Y-o-Y Growth Comparison by By Material, 2025-2035
  • Figure 68: East Asia Market Attractiveness Analysis by By Material
  • Figure 69: East Asia Market Value Share and BPS Analysis by By Capacity, 2025 and 2035
  • Figure 70: East Asia Market Y-o-Y Growth Comparison by By Capacity, 2025-2035
  • Figure 71: East Asia Market Attractiveness Analysis by By Capacity
  • Figure 72: East Asia Market Value Share and BPS Analysis by By Application, 2025 and 2035
  • Figure 73: East Asia Market Y-o-Y Growth Comparison by By Application, 2025-2035
  • Figure 74: East Asia Market Attractiveness Analysis by By Application
  • Figure 75: East Asia Market Value Share and BPS Analysis by By End user, 2025 and 2035
  • Figure 76: East Asia Market Y-o-Y Growth Comparison by By End user, 2025-2035
  • Figure 77: East Asia Market Attractiveness Analysis by By End user
  • Figure 78: South Asia Market Value Share and BPS Analysis by Country, 2025 and 2035
  • Figure 79: South Asia Market Value Share and BPS Analysis by By Material, 2025 and 2035
  • Figure 80: South Asia Market Y-o-Y Growth Comparison by By Material, 2025-2035
  • Figure 81: South Asia Market Attractiveness Analysis by By Material
  • Figure 82: South Asia Market Value Share and BPS Analysis by By Capacity, 2025 and 2035
  • Figure 83: South Asia Market Y-o-Y Growth Comparison by By Capacity, 2025-2035
  • Figure 84: South Asia Market Attractiveness Analysis by By Capacity
  • Figure 85: South Asia Market Value Share and BPS Analysis by By Application, 2025 and 2035
  • Figure 86: South Asia Market Y-o-Y Growth Comparison by By Application, 2025-2035
  • Figure 87: South Asia Market Attractiveness Analysis by By Application
  • Figure 88: South Asia Market Value Share and BPS Analysis by By End user, 2025 and 2035
  • Figure 89: South Asia Market Y-o-Y Growth Comparison by By End user, 2025-2035
  • Figure 90: South Asia Market Attractiveness Analysis by By End user
  • Figure 91: Oceania Market Value Share and BPS Analysis by Country, 2025 and 2035
  • Figure 92: Oceania Market Value Share and BPS Analysis by By Material, 2025 and 2035
  • Figure 93: Oceania Market Y-o-Y Growth Comparison by By Material, 2025-2035
  • Figure 94: Oceania Market Attractiveness Analysis by By Material
  • Figure 95: Oceania Market Value Share and BPS Analysis by By Capacity, 2025 and 2035
  • Figure 96: Oceania Market Y-o-Y Growth Comparison by By Capacity, 2025-2035
  • Figure 97: Oceania Market Attractiveness Analysis by By Capacity
  • Figure 98: Oceania Market Value Share and BPS Analysis by By Application, 2025 and 2035
  • Figure 99: Oceania Market Y-o-Y Growth Comparison by By Application, 2025-2035
  • Figure 100: Oceania Market Attractiveness Analysis by By Application
  • Figure 101: Oceania Market Value Share and BPS Analysis by By End user, 2025 and 2035
  • Figure 102: Oceania Market Y-o-Y Growth Comparison by By End user, 2025-2035
  • Figure 103: Oceania Market Attractiveness Analysis by By End user
  • Figure 104: MEA Market Value Share and BPS Analysis by Country, 2025 and 2035
  • Figure 105: MEA Market Value Share and BPS Analysis by By Material, 2025 and 2035
  • Figure 106: MEA Market Y-o-Y Growth Comparison by By Material, 2025-2035
  • Figure 107: MEA Market Attractiveness Analysis by By Material
  • Figure 108: MEA Market Value Share and BPS Analysis by By Capacity, 2025 and 2035
  • Figure 109: MEA Market Y-o-Y Growth Comparison by By Capacity, 2025-2035
  • Figure 110: MEA Market Attractiveness Analysis by By Capacity
  • Figure 111: MEA Market Value Share and BPS Analysis by By Application, 2025 and 2035
  • Figure 112: MEA Market Y-o-Y Growth Comparison by By Application, 2025-2035
  • Figure 113: MEA Market Attractiveness Analysis by By Application
  • Figure 114: MEA Market Value Share and BPS Analysis by By End user, 2025 and 2035
  • Figure 115: MEA Market Y-o-Y Growth Comparison by By End user, 2025-2035
  • Figure 116: MEA Market Attractiveness Analysis by By End user
  • Figure 117: Global Market - Tier Structure Analysis
  • Figure 118: Global Market - Company Share Analysis

Frequently Asked Questions

What was the overall size of the paint bucket market in 2025?

The overall market size for the paint bucket market was USD 5.75 billion in 2025.

How big is the paint bucket market expected to be in 2035?

The paint bucket market is expected to reach USD 8.44 billion in 2035.

What will drive the demand for the paint bucket market during the forecast period?

The demand for paint buckets will be driven by increasing construction and renovation activities, rising demand for eco-friendly and recyclable packaging solutions, growing use of lightweight and durable plastic buckets, and advancements in tamper-proof and spill-resistant designs.

List the top 5 countries contributing to the paint bucket market.

The top 5 countries driving the development of the paint bucket market are the USA, China, Germany, India, and Brazil.

Which segment in type is expected to lead in the paint bucket market?

The plastic paint buckets segment is expected to command a significant share over the assessment period.

Explore Similar Insights

Future Market Insights

Paint Buckets Market