The global painting robots market is projected to reach USD 13.6 billion by 2035, recording an absolute increase of USD 8.1 billion over the forecast period. The market is valued at USD 5.4 billion in 2025 and is projected to grow at a CAGR of 9.6% during the forecast period. The overall market size is expected to grow by nearly 2.5 times during the same period, driven by increasing demand for automated painting solutions across the manufacturing industry, rising investments in artificial intelligence and machine learning integration, and the expanding adoption of environmental compliance technologies globally. As per Future Market Insights, part of New York’s Chamber of Commerce community, high initial investment costs and complex maintenance requirements may pose challenges to market expansion.
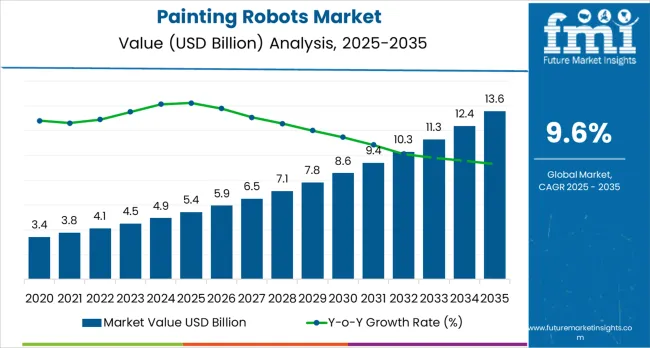
Between 2025 and 2030, the painting robots market is projected to expand from USD 5.4 billion to USD 8.67 billion, resulting in a value increase of USD 3.25 billion, which represents 40.1% of the total forecast growth for the decade. This phase of development will be shaped by rising demand for automated coating solutions in automotive manufacturing, product innovation in AI-powered robotic systems with advanced spray pattern optimization, as well as expanding integration with Industry 4.0 technologies and smart factory initiatives. Companies are establishing competitive positions through investment in intelligent painting platforms, explosion-proof robotic designs, and strategic market expansion across transportation, aerospace, and electronics manufacturing applications.
From 2030 to 2035, the market is forecast to grow from USD 8.67 billion to USD 13.6 billion, adding another USD 4.85 billion, which constitutes 59.9% of the overall ten-year expansion. This period is expected to be characterized by the expansion of specialized robotic systems, including advanced collaborative robot formulations and autonomous painting solutions tailored for complex geometries, strategic collaborations between robotics manufacturers and end-user industries, and an enhanced focus on environmental compliance and workplace safety. The growing emphasis on VOC emission reduction and eco-friendly coating technologies will drive demand for advanced, high-performance painting robot solutions across diverse industrial applications.
| Metric | Value |
|---|---|
| Market Value (2025) | USD 5.4 billion |
| Market Forecast Value (2035) | USD 13.6 billion |
| Forecast CAGR (2025-2035) | 9.6% |
The painting robots market grows by enabling manufacturers to achieve superior coating quality and operational efficiency in industrial painting applications, ranging from automotive assembly lines to aerospace component manufacturing facilities. Industrial manufacturers face mounting pressure to improve product quality and environmental compliance, with robotic painting solutions typically providing uniform surface coverage and reduced material waste compared to manual systems, making automated coating technologies essential for competitive manufacturing operations. The manufacturing industry's need for consistent finish quality creates demand for advanced robotic solutions that can minimize human exposure to hazardous chemicals, enhance operational safety, and ensure reliable performance across diverse production environments. Government initiatives promoting workplace safety and environmental protection drive adoption in automotive, electronics, and heavy machinery applications, where operational performance has a direct impact on product quality and regulatory compliance. However, high capital investment requirements and the complexity of achieving optimal performance across different coating materials may limit adoption rates among smaller manufacturers and developing regions with limited technical expertise.
The market is segmented by type, application, end-use sector, and region. By type, the market is divided into pedestal robots and robotic arms. Based on application, the market is categorized into atomizer and air gun systems. By end-use sector, the market covers transportation, consumer appliances, foundry and casting, furniture, textiles, construction, heavy engineering equipment, HVAC and refrigeration, sanitaryware, and others. Regionally, the market is divided into North America, Latin America, Western Europe, Eastern Europe, East Asia, South Asia Pacific, and Middle East &Africa.
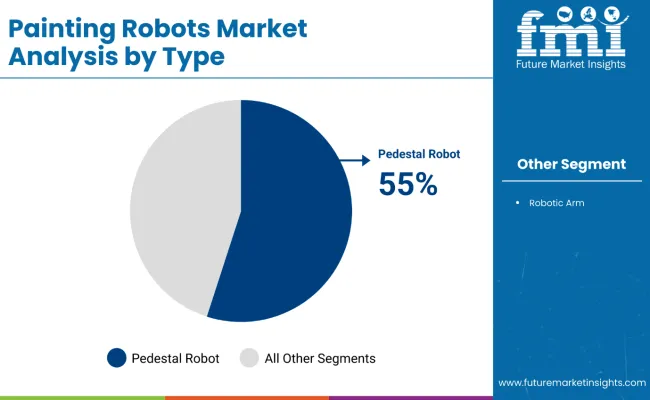
The pedestal robots segment represents the dominant force in the painting robots market, capturing approximately 55.0% of total market share in 2025. This advanced robot category encompasses systems featuring superior stability characteristics, including enhanced repeatability performance and optimized integration capabilities that enable superior operational reliability and enhanced coating consistency characteristics. The pedestal robots segment's market leadership stems from its exceptional performance capabilities in high-throughput production environments, with robots capable of handling large-surface coating applications while maintaining consistent spray patterns and operational precision across demanding manufacturing conditions.
The robotic arms segment maintains substantial market share, serving manufacturers who require flexible positioning solutions for complex geometries. These systems offer adaptable performance for irregular surfaces and confined spaces while providing sufficient capability to meet specialized coating requirements in precision manufacturing and customized applications.
Key technological advantages driving the pedestal robots segment include:
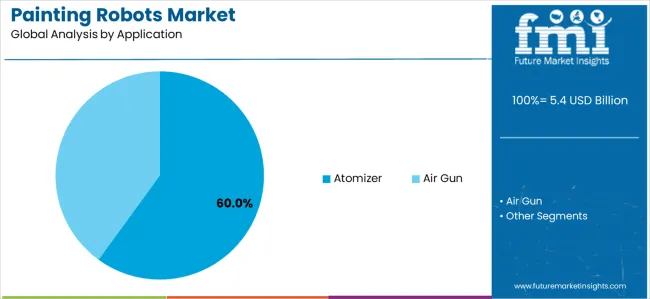
Atomizer applications demonstrate the strongest growth potential in the painting robots market with a CAGR of 60.0% through 2035, reflecting the critical role of fine spray control technologies in serving high-quality coating requirements and supporting advanced manufacturing initiatives. The atomizer segment's market leadership is reinforced by increasing demand for water-based and low-VOC coatings, standardized spray patterns, and rising demand for material transfer efficiency that directly correlates with environmental compliance and operational cost optimization.
The air gun segment represents significant market opportunity, capturing substantial market share through specialized requirements for heavy-duty coating applications, industrial maintenance operations, and general-purpose painting systems. This segment benefits from growing demand for versatile spray systems that meet standard performance requirements in less complex coating applications.
Key market dynamics supporting application growth include:
Transportation applications demonstrate the strongest growth potential in the painting robots market with a CAGR of 9.9% through 2035, reflecting the critical role of automotive and aerospace manufacturing in serving high-volume production requirements and supporting advanced coating initiatives. The transportation segment's market leadership is reinforced by increasing electric vehicle production, specialized coating requirements for lightweight materials, and rising demand for uniform finish quality that directly correlates with durability performance and aesthetic requirements.
The consumer appliances segment represents significant market opportunity, capturing substantial market share through specialized requirements for electronic devices, home appliances, and consumer goods manufacturing. This segment benefits from growing demand for high-quality surface finishes that meet stringent appearance standards in competitive consumer markets.
Key market dynamics supporting end-use growth include:
The market is driven by three concrete demand factors tied to manufacturing automation and quality optimization outcomes. First, industrial automation advancement and quality control requirements create increasing demand for consistent coating solutions, with manufacturers seeking uniform finish quality and reduced human error for maximum operational efficiency. Second, environmental regulations and workplace safety initiatives drive the adoption of robotic painting technologies, with companies seeking VOC emission reduction and worker protection enhancement through automated systems. Third, technological advancements in artificial intelligence and machine learning enable more effective and intelligent robotic solutions that optimize spray patterns while improving long-term performance and operational efficiency.
Market restraints include high initial investment costs that can impact project feasibility and return on investment calculations, particularly for smaller manufacturers with limited capital budgets for advanced automation equipment. Technical complexity in system integration and maintenance requirements poses another significant challenge, as achieving optimal performance across different coating materials and production environments requires specialized expertise and ongoing technical support, potentially causing implementation delays and increased operational costs. Skilled workforce availability and training requirements create additional challenges for manufacturers, demanding ongoing investment in technical capabilities and compliance with varying operational standards.
Key trends indicate accelerated adoption in emerging manufacturing sectors, particularly electronics, renewable energy, and construction applications, where quality requirements and production efficiency demands drive comprehensive robotic coating system development. Technology advancement trends toward collaborative robot integration with enhanced safety features, real-time monitoring capabilities, and adaptive spray control systems enable next-generation product development that addresses multiple performance requirements simultaneously. However, the market thesis could face disruption if alternative coating technologies or significant changes in manufacturing processes minimize reliance on traditional robotic painting solutions.
| Country | CAGR (2025-2035) |
|---|---|
| United States | 9.8% |
| Japan | 9.7% |
| South Korea | 9.6% |
| European Union | 9.5% |
| United Kingdom | 9.2% |
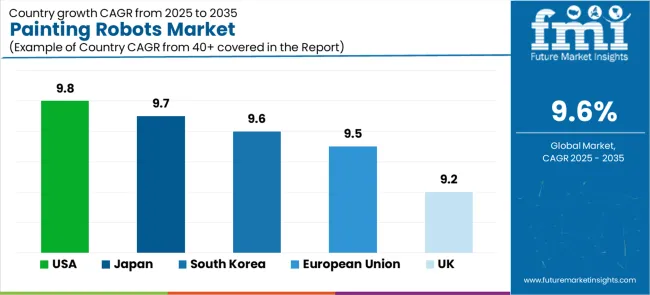
The painting robots market is gaining momentum worldwide, with the United States taking the lead thanks to extensive industrial automation programs and government-backed manufacturing modernization initiatives. Close behind, Japan benefits from growing robotics industry leadership and advanced manufacturing excellence, positioning itself as a strategic innovation hub in the East Asian region. South Korea shows strong advancement, where integration of smart factory technologies strengthens its role in the global manufacturing automation supply chains. The European Union is focusing on environmental compliance development and advanced manufacturing initiatives, signaling an ambition to capitalize on growing opportunities in green technology markets. Meanwhile, the United Kingdom stands out for its aerospace and automotive industry applications, recording consistent progress in industrial automation advancement. Together, the United States and Japan anchor the global expansion story, while the rest build stability and diversity into the market's growth path.
The report covers an in-depth analysis of 40+ countries;5 top-performing countries are highlighted below.
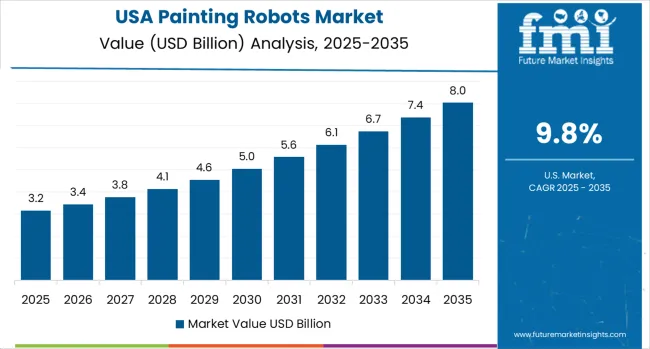
The United States demonstrates the strongest growth potential in the Painting Robots Market with a CAGR of 9.8% through 2035. The country's leadership position stems from extensive industrial automation projects, government-backed manufacturing competitiveness programs, and aggressive technological advancement targets, driving the adoption of advanced robotic painting systems. Growth is concentrated in major manufacturing regions, including Michigan, Ohio, Texas, and California, where automotive and aerospace companies are implementing advanced robotic solutions for enhanced production performance and regulatory compliance. Distribution channels through established automation suppliers and direct manufacturer relationships expand deployment across automotive assembly plants, electronics manufacturing facilities, and heavy machinery production centers. The country's manufacturing leadership strategy provides policy support for advanced automation development, including high-performance robotic system adoption.
Key market factors:
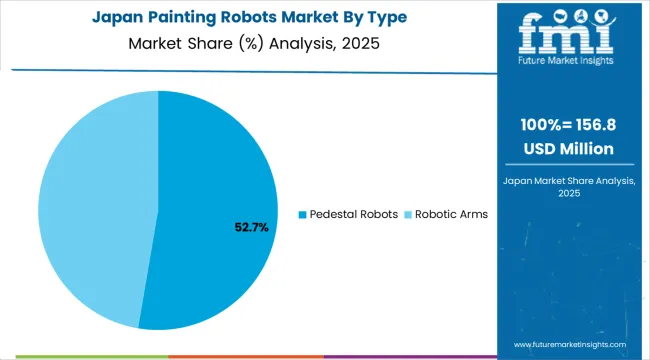
In Tokyo, Osaka, Nagoya, and Yokohama, the adoption of painting robot systems is accelerating across automotive manufacturing facilities and electronics production centers, driven by Industry 4.0 targets and government automation advancement initiatives. The market demonstrates strong growth momentum with a CAGR of 9.7% through 2035, linked to comprehensive manufacturing excellence expansion and increasing focus on operational efficiency solutions. Japanese manufacturers are implementing advanced robotic systems and AI-powered platforms to enhance coating performance while meeting growing demand for high-quality products in domestic and international markets. The country's robotics leadership programs create continued demand for high-performance automation solutions, while increasing emphasis on precision manufacturing drives adoption of advanced sensor technologies and intelligent control systems.
South Korea's advanced manufacturing industry demonstrates sophisticated implementation of painting robot systems, with documented case studies showing efficiency improvements in automotive and shipbuilding applications through optimized coating solutions. The country's industrial infrastructure in major manufacturing centers, including Seoul, Busan, Ulsan, and Gwangju, showcases integration of advanced robotic technologies with existing production systems, leveraging expertise in precision engineering and automation capabilities. Korean manufacturers emphasize quality consistency and operational efficiency, creating demand for high-performance robotic solutions that support export competitiveness initiatives and regulatory requirements. The market maintains strong growth through focus on smart factory development and manufacturing optimization, with a CAGR of 9.6% through 2035.
Key development areas:
The European Union's market expansion is driven by diverse manufacturing demand, including automotive production in Germany and France regions, aerospace development in Toulouse and Hamburg areas, and comprehensive industrial modernization across multiple manufacturing sectors. The region demonstrates promising growth potential with a CAGR of 9.5% through 2035, supported by environmental regulations and regional manufacturing competitiveness initiatives. European manufacturers face implementation challenges related to environmental compliance requirements and technical standardization, requiring advanced robotic solutions and regulatory alignment support. However, growing green manufacturing targets and industrial automation competitiveness requirements create compelling business cases for robotic system adoption, particularly in automotive and aerospace regions where operational efficiency has a direct impact on global competitiveness.
Market characteristics:
The United Kingdom's market leads in advanced aerospace applications based on integration with next-generation manufacturing technologies and sophisticated precision coating applications for enhanced performance characteristics. The country shows solid potential with a CAGR of 9.2% through 2035, driven by aerospace modernization programs and advanced manufacturing initiatives across major industrial regions, including West Midlands, North West England, Scotland, and Wales. British manufacturers are adopting advanced robotic systems for technology development and precision coating applications, particularly in regions with aerospace mandates and advanced manufacturing facilities requiring superior product differentiation. Technology deployment channels through established equipment distributors and direct manufacturer relationships expand coverage across aerospace manufacturing facilities and automotive production centers.
Leading market segments:
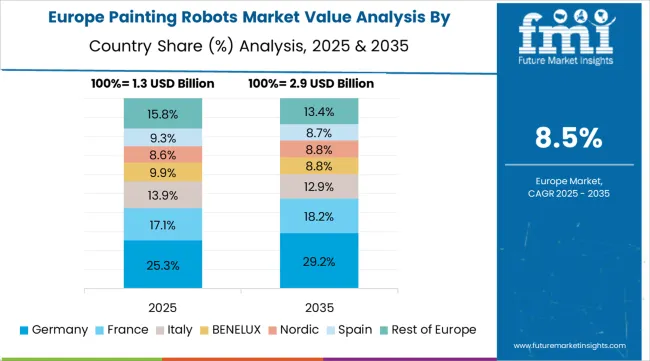
The painting robots market in Europe is projected to grow from USD 1.24 billion in 2025 to USD 2.87 billion by 2035, registering a CAGR of 8.7% over the forecast period. Germany is expected to maintain its leadership position with a 32.1% market share in 2025, declining slightly to 31.8% by 2035, supported by its extensive automotive manufacturing infrastructure and major industrial automation centers, including Bavaria, Baden-Württemberg, and North Rhine-Westphalia production facilities.
France follows with a 18.3% share in 2025, projected to reach 18.6% by 2035, driven by comprehensive aerospace development programs and advanced manufacturing initiatives implementing robotic technologies. Italy holds a 14.7% share in 2025, expected to maintain 14.5% by 2035 through ongoing industrial facility upgrades and precision manufacturing development. United Kingdom commands a 12.4% share, while Spain accounts for 9.8% in 2025. The Rest of Europe region is anticipated to gain momentum, expanding its collective share from 12.7% to 13.2% by 2035, attributed to increasing robotic adoption in Nordic countries and emerging Eastern European manufacturing facilities implementing advanced automation programs.
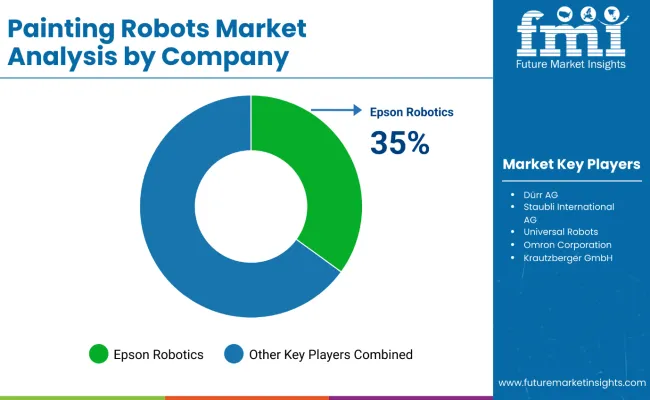
The painting robots market features approximately 12-15 meaningful players with moderate to high concentration, where the top five companies control roughly 45-50% of global market share through established technology platforms and extensive industrial automation relationships. Competition centers on technological innovation, coating precision, and comprehensive service capabilities rather than price competition alone.
Market leaders include ABB Ltd., FANUC Corporation, Yaskawa Electric Corporation, KUKA AG, and Kawasaki Heavy Industries Ltd., which maintain competitive advantages through comprehensive robotic solution portfolios, global service networks, and deep expertise in industrial automation sectors, creating high switching costs for customers. These companies leverage research and development capabilities and ongoing technical support relationships to defend market positions while expanding into adjacent automation applications and intelligent manufacturing solutions.
Challengers encompass Dürr AG, Epson Robotics, and Staubli International AG, which compete through specialized engineering solutions and strong regional presence in key manufacturing markets. Technology specialists, including Universal Robots, Comau S.p.A., and Hyundai Robotics, focus on specific robotic configurations or vertical applications, offering differentiated capabilities in collaborative systems, precision control, and specialized performance characteristics.
Regional players and emerging automation providers create competitive pressure through cost-effective solutions and rapid customization capabilities, particularly in high-growth markets including Asia-Pacific, automotive manufacturing, and electronics production regions, where local presence provides advantages in customer service and technical support. Market dynamics favor companies that combine advanced robotic technologies with comprehensive service offerings that address the complete automation lifecycle from system design through ongoing operational optimization.
Painting robots represent specialized industrial automation equipment that enables manufacturers to achieve superior coating quality and operational efficiency compared to manual systems, delivering enhanced finish consistency and worker safety with advanced spray control capabilities in demanding manufacturing applications. With the market projected to grow from USD 5.4 billion in 2025 to USD 13.6 billion by 2035 at a 9.6% CAGR, these robotic systems offer compelling advantages - enhanced coating precision, customizable spray configurations, and operational reliability - making them essential for automotive manufacturing, aerospace applications, and electronics production operations seeking alternatives to inefficient manual painting processes that compromise quality through inconsistent application techniques. Scaling market adoption and technological advancement requires coordinated action across manufacturing policy, automation standards development, robotics manufacturers, end-user industries, and automation technology investment capital.
How Governments Could Spur Local Production and Adoption?
How Industry Bodies Could Support Market Development?
How OEMs and Technology Players Could Strengthen the Ecosystem?
How Suppliers Could Navigate the Shift?
How Investors and Financial Enablers Could Unlock Value?
| Item | Value |
|---|---|
| Quantitative Units | USD 5.4 billion |
| Type | Pedestal Robots, Robotic Arms |
| Application | Atomizer, Air Gun |
| End Use Sector | Transportation, Consumer Appliances, Foundry &Casting, Furniture, Textiles, Construction, Heavy Engineering Equipment, HVAC &Refrigeration, Sanitaryware, Others |
| Regions Covered | North America, Latin America, Western Europe, Eastern Europe, East Asia, South Asia Pacific, Middle East &Africa |
| Country Covered | United States, Japan, South Korea, European Union, United Kingdom, and 40+ countries |
| Key Companies Profiled | ABB Ltd., FANUC Corporation, Yaskawa Electric Corporation, KUKA AG, Kawasaki Heavy Industries Ltd., Dürr AG, Epson Robotics, Staubli International AG, Universal Robots, Hyundai Robotics |
| Additional Attributes | Dollar sales by type and application categories, regional adoption trends across North America, East Asia, and Western Europe, competitive landscape with robotics providers and automation integrators, manufacturing facility requirements and specifications, integration with industrial automation and coating systems, innovations in robotic technology and AI systems, and development of specialized configurations with precision and reliability capabilities. |
The global painting robots market is estimated to be valued at USD 5.4 billion in 2025.
The market size for the painting robots market is projected to reach USD 13.6 billion by 2035.
The painting robots market is expected to grow at a 9.6% CAGR between 2025 and 2035.
The key product types in painting robots market are pedestal robots and robotic arms.
In terms of application, atomizer segment to command 60.0% share in the painting robots market in 2025.


Full Research Suite comprises of:
Market outlook & trends analysis
Interviews & case studies
Strategic recommendations
Vendor profiles & capabilities analysis
5-year forecasts
8 regions and 60+ country-level data splits
Market segment data splits
12 months of continuous data updates
DELIVERED AS:
PDF EXCEL ONLINE
Painting Tool Market Size and Share Forecast Outlook 2025 to 2035
Spray Painting Machine Market Size and Share Forecast Outlook 2025 to 2035
Automotive Robotic Painting Market
SLAM Robots Market Size and Share Forecast Outlook 2025 to 2035
Micro Robots Market Analysis - Size, Share, and Forecast Outlook 2025 to 2035
Delta Robots Market
Mobile Robots Market Size and Share Forecast Outlook 2025 to 2035
Pharma Robots Market Size and Share Forecast Outlook 2025 to 2035
Nuclear Robots Market Size and Share Forecast Outlook 2025 to 2035
Kitting Robots Market Size and Share Forecast Outlook 2025 to 2035
Milking Robots Market Size and Share Forecast Outlook 2025 to 2035
Airport Robots Market Size and Share Forecast Outlook 2025 to 2035
Security Robots Market Size and Share Forecast Outlook 2025 to 2035
Military Robots Market Size and Share Forecast Outlook 2025 to 2035
Surgical Robots Market
Pipetting Robots Market Size and Share Forecast Outlook 2025 to 2035
Logistics Robots Market Size and Share Forecast Outlook 2025 to 2035
Inspection Robots Market Size and Share Forecast Outlook 2025 to 2035
Dispensing Robots Market Size and Share Forecast Outlook 2025 to 2035
Palletizing Robots Market Size and Share Forecast Outlook 2025 to 2035

Thank you!
You will receive an email from our Business Development Manager. Please be sure to check your SPAM/JUNK folder too.
Chat With
MaRIA