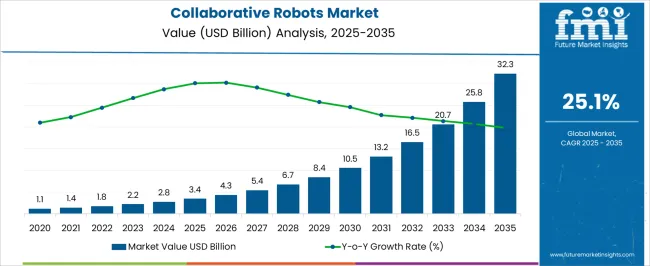
The Collaborative Robots Market is estimated to be valued at USD 3.4 billion in 2025 and is projected to reach USD 32.3 billion by 2035, registering a compound annual growth rate (CAGR) of 25.1% over the forecast period.
| Metric | Value |
|---|---|
| Collaborative Robots Market Estimated Value in (2025 E) | USD 3.4 billion |
| Collaborative Robots Market Forecast Value in (2035 F) | USD 32.3 billion |
| Forecast CAGR (2025 to 2035) | 25.1% |
The collaborative robots market is experiencing rapid momentum driven by the growing adoption of automation in manufacturing, advancements in robotics technology, and increasing emphasis on workplace safety and efficiency. The ability of collaborative robots to work alongside human operators without extensive safety barriers has broadened their deployment across small, medium, and large enterprises.
Cost effectiveness, ease of programming, and flexibility in performing multiple tasks are further enhancing their acceptance. Rising labor shortages, coupled with the need for consistent productivity in industrial environments, are supporting sustained adoption.
Continuous improvements in sensor technology, artificial intelligence integration, and cloud connectivity are paving the way for smarter and more adaptable collaborative robots. The future outlook remains highly positive as industries expand automation to meet global competitiveness and sustainability goals, reinforcing collaborative robots as a transformative force in modern production environments.
The market is segmented by Payload Capacity, Application, and End Use and region. By Payload Capacity, the market is divided into Up to 5kg, 5 to 10 kg, and Above 10 kg. In terms of Application, the market is classified into Welding, Material Handling, Quality Testing/Inspection, General Assembly, Painting/Spraying, and Others. Based on End Use, the market is segmented into Automotive & Transportation, Electronics & Semiconductors, Food & Beverage, Chemical & Pharmaceutical, Logistics, Healthcare, and Others. Regionally, the market is classified into North America, Latin America, Western Europe, Eastern Europe, Balkan & Baltic Countries, Russia & Belarus, Central Asia, East Asia, South Asia & Pacific, and the Middle East & Africa.
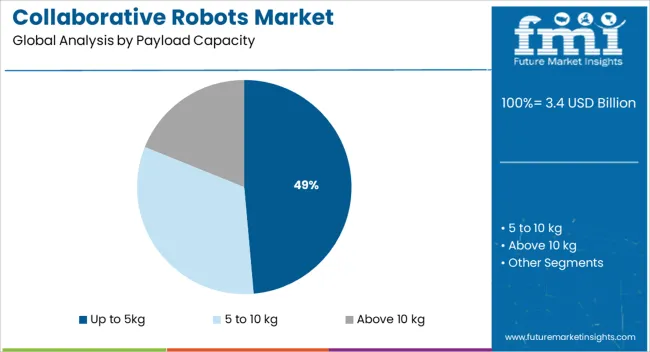
The up to 5kg payload capacity segment is projected to account for 48.60% of total market revenue by 2025, establishing it as the leading category. This dominance is attributed to its suitability for lightweight and precision oriented tasks such as assembly, material handling, and packaging.
The affordability and flexibility of these robots have encouraged their adoption among small and medium sized enterprises seeking scalable automation. Compact designs and ease of integration into existing production lines have further boosted their demand.
The balance between cost efficiency and task versatility has positioned this payload capacity range as the most widely adopted in collaborative robotics.
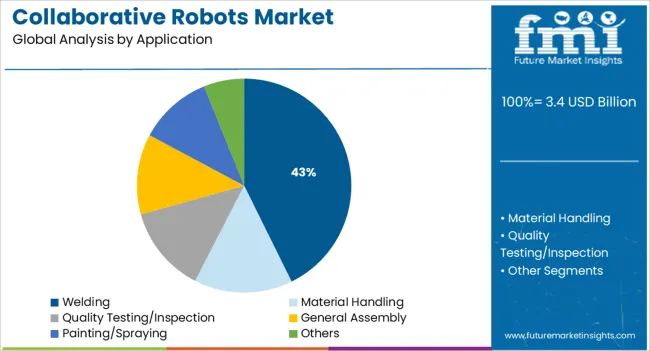
The welding application segment is expected to contribute 42.70% of overall market revenue by 2025, making it the leading application area. This growth is being driven by the rising need for precision, consistency, and efficiency in welding operations across diverse manufacturing industries.
Collaborative robots enable higher productivity by automating repetitive welding tasks while maintaining consistent quality. The reduction of human exposure to hazardous environments and integration with advanced vision systems have further strengthened adoption.
As manufacturers aim to improve efficiency while addressing skilled labor shortages, welding remains a critical application fueling collaborative robot deployment.
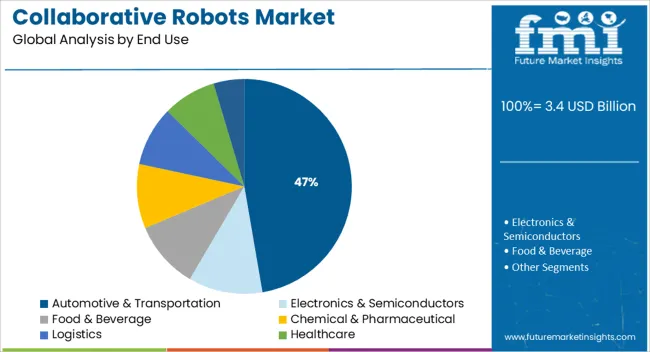
The automotive and transportation segment is estimated to hold 47.30% of market revenue by 2025, positioning it as the dominant end use. This leadership is supported by the industry’s early adoption of automation and strong reliance on robotic systems to streamline production lines.
Collaborative robots have been widely deployed for assembly, welding, painting, and inspection tasks, ensuring productivity while maintaining high quality standards. The push for electric vehicle manufacturing and increased demand for flexible automation solutions are further accelerating adoption.
With its strong focus on efficiency, scalability, and innovation, the automotive and transportation sector continues to anchor the expansion of the collaborative robots market.
In the global market, collaborative robot sales recorded stellar growth of 50.4% CAGR from the period 2020 to 2024. This market is anticipated to record a 26% CAGR rate from 2025 to 2035 according to FMI. There is an increase in the use of these robots for several industrial applications including material handling, inspection, and assembly/disassembly due to the attribute. Furthermore, there are a few other factors anticipated to fuel the demand for collaborative robot sales such as the increasing investments in assembly automation and the growing adoption from both small and medium enterprises. The market revenue is estimated to grow to USD 32.3 billion by 2035.
The high initial expenses of robots preclude most businesses from fully automating their processes using robots. The average selling price of a cobot ranges from USD 25,000 to USD 50,000, not including installation charges. Furthermore, there is a training expense connected with the robots, which limits the operators' willingness to integrate robots into their operating lines. The robotics market is hampered by the slow adoption of collaborative robotic systems by small and medium-sized businesses. High labor expenses, on the other hand, are expected to fuel the collaborative robot market throughout the projection period.
Robots are being used by numerous manufacturing activities around the area as technology progresses and applications become broader and adaptable. Collaborated robotics for automotive applications has seen a significant increase in recent years, owing to the growth of automotive plants in prominent economies of Asia Pacific such as China, India, and Vietnam, as well as increased demand for automotive robots from automakers in North America. Several famous automakers have deployed cobots on their manufacturing floors to do a variety of tasks such as welding, automobile painting, and assembly line operations.
| Country | United States |
|---|---|
| CAGR (2025 to 2035) | 18.5% |
| CAGR (2020 to 2025) | 28.9% |
| Country | Germany |
|---|---|
| CAGR (2025 to 2035) | 23.3% |
| CAGR (2020 to 2025) | 25.5% |
| Country | China |
|---|---|
| CAGR (2025 to 2035) | 28.8% |
| CAGR (2020 to 2025) | 40.4% |
| Country | Japan |
|---|---|
| CAGR (2025 to 2035) | 18.7% |
| CAGR (2020 to 2025) | 26.3% |
| Country | South Korea |
|---|---|
| CAGR (2025 to 2035) | 19% |
| CAGR (2020 to 2025) | 32.1% |
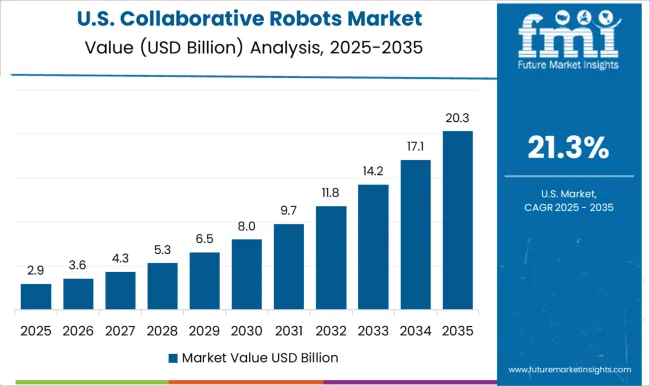
| Attributes | Details |
|---|---|
| United States Market Size (2035) | USD 1.4 billion |
| United States Market Absolute Dollar Growth (USD million/billion) | USD 1.1 billion |
The United States accounts for 18.5% of overall sales in North America, making it a substantial collaborative robots market. The collaborative robots market in the United States is expected to reach a high of USD 1.4 billion. Material handling is expected to account for the bulk of the global collaborative robot market because of its widespread adoption in a variety of end-use industries. Demand for high-speed and accurate work, for instance, is met by collaborative robots, which benefits the electronics and semiconductors industries on a huge scale.
Companies of all sizes are using industrial collaborative robots, or cobots, in their operations to alleviate labor difficulties, enhance productivity, and improve quality. A particular market player's OB7 collaborative robots are the simplest and most adaptable cobots for automating thousands of industrial production jobs across all sectors. Key automotive manufacturers have suggested intelligent factories, with the goal of increasing production flexibility through improved human-robot interaction.
Material handling cobots' skills are being enhanced by technological breakthroughs. Not only may human employees collaborate with material-handling cobots, but emerging exoskeleton technologies allow them to be worn by human workers. Humans wear full-body exoskeletons, which are designed to carry high weights of up to 200 pounds, to give additional strength and endurance for repetitive operations involving heavy equipment or components.
| Attributes | Details |
|---|---|
| Germany Market Size (2035) | USD 1.5 billion |
| Germany Market Absolute Dollar Growth (USD million/billion) | USD 1.3 billion |
Germany is a strong market, with a forecasted value of USD 1.5 billion and a revenue growth rate of 23.3% during the projection period. Cobots are precise, accurate, and dependable in Germany. The operating radius, weight, and floor area of the various versions vary. Therefore, they may be easily tailored to the specific application needs. Furthermore, they are simple to combine with other equipment, signifying a significant step toward developing an intelligent industrial environment in which humans and robots coexist.
Advances in digitalization and automation are expected to revolutionize welding manufacturing methods in the future. Welding using collaborative robots may relieve valued professionals of arduous regular and repetitive operations, especially when manually welding conventional sheet metal components. Moreover, project-specific gadgets are no longer required. A cobot, for instance, is employed as a universal assembly machine in German facilities, with a manually changing selection of tools such as vacuum grippers, potting dispensers, laminating rollers, or test stamps. The key benefit is that change-over periods for different customer-specific goods are incredibly quick.
Due to the advancements in sensors and programming, collaborative robot arms are becoming helpful for a variety of applications. In 2020, Han's Robot Germany GmbH, which branched out from Shenzhen Han's Robot Co., claimed to have built the world's first commercially viable cognitive robot. Han's Robot Germany's team, comprised of members of the Fraunhofer Association, the German Artificial Intelligence Research Center, and Hamburg Technical University, planned to complete the robot by 2024.
| Attributes | Details |
|---|---|
| China Market Size (2035) | USD 2.8 billion |
| China Market Absolute Dollar Growth (USD million/billion) | USD 10.9 billion |
Asia Pacific is an economic powerhouse for the collaborative robots market, with key corporations in China and South Korea. With a revenue share of 28.8%, China dominates and profits from the collaborative robots market. The market for collaborative robots in China is anticipated to be worth USD 2.8 billion. According to Interact Analysis, China's market share by shipments climbed by around 49.1% in 2024 and is predicted to augment to a stunning 54.4% in 2029. (At which point annual unit shipments may exceed 50,000).
The government intends to increase the number of robots in China. In December 2024, China's Ministry of Sector and Information Technology unveiled a five-year robotics strategy that intended for the country's robot industry to develop at a 20 percent yearly pace from 2024 to 2025. For the past eight years, China has been the world's dominant market for industrial robots. According to Wang Weiming, a ministry official, China intends to treble its manufacturing robot density by 2025.
China is strategically positioned to gain from cobots. Despite the fact that international robot manufacturers are well-entrenched and projected to maintain their market position, the cobot market is more level. With China's market leadership in AI, Chinese companies are well-positioned to dominate the domestic smart cobot industry in the next few years. According to analysts, the cobot supply chain/ecosystem is evolving considerably faster than other locations.
Making their products adaptable for new application situations is a significant emphasis for Chinese cobot companies right now. They are now experiencing a significant increase in collaborative robot utilization in the medical, education, logistics, and catering industries.
| Attributes | Details |
|---|---|
| South Korea Market Size (2035) | USD 1.1 billion |
| South Korea Market Absolute Dollar Growth (USD million/billion) | USD 964.2 million |
South Korea is a wildly profitable collaborative robots market, with a revenue growth rate of 19% and a projected value of USD 1.1 billion throughout the forecast period. In December 2020, a market participant constructed production facilities with an annual capacity of 20,000 units in Suwon, South Korea. The corporation is also extending its operations in China. Moreover, businesses are currently working on AI-powered collaborative robots. These can recognize speech and do clever picture analysis.
The South Korean government has resolved to increase the size of manufacturing in the domestic robot sector. Additionally, they are working hard to expand the various small and mid-sized robot manufacturers with sales of more than 50 billion (USD 45.93 million). To that goal, industry, academic, and research organizations are expected to work together to develop a plan to improve the robot industry. They have actively marketed the collaborative robot sector, which is commonly utilized in manufacturing. Moreover, they devised a medium and long-term development strategy to ensure competitiveness in essential robot components.
To establish the AI platform for robots, telecom firms, robot manufacturers, and research institutes are expected to form a committee for artificial intelligence (AI)-robot application and industrialization. According to several industry analysts, South Korea needs to enhance its robot industrial basis by revitalizing the market for collaborative robots and potential service robots. They can accomplish this by focusing on crucial part supply and proactively upgrading linked processes.
Start-up companies are participating in robotics technology alongside key industry players to contribute to the global collaborative robots market growth:
Ready Robotics - It is a manufacturer of collaborative robots as well as an operating system for controlling them. Its portfolio includes TaskMate, a modular, plug-and-play robotic arm coupled to a mobile base that can be moved about the plant and used to automate risky and repetitive activities. It can also save jobs for later and distribute them in minutes thanks to its own translation mechanism. The firm also provides an operating system that allows the user to operate the robot by chaining construction pieces together into flowcharts. Furthermore, it provides robots as a service, allowing firms to rapidly integrate and deploy a robotic automation system into production for a low monthly price.
Yang Tian Technology - It provides collaborative robotic products for industrial use. It offers a line of collaborative robots that claim to have a 6-DOF robot 6 modular structure design, combining hollow series arms and internal wiring to build light modular robots. It can be utilized in electronics, food, equipment, medicine, the military, automotive, and other sectors for handling, assembling, polishing, coating, monitoring, and screwing. In addition, the business offers a line of 5DoF parallel robots for material handling in industries.
ISYBOT - It develops collaborative robots for industrial purposes. The company has developed robots with three servo axes, a payload capacity, and a range of motion. The robot operates in four modes: help, restitution, parallelization, and teleoperation. The firm also offers the opportunity to hire robots for four to twelve months. Applications include material handling and project completion.
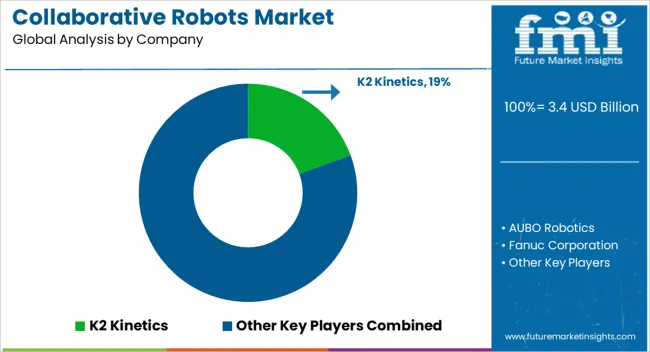
Due to the engagement of multiple established competitors, the collaborative robots market share is very competitive. Firms in the collaborative modular robotics industry frequently employ organic development strategies such as product releases and approvals. Market companies are focusing on expanding their presence through acquisitions, expansions, product approvals, and launches in order to leverage market growth potential.
The global collaborative robots market is estimated to be valued at USD 3.4 billion in 2025.
The market size for the collaborative robots market is projected to reach USD 32.3 billion by 2035.
The collaborative robots market is expected to grow at a 25.1% CAGR between 2025 and 2035.
The key product types in collaborative robots market are up to 5kg, 5 to 10 kg and above 10 kg.
In terms of application, welding segment to command 42.7% share in the collaborative robots market in 2025.


Our Research Products

The "Full Research Suite" delivers actionable market intel, deep dives on markets or technologies, so clients act faster, cut risk, and unlock growth.

The Leaderboard benchmarks and ranks top vendors, classifying them as Established Leaders, Leading Challengers, or Disruptors & Challengers.

Locates where complements amplify value and substitutes erode it, forecasting net impact by horizon

We deliver granular, decision-grade intel: market sizing, 5-year forecasts, pricing, adoption, usage, revenue, and operational KPIs—plus competitor tracking, regulation, and value chains—across 60 countries broadly.

Spot the shifts before they hit your P&L. We track inflection points, adoption curves, pricing moves, and ecosystem plays to show where demand is heading, why it is changing, and what to do next across high-growth markets and disruptive tech

Real-time reads of user behavior. We track shifting priorities, perceptions of today’s and next-gen services, and provider experience, then pace how fast tech moves from trial to adoption, blending buyer, consumer, and channel inputs with social signals (#WhySwitch, #UX).

Partner with our analyst team to build a custom report designed around your business priorities. From analysing market trends to assessing competitors or crafting bespoke datasets, we tailor insights to your needs.
Supplier Intelligence
Discovery & Profiling
Capacity & Footprint
Performance & Risk
Compliance & Governance
Commercial Readiness
Who Supplies Whom
Scorecards & Shortlists
Playbooks & Docs
Category Intelligence
Definition & Scope
Demand & Use Cases
Cost Drivers
Market Structure
Supply Chain Map
Trade & Policy
Operating Norms
Deliverables
Buyer Intelligence
Account Basics
Spend & Scope
Procurement Model
Vendor Requirements
Terms & Policies
Entry Strategy
Pain Points & Triggers
Outputs
Pricing Analysis
Benchmarks
Trends
Should-Cost
Indexation
Landed Cost
Commercial Terms
Deliverables
Brand Analysis
Positioning & Value Prop
Share & Presence
Customer Evidence
Go-to-Market
Digital & Reputation
Compliance & Trust
KPIs & Gaps
Outputs
Full Research Suite comprises of:
Market outlook & trends analysis
Interviews & case studies
Strategic recommendations
Vendor profiles & capabilities analysis
5-year forecasts
8 regions and 60+ country-level data splits
Market segment data splits
12 months of continuous data updates
DELIVERED AS:
PDF EXCEL ONLINE
Collaborative Manufacturing Robots Market Size and Share Forecast Outlook 2025 to 2035
Collaborative Authoring Tools Market Size and Share Forecast Outlook 2025 to 2035
Collaborative Customer Interfaces Market Analysis and Forecast 2025 to 2035, By Deployment Type, Type of User, End Use, and Region
Social Software As A Collaborative ERP Tool Market
SLAM Robots Market Size and Share Forecast Outlook 2025 to 2035
Micro Robots Market Analysis - Size, Share, and Forecast Outlook 2025 to 2035
Delta Robots Market
Mobile Robots Market Size and Share Forecast Outlook 2025 to 2035
Pharma Robots Market Size and Share Forecast Outlook 2025 to 2035
Nuclear Robots Market Size and Share Forecast Outlook 2025 to 2035
Kitting Robots Market Size and Share Forecast Outlook 2025 to 2035
Milking Robots Market Size and Share Forecast Outlook 2025 to 2035
Airport Robots Market Size and Share Forecast Outlook 2025 to 2035
Painting Robots Market Size and Share Forecast Outlook 2025 to 2035
Security Robots Market Size and Share Forecast Outlook 2025 to 2035
Military Robots Market Size and Share Forecast Outlook 2025 to 2035
Surgical Robots Market
Pipetting Robots Market Size and Share Forecast Outlook 2025 to 2035
Logistics Robots Market Size and Share Forecast Outlook 2025 to 2035
Inspection Robots Market Size and Share Forecast Outlook 2025 to 2035

Thank you!
You will receive an email from our Business Development Manager. Please be sure to check your SPAM/JUNK folder too.
Chat With
MaRIA