SLAM Robots Market Size and Share Forecast Outlook 2025 to 2035

The SLAM Robots Market is estimated to be valued at USD 363.6 million in 2025 and is projected to reach USD 3552.6 million by 2035, registering a compound annual growth rate (CAGR) of 25.6% over the forecast period.
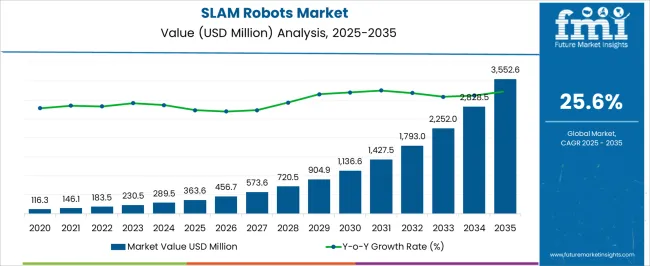
Quick Stats for SLAM Robots Market

  • SLAM Robots Market Industry Value (2025): USD 363.6 million
  • SLAM Robots Market Forecast Value (2035): USD 3552.6 million
  • SLAM Robots Market Forecast CAGR: 25.6%
  • Leading Segment in SLAM Robots Market in 2025: Graph-Based SLAM (41.5%)
  • Key Growth Region in SLAM Robots Market: North America, Asia-Pacific, Europe
  • Top Key Players in SLAM Robots Market: Kuka AG, Other Companies:, Flyability, Amazon, Apple, Microsoft, Intel Corporation, Clearpath Robotics Inc., Geoslam, Slamcore, Slamtec

Slam Robots Market Market Value Analysis

Metric Value
SLAM Robots Market Estimated Value in (2025 E) USD 363.6 million
SLAM Robots Market Forecast Value in (2035 F) USD 3552.6 million
Forecast CAGR (2025 to 2035) 25.6%

Rationale for Segmental Growth in the SLAM Robots Market

The SLAM robots market is advancing steadily as industries increasingly prioritize automation and precise spatial awareness. The rising adoption of robotics for navigation and mapping tasks, especially in complex environments, is being propelled by technological advancements in sensors and computing power.

The shift toward autonomous systems in sectors such as manufacturing, logistics, and service robotics is accelerating demand for efficient simultaneous localization and mapping solutions. Emerging trends indicate that improvements in algorithm accuracy and integration with AI are enabling SLAM robots to perform with higher reliability and adaptability.

Furthermore, growing investments in robotics research and expanding applications in indoor environments are expected to fuel future market growth. The focus on enhancing operational efficiency and reducing human intervention in navigation tasks is creating significant opportunities for innovation and deployment across various industries.

Segmental Analysis

The market is segmented by Offering and Application and region. By Offering, the market is divided into Graph-Based SLAM, EKF SLAM, and By Type. In terms of Application, the market is classified into Indoor Navigation, Unmanned Aerial Vehicle (UAV), Augmented Reality (AR)/Virtual Reality (VR), and Others. Regionally, the market is classified into North America, Latin America, Western Europe, Eastern Europe, Balkan & Baltic Countries, Russia & Belarus, Central Asia, East Asia, South Asia & Pacific, and the Middle East & Africa.
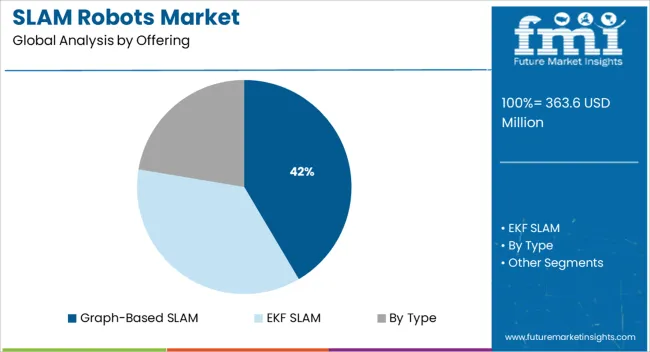
Insights into the Graph Based SLAM Offering Segment

Slam Robots Market Analysis By Offering

The graph based SLAM segment is anticipated to command 41.5% of the total market revenue in 2025, establishing it as the leading offering. This position has been supported by its ability to efficiently manage complex spatial data through graph optimization techniques, which enhance the accuracy of mapping and localization in dynamic environments.

The robustness of graph based methods in handling loop closures and large-scale maps has made it a preferred choice for applications requiring precise navigation. Advancements in computational algorithms have further improved processing speed and resource efficiency, facilitating its deployment in resource-constrained robotic platforms.

The widespread adoption of graph based SLAM has also been reinforced by its compatibility with various sensor configurations and its adaptability across diverse operational scenarios, solidifying its dominance within the market.
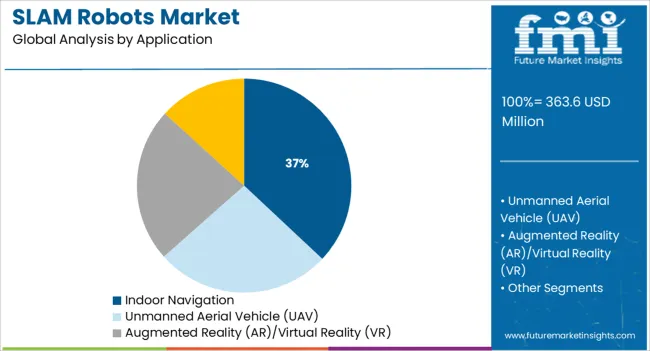
Insights into the Indoor Navigation Application Segment

Slam Robots Market Analysis By Application

In terms of application, indoor navigation is projected to hold 37.0% of the market revenue share in 2025, making it the foremost application segment. This leading share has been driven by the increasing use of SLAM robots in enclosed and GPS-denied environments such as warehouses, hospitals, and retail spaces.

The demand for autonomous navigation solutions that can operate reliably in complex indoor settings has necessitated sophisticated mapping and localization capabilities, which SLAM technology delivers effectively. Additionally, the growth of e-commerce and warehouse automation has intensified the need for efficient indoor robotic systems to optimize logistics and inventory management.

Indoor navigation applications benefit from advancements in sensor fusion and real-time data processing, which improve robot performance and safety, further establishing this segment’s preeminence in the market.

2020 to 2024 SLAM Robots Market Demand Outlook Compared to 2025 to 2035 Forecast

The SLAM Robots Market is estimated to grow at a CAGR of 25.3% for the forecast period compared to the historic CAGR for the period 2020 to 2025 of 18.2%.

Increasing utilization of automated robots across a variety of industry verticals is estimated to accelerate the adoption of SLAM robotics in the coming future. The use of SLAM robots for managing and transporting containers and packages of products is already a practice in large enterprises and developed countries, this technology could percolate into developing countries and small enterprises further during the forecast period.

Growth of Automation to Increase the Efficiency and Reduce the Operational Costs Is Accelerating the Adoption of SLAM Robots in Industrial Units

Companies and industries are relying more on technology to improve the output of their processes and reduce the errors that are caused by human workers, apart from that, automation software and devices assist human workers in improving the efficiency of their work. SLAM robots have various applications in the industrial sector that help in the improvement of operations, driving the market for SLAM robots.

Regional Analysis

The North American region is analyzed to dominate the global SLAM robot market with a share of 26.7%in 2025 and the South-Asia Pacific region is estimated to grow at the fastest rate with a CAGR of 27.8% during the forecast period of 2025 to 2035.

Growing applications of SLAM technology in defense, logistics, and industrial sectors combined with the presence of major market players namely Amazon Robotics and Apple are the key factors influencing the market dominance of the SLAM robot market in the North American region.

Rising trend towards industrial automation, increasing advancements in robotics, and the rising emphasis on the adoption of autonomous home appliances gadgets. These are some of the significant factors analyzed to positively impact the growth of the SLAM Robot Market in the South-Asia Pacific region in the coming years.
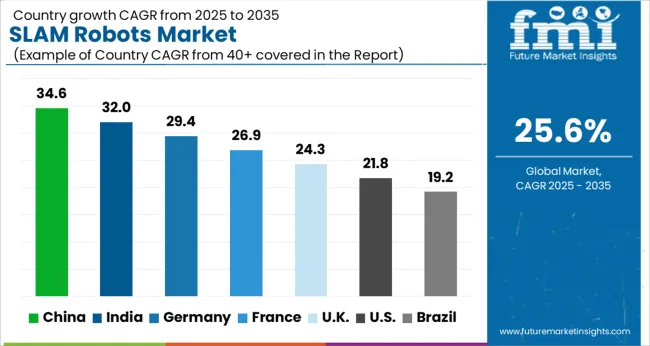
Country wise insights

Slam Robots Market Cagr Analysis By Country

Technological Advancement and Use in E-Commerce and Logistics Drive the Use of SLAM Robots in the USA

Due to technological advancements in the past, good infrastructure for the adoption of SLAM robots as most industries have already shifted to certain levels of automation, and so on, the United States was estimated to dominate the global SLAM robot market with a share of 15.7% in 2025.

Furthermore, rising potential applications for SLAM robots in the e-commerce industry, shopping malls, construction sites, healthcare, and other sectors are significant factors driving the country's high adoption rate.

Growth in the Use of Smart Home Appliances Allowing SLAM Robots Market to Grow in China

During the global pandemic of 2024, the adoption rate of robots and smart home appliances skyrocketed due to the increasing emphasis on contactless services and social distancing. Factors such as the widespread use of robots for targeted medicine delivery, sales, e-commerce, and surveillance are the key factors accelerating the adoption of SLAM Robots in China.

Due to these factors, the Chinese SLAM robot market is estimated to grow at a CAGR of 26.5% over the forecast period.

Government Initiatives Driving the Growth of the SLAM Robots Market in India

Increasing skill development initiatives, student scholarships for RD in the field of science and technology, as well as programs like AI for India, AI Ideathon, and Make in India are some of the key factors encouraging technological innovations in the development of advanced robotics in India, thus encouraging the development and adoption of SLAM robots in India and allowing the market to grow at a CAGR of 28.1% in India.

Category wise Insights

Why Graph-based SLAM Robots Have the Higher Market Share in the SLAM Robots Market by Type?

Graph-based SLAM Robots can be implemented at low cost with relatively inexpensive cameras and they can also be used for detecting landmarks thereby ensuring a high level of precision. Such factors are leading to the widespread adoption of graph-based SLAM technology in varied industry verticals, this technology can also be implemented for underwater exploration increasing its application for navigational purposes.

For these reasons, graph-based slam robots held the largest market share of 41.7% for 2025 by type.

Why Does Two Dimensional Segment Have the Larger Market Share by Offering for the SLAM Robots Market?

Based on the offerings the two-dimensional segment is analyzed to dominate the SLAM Robot Market with a share of 59.3% in 2025, owing to the factors such as increasing application of 2D sensors in various appliances, less complexity associated with the implementation of 2D SLAM technology as compared to the 3D SLAM technology and so on. Furthermore, 2D SLAM technology is being widely used in industrial robots for direction mapping, localization, and motion planning. These are the key factors behind the increased market share of 2D SLAM Robots.

Why the Augmented Reality (AR)/Virtual Reality (VR) has the Highest CAGR by Application?

SLAM Robots' market share for the Augmented Reality (AR)/Virtual Reality (VR) application is estimated to grow at the fastest rate with a CAGR of 28.9% during the forecast period of 2025 to 2035. Some factors behind this market growth are the growing use of SLAM technology in AR applications for object recognition and overlay digital interactive augmentations, along with the rising utilization of SLAM in autonomous robots, home appliances, machines, and so on.

Additionally, the inability of the GPS to provide a high level of precision and its failure to work in enclosed spaces have accelerated the adoption rate of SLAM robots for various applications. Such factors are expected to boost SLAM Robots' market share for Augmented Reality (AR) and Virtual Reality (VR) applications in the coming years.
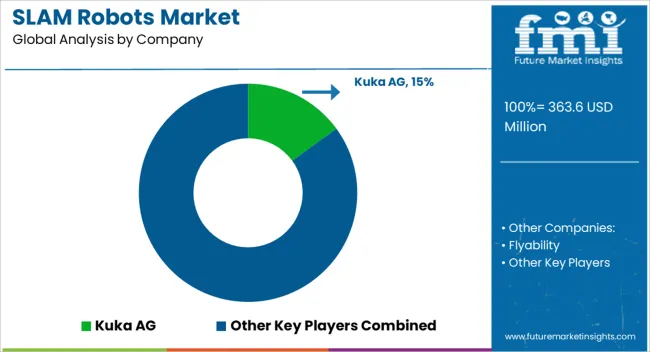
Competitive Landscape

Slam Robots Market Analysis By Company

Currently, the SLAM technology is being developed for robots among technology companies to improve the functioning of self-driving cars and unmanned aerial vehicles (UAV), the technology is also being developed for medical and surgical purposes.

  • In September 2025, ABB, a Swiss company launched Flexley mobile robots that are equipped with innovative visual simultaneous localization and mapping (SLAM) technology, which assists mobile robots in navigating environments that are constantly changing and complex. Such developments are positively impacting the growth of the SLAM robot market in the region.
  • In July 2025, Pudu Robotics, a Chinese company launched PuduBot 2 universal delivery robot. The robot uses laser and vision camera data to accurately maintain its location on the facility map, and it is outfitted with the company's own PUDU SLAM (Simultaneous Localization and Mapping) technology. Such developments are analyzed to fuel the growth of the SLAM robot market in the region.

Scope of report

Attribute Details
Market value in 2025 USD 363.6 million
Market CAGR 2025 to 2035 25.3%
Share of top 5 players Around 40%
Forecast Period 2025 to 2035
Historical Data Available for 2020 to 2025
Market Analysis USD Million for Value
Key Regions Covered North America; Latin America; Europe; South Asia & Pacific; East Asia; and the Middle East & Africa
Key Countries Covered USA, Canada, Germany, UK, France, Italy, Spain, Russia, China, Japan, South Korea, India, Australia & New Zealand, GCC Countries, Turkey, and South Africa
Key Segments Covered Type, Offering, Application, and Region
Key Companies Profiled Flyability; Amazon; Apple; Microsoft; Intel Corporation; Clearpath Robotics Inc.; Kuka AG; Geoslam; Slamcore; Slamtec
Report Coverage Market Forecast, Company Share Analysis, Competition Intelligence, DROT Analysis, Market Dynamics and Challenges, and Strategic Growth Initiatives
Customization & Pricing Available upon Request

SLAM Robots Market by Category

By Offering:

  • EKF SLAM
  • Graph-Based SLAM
  • By Type
    • 2D SLAM Robots
    • 3D SLAM Robots

By Application:

  • Indoor Navigation
  • Unmanned Aerial Vehicle (UAV)
  • Augmented Reality (AR)/Virtual Reality (VR)
  • Others

By Region:

  • North America
  • Latin America
  • Europe
  • East Asia
  • South Asia Pacific
  • Middle East Africa(MEA)

Table of Content

  1. Executive Summary
    • Global Market Outlook
    • Demand-side Trends
    • Supply-side Trends
    • Technology Roadmap Analysis
    • Analysis and Recommendations
  2. Market Overview
    • Market Coverage / Taxonomy
    • Market Definition / Scope / Limitations
  3. Market Background
    • Market Dynamics
      • Drivers
      • Restraints
      • Opportunity
      • Trends
    • Scenario Forecast
      • Demand in Optimistic Scenario
      • Demand in Likely Scenario
      • Demand in Conservative Scenario
    • Opportunity Map Analysis
    • Product Life Cycle Analysis
    • Supply Chain Analysis
    • Investment Feasibility Matrix
    • Value Chain Analysis
    • PESTLE and Porter’s Analysis
    • Regulatory Landscape
    • Regional Parent Market Outlook
    • Production and Consumption Statistics
    • Import and Export Statistics
  4. Global Market Analysis 2020 to 2024 and Forecast, 2025 to 2035
    • Historical Market Size Value (USD Million) Analysis, 2020 to 2024
    • Current and Future Market Size Value (USD Million) Projections, 2025 to 2035
      • Y-o-Y Growth Trend Analysis
      • Absolute $ Opportunity Analysis
  5. Global Market Pricing Analysis 2020 to 2024 and Forecast 2025 to 2035
  6. Global Market Analysis 2020 to 2024 and Forecast 2025 to 2035, By Offering
    • Introduction / Key Findings
    • Historical Market Size Value (USD Million) Analysis By Offering , 2020 to 2024
    • Current and Future Market Size Value (USD Million) Analysis and Forecast By Offering , 2025 to 2035
      • Graph-Based SLAM
      • EKF SLAM
      • By Type
    • Y-o-Y Growth Trend Analysis By Offering , 2020 to 2024
    • Absolute $ Opportunity Analysis By Offering , 2025 to 2035
  7. Global Market Analysis 2020 to 2024 and Forecast 2025 to 2035, By Application
    • Introduction / Key Findings
    • Historical Market Size Value (USD Million) Analysis By Application, 2020 to 2024
    • Current and Future Market Size Value (USD Million) Analysis and Forecast By Application, 2025 to 2035
      • Indoor Navigation
      • Unmanned Aerial Vehicle (UAV)
      • Augmented Reality (AR)/Virtual Reality (VR)
      • Others
    • Y-o-Y Growth Trend Analysis By Application, 2020 to 2024
    • Absolute $ Opportunity Analysis By Application, 2025 to 2035
  8. Global Market Analysis 2020 to 2024 and Forecast 2025 to 2035, By Region
    • Introduction
    • Historical Market Size Value (USD Million) Analysis By Region, 2020 to 2024
    • Current Market Size Value (USD Million) Analysis and Forecast By Region, 2025 to 2035
      • North America
      • Latin America
      • Western Europe
      • Eastern Europe
      • East Asia
      • South Asia and Pacific
      • Middle East & Africa
    • Market Attractiveness Analysis By Region
  9. North America Market Analysis 2020 to 2024 and Forecast 2025 to 2035, By Country
    • Historical Market Size Value (USD Million) Trend Analysis By Market Taxonomy, 2020 to 2024
    • Market Size Value (USD Million) Forecast By Market Taxonomy, 2025 to 2035
      • By Country
        • USA
        • Canada
        • Mexico
      • By Offering
      • By Application
    • Market Attractiveness Analysis
      • By Country
      • By Offering
      • By Application
    • Key Takeaways
  10. Latin America Market Analysis 2020 to 2024 and Forecast 2025 to 2035, By Country
    • Historical Market Size Value (USD Million) Trend Analysis By Market Taxonomy, 2020 to 2024
    • Market Size Value (USD Million) Forecast By Market Taxonomy, 2025 to 2035
      • By Country
        • Brazil
        • Chile
        • Rest of Latin America
      • By Offering
      • By Application
    • Market Attractiveness Analysis
      • By Country
      • By Offering
      • By Application
    • Key Takeaways
  11. Western Europe Market Analysis 2020 to 2024 and Forecast 2025 to 2035, By Country
    • Historical Market Size Value (USD Million) Trend Analysis By Market Taxonomy, 2020 to 2024
    • Market Size Value (USD Million) Forecast By Market Taxonomy, 2025 to 2035
      • By Country
        • Germany
        • UK
        • Italy
        • Spain
        • France
        • Nordic
        • BENELUX
        • Rest of Western Europe
      • By Offering
      • By Application
    • Market Attractiveness Analysis
      • By Country
      • By Offering
      • By Application
    • Key Takeaways
  12. Eastern Europe Market Analysis 2020 to 2024 and Forecast 2025 to 2035, By Country
    • Historical Market Size Value (USD Million) Trend Analysis By Market Taxonomy, 2020 to 2024
    • Market Size Value (USD Million) Forecast By Market Taxonomy, 2025 to 2035
      • By Country
        • Russia
        • Poland
        • Hungary
        • Balkan & Baltic
        • Rest of Eastern Europe
      • By Offering
      • By Application
    • Market Attractiveness Analysis
      • By Country
      • By Offering
      • By Application
    • Key Takeaways
  13. East Asia Market Analysis 2020 to 2024 and Forecast 2025 to 2035, By Country
    • Historical Market Size Value (USD Million) Trend Analysis By Market Taxonomy, 2020 to 2024
    • Market Size Value (USD Million) Forecast By Market Taxonomy, 2025 to 2035
      • By Country
        • China
        • Japan
        • South Korea
      • By Offering
      • By Application
    • Market Attractiveness Analysis
      • By Country
      • By Offering
      • By Application
    • Key Takeaways
  14. South Asia and Pacific Market Analysis 2020 to 2024 and Forecast 2025 to 2035, By Country
    • Historical Market Size Value (USD Million) Trend Analysis By Market Taxonomy, 2020 to 2024
    • Market Size Value (USD Million) Forecast By Market Taxonomy, 2025 to 2035
      • By Country
        • India
        • ASEAN
        • Australia & New Zealand
        • Rest of South Asia and Pacific
      • By Offering
      • By Application
    • Market Attractiveness Analysis
      • By Country
      • By Offering
      • By Application
    • Key Takeaways
  15. Middle East & Africa Market Analysis 2020 to 2024 and Forecast 2025 to 2035, By Country
    • Historical Market Size Value (USD Million) Trend Analysis By Market Taxonomy, 2020 to 2024
    • Market Size Value (USD Million) Forecast By Market Taxonomy, 2025 to 2035
      • By Country
        • Kingdom of Saudi Arabia
        • Other GCC Countries
        • Turkiye
        • South Africa
        • Other African Union
        • Rest of Middle East & Africa
      • By Offering
      • By Application
    • Market Attractiveness Analysis
      • By Country
      • By Offering
      • By Application
    • Key Takeaways
  16. Key Countries Market Analysis
    • USA
      • Pricing Analysis
      • Market Share Analysis, 2024
        • By Offering
        • By Application
    • Canada
      • Pricing Analysis
      • Market Share Analysis, 2024
        • By Offering
        • By Application
    • Mexico
      • Pricing Analysis
      • Market Share Analysis, 2024
        • By Offering
        • By Application
    • Brazil
      • Pricing Analysis
      • Market Share Analysis, 2024
        • By Offering
        • By Application
    • Chile
      • Pricing Analysis
      • Market Share Analysis, 2024
        • By Offering
        • By Application
    • Germany
      • Pricing Analysis
      • Market Share Analysis, 2024
        • By Offering
        • By Application
    • UK
      • Pricing Analysis
      • Market Share Analysis, 2024
        • By Offering
        • By Application
    • Italy
      • Pricing Analysis
      • Market Share Analysis, 2024
        • By Offering
        • By Application
    • Spain
      • Pricing Analysis
      • Market Share Analysis, 2024
        • By Offering
        • By Application
    • France
      • Pricing Analysis
      • Market Share Analysis, 2024
        • By Offering
        • By Application
    • India
      • Pricing Analysis
      • Market Share Analysis, 2024
        • By Offering
        • By Application
    • ASEAN
      • Pricing Analysis
      • Market Share Analysis, 2024
        • By Offering
        • By Application
    • Australia & New Zealand
      • Pricing Analysis
      • Market Share Analysis, 2024
        • By Offering
        • By Application
    • China
      • Pricing Analysis
      • Market Share Analysis, 2024
        • By Offering
        • By Application
    • Japan
      • Pricing Analysis
      • Market Share Analysis, 2024
        • By Offering
        • By Application
    • South Korea
      • Pricing Analysis
      • Market Share Analysis, 2024
        • By Offering
        • By Application
    • Russia
      • Pricing Analysis
      • Market Share Analysis, 2024
        • By Offering
        • By Application
    • Poland
      • Pricing Analysis
      • Market Share Analysis, 2024
        • By Offering
        • By Application
    • Hungary
      • Pricing Analysis
      • Market Share Analysis, 2024
        • By Offering
        • By Application
    • Kingdom of Saudi Arabia
      • Pricing Analysis
      • Market Share Analysis, 2024
        • By Offering
        • By Application
    • Turkiye
      • Pricing Analysis
      • Market Share Analysis, 2024
        • By Offering
        • By Application
    • South Africa
      • Pricing Analysis
      • Market Share Analysis, 2024
        • By Offering
        • By Application
  17. Market Structure Analysis
    • Competition Dashboard
    • Competition Benchmarking
    • Market Share Analysis of Top Players
      • By Regional
      • By Offering
      • By Application
  18. Competition Analysis
    • Competition Deep Dive
      • Kuka AG
        • Overview
        • Product Portfolio
        • Profitability by Market Segments (Product/Age /Sales Channel/Region)
        • Sales Footprint
        • Strategy Overview
          • Marketing Strategy
          • Product Strategy
          • Channel Strategy
      • Other Companies:
      • Flyability
      • Amazon
      • Apple
      • Microsoft
      • Intel Corporation
      • Clearpath Robotics Inc.
      • Geoslam
      • Slamcore
      • Slamtec
  19. Assumptions & Acronyms Used
  20. Research Methodology

List of Tables

  • Table 1: Global Market Value (USD Million) Forecast by Region, 2020-2035
  • Table 2: Global Market Value (USD Million) Forecast by Offering , 2020-2035
  • Table 3: Global Market Value (USD Million) Forecast by Application, 2020-2035
  • Table 4: North America Market Value (USD Million) Forecast by Country, 2020-2035
  • Table 5: North America Market Value (USD Million) Forecast by Offering , 2020-2035
  • Table 6: North America Market Value (USD Million) Forecast by Application, 2020-2035
  • Table 7: Latin America Market Value (USD Million) Forecast by Country, 2020-2035
  • Table 8: Latin America Market Value (USD Million) Forecast by Offering , 2020-2035
  • Table 9: Latin America Market Value (USD Million) Forecast by Application, 2020-2035
  • Table 10: Western Europe Market Value (USD Million) Forecast by Country, 2020-2035
  • Table 11: Western Europe Market Value (USD Million) Forecast by Offering , 2020-2035
  • Table 12: Western Europe Market Value (USD Million) Forecast by Application, 2020-2035
  • Table 13: Eastern Europe Market Value (USD Million) Forecast by Country, 2020-2035
  • Table 14: Eastern Europe Market Value (USD Million) Forecast by Offering , 2020-2035
  • Table 15: Eastern Europe Market Value (USD Million) Forecast by Application, 2020-2035
  • Table 16: East Asia Market Value (USD Million) Forecast by Country, 2020-2035
  • Table 17: East Asia Market Value (USD Million) Forecast by Offering , 2020-2035
  • Table 18: East Asia Market Value (USD Million) Forecast by Application, 2020-2035
  • Table 19: South Asia and Pacific Market Value (USD Million) Forecast by Country, 2020-2035
  • Table 20: South Asia and Pacific Market Value (USD Million) Forecast by Offering , 2020-2035
  • Table 21: South Asia and Pacific Market Value (USD Million) Forecast by Application, 2020-2035
  • Table 22: Middle East & Africa Market Value (USD Million) Forecast by Country, 2020-2035
  • Table 23: Middle East & Africa Market Value (USD Million) Forecast by Offering , 2020-2035
  • Table 24: Middle East & Africa Market Value (USD Million) Forecast by Application, 2020-2035

List of Figures

  • Figure 1: Global Market Pricing Analysis
  • Figure 2: Global Market Value (USD Million) Forecast 2020-2035
  • Figure 3: Global Market Value (USD Million) Share and BPS Analysis by Region, 2025 and 2035
  • Figure 4: Global Market Y-o-Y Growth Comparison by Region, 2025-2035
  • Figure 5: Global Market Attractiveness Analysis by Region
  • Figure 6: North America Market Incremental Dollar Opportunity, 2025-2035
  • Figure 7: Latin America Market Incremental Dollar Opportunity, 2025-2035
  • Figure 8: Western Europe Market Incremental Dollar Opportunity, 2025-2035
  • Figure 9: Eastern Europe Market Incremental Dollar Opportunity, 2025-2035
  • Figure 10: East Asia Market Incremental Dollar Opportunity, 2025-2035
  • Figure 11: South Asia and Pacific Market Incremental Dollar Opportunity, 2025-2035
  • Figure 12: Middle East & Africa Market Incremental Dollar Opportunity, 2025-2035
  • Figure 13: North America Market Value Share and BPS Analysis by Country, 2025 and 2035
  • Figure 14: Latin America Market Value Share and BPS Analysis by Country, 2025 and 2035
  • Figure 15: Western Europe Market Value Share and BPS Analysis by Country, 2025 and 2035
  • Figure 16: Eastern Europe Market Value Share and BPS Analysis by Country, 2025 and 2035
  • Figure 17: East Asia Market Value Share and BPS Analysis by Country, 2025 and 2035
  • Figure 18: South Asia and Pacific Market Value Share and BPS Analysis by Country, 2025 and 2035
  • Figure 19: Middle East & Africa Market Value Share and BPS Analysis by Country, 2025 and 2035
  • Figure 20: Global Market - Tier Structure Analysis
  • Figure 21: Global Market - Company Share Analysis

Frequently Asked Questions

How big is the slam robots market in 2025?

The global slam robots market is estimated to be valued at USD 363.6 million in 2025.

What will be the size of slam robots market in 2035?

The market size for the slam robots market is projected to reach USD 3,552.6 million by 2035.

How much will be the slam robots market growth between 2025 and 2035?

The slam robots market is expected to grow at a 25.6% CAGR between 2025 and 2035.

What are the key product types in the slam robots market?

The key product types in slam robots market are graph-based slam, ekf slam and by type.

Which application segment to contribute significant share in the slam robots market in 2025?

In terms of application, indoor navigation segment to command 37.0% share in the slam robots market in 2025.

Explore Similar Insights

Future Market Insights

SLAM Robots Market