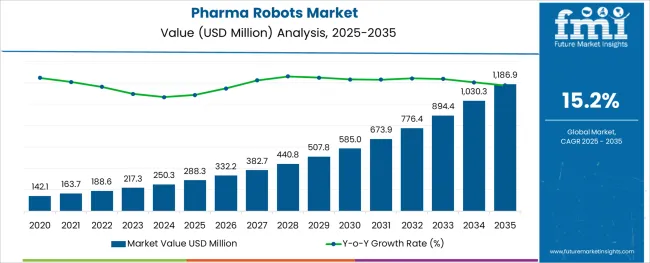
The Pharma Robots Market is estimated to be valued at USD 288.3 million in 2025 and is projected to reach USD 1186.9 million by 2035, registering a compound annual growth rate (CAGR) of 15.2% over the forecast period.
The pharma robots market is witnessing accelerated growth due to increasing demand for precision, speed, and contamination-free operations in pharmaceutical manufacturing and packaging. Stringent quality regulations and rising labor costs have driven the adoption of automation across both developed and emerging markets.
Pharma companies are investing in robotic systems to reduce human error, enhance throughput, and ensure consistent output, particularly in sterile and repetitive processes. Integration of robotics with vision systems, AI, and IoT platforms has improved real-time monitoring and efficiency in complex production environments.
Additionally, growing product diversity, personalized medicine, and frequent changeovers in packaging lines are compelling manufacturers to adopt robots for agile operations. As regulatory bodies emphasize traceability and hygiene compliance, robotic automation is becoming integral to competitive pharmaceutical production models.
The market is segmented by Robot Type, Application, and End Use and region. By Robot Type, the market is divided into Collaborative Pharma Robots and Traditional Robots. In terms of Application, the market is classified into Picking and Packaging, Inspection of Pharmaceutical Drugs, and Laboratory Applications. Based on End Use, the market is segmented into Picking and Packaging, Inspection of Pharmaceutical Drugs, and Laboratory Applications. Regionally, the market is classified into North America, Latin America, Western Europe, Eastern Europe, Balkan & Baltic Countries, Russia & Belarus, Central Asia, East Asia, South Asia & Pacific, and the Middle East & Africa.
The market is segmented by Robot Type, Application, and End Use and region. By Robot Type, the market is divided into Collaborative Pharma Robots and Traditional Robots. In terms of Application, the market is classified into Picking and Packaging, Inspection of Pharmaceutical Drugs, and Laboratory Applications. Based on End Use, the market is segmented into Picking and Packaging, Inspection of Pharmaceutical Drugs, and Laboratory Applications. Regionally, the market is classified into North America, Latin America, Western Europe, Eastern Europe, Balkan & Baltic Countries, Russia & Belarus, Central Asia, East Asia, South Asia & Pacific, and the Middle East & Africa.
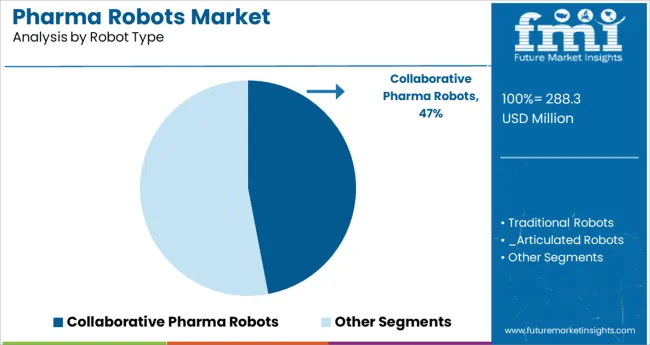
Collaborative pharma robots are projected to contribute 47.0% of total revenue in the market by 2025, making them the leading robot type. Their dominance is being driven by their ability to safely work alongside human operators, enabling hybrid workflows that enhance operational flexibility.
These robots have reduced the need for physical barriers and allowed automation in previously manual zones. Enhanced with force-limiting sensors and compact form factors, collaborative robots have proven suitable for cleanroom environments and tasks like material handling and machine tending.
Their ease of deployment, lower capital cost, and reprogrammability have made them a preferred choice for both small-batch production and scalable manufacturing operations. As pharma companies focus on lean manufacturing and process optimization, the role of collaborative robots is expected to strengthen further.
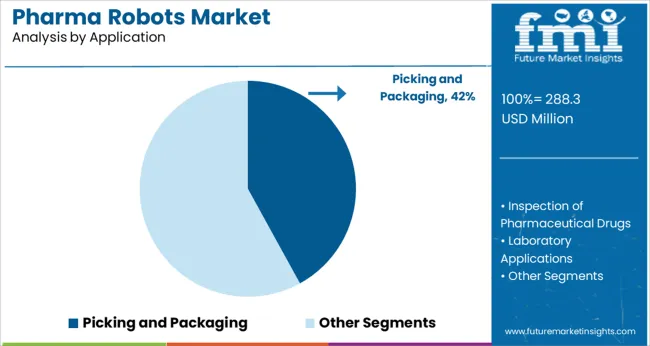
Picking and packaging is expected to account for 42.0% of the market’s revenue share in 2025, establishing it as the leading application. Growth in this segment is being fueled by the rising volume of small-format drug packaging, the need for high-speed sorting, and demand for accuracy in secondary packaging lines.
Robots are increasingly used to handle diverse packaging formats while ensuring consistency, especially in blister packing, labeling, and bundling. Automation in these functions has minimized human contact, reducing the risk of contamination and meeting stringent GMP requirements.
The scalability and repeatability of robots in this segment have supported the rapid expansion of pharmaceutical distribution networks, including for temperature-sensitive and high-value drugs. As personalized medicine gains momentum, demand for flexible robotic solutions in packaging operations is expected to continue growing.
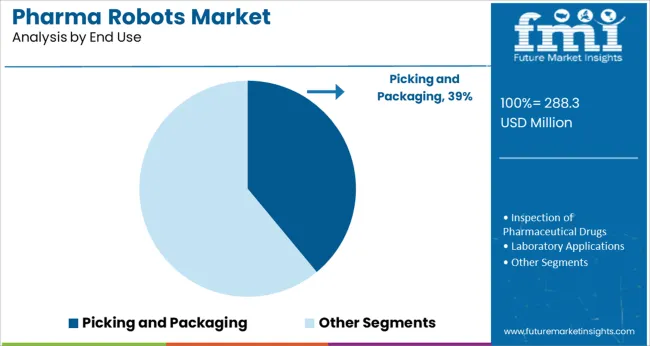
Picking and packaging also leads the end-use segmentation with a projected 39.0% revenue share in 2025. This end-use leadership is supported by the sector’s need for safe, sterile, and continuous operation environments where manual processes are prone to error or inefficiency.
Pharma companies have prioritized this function for robotic integration due to its high frequency, repetitive nature, and significant impact on downstream supply chain performance. Robotic systems are increasingly being used to streamline workflows in packaging rooms, integrate with serialization systems, and meet tight production timelines.
The ability to adapt to multiple SKUs without extensive retooling is also reinforcing robot adoption in this segment. As drug safety standards become stricter and consumer demand accelerates, automated picking and packaging operations will remain a key investment area for pharmaceutical manufacturers.
According to the manufacturer, new pharmaceutical robots can automate up to 80% of a pharmacy's oral solutions with precision for medicine and dosage, helping to save expenses and pharmaceutical mistakes. Such advantages have made the product indispensable for giant pharmaceutical companies making them the largest end-use vertical for the global pharma robots market.
Leading providers of pharmacy technology solutions are encouraging company expansion for improved patient outcomes. For instance, Parata Systems introduced Max 2, as a next-generation vial-filling robot, on October 10th, 2020. This robotic pharmacy system automates vial labeling, filling, and capping in an effort to improve efficiency and accommodate the demands of fast-paced pharmacies.
Integration of some advanced features by the key players has also increased the attractiveness of pharma robots in the smaller manufacturing units. For example, the recently developed Max 2 has various new improvements, including improved software with user-friendly navigation, color-coded LEDs that give visible cues to pharmacy group members, and vials that are replenished.
The Max 2 includes a verification camera that records the contents of each vial before capping, automatic drug cellular calibration for prompt and accurate
National Drug Code (NDC) updates, and a 2D barcode scanner that shortens the time required for manual NDC registration is another recent development that is poised to increase the usability of the product and create some further opportunities for the pharma robots market. Many new market participants are enthusiastically picking up these advantages to create a new client base in such a competitive market.
As per the Pharma Robots Market research by Future Market Insights - a market research and competitive intelligence provider, historically, from 2020 to 2024, market value of the Pharma Robots Market increased at around 11.1% CAGR.
High revenue is predicted due to the demand for high-quality drugs, which in turn increases the dependence of pharma companies on robots and automatic equipment. The benefit that robotics provides are lesser area utilization, reduced production downtime, improved health and safety, superior waste management, and improved production output and product quality.
The deployment of Robotics is expected to increase in the upcoming years, owing to the rising pharmaceutical business and numerous benefits given by Robotic automation.
In December 2024, Universal Robots launched a virtual pharma event, where managers, experts, and other professionals in the pharmaceutical and medical technology industries learned about the various possibilities that robots provide. Universal Robots sees a lot of promise in the pharmaceutical industry and is looking to conduct more such events, which is already generating a lot of buzz in the market.
Pharma Robots have the potential to boost productivity and it has the ability to reintroduce manufacturing production jobs to both developed countries like USA and UK and developing countries like China and India. Traditional Robots like Articulated and SCARA robots will be mainly used for production and packaging purposes. This has escalated the demand of robots for use in pharmaceutical manufacturing.
The drivers affecting the demand for pharmaceutical robots during the production period are an increase in the investments and funding in the robotics segment, succeeding pharmaceutical industries, and increased conferences, and exhibitions, like Sao Paulo Expo, where companies demonstrate their robots to the potential users and most importantly increase in the participation of the domestic economies towards robotics and artificial intelligence.
The other drivers motivating companies to adopt robotics are cost reduction, improved quality and high production volume.
In the Pharmaceutical sector, the usage of robotics has been on a continuous surge. Since robots can perform their tasks 3-4 times faster than humans and can be used for a longer time period, the global workforce in many fields is being substituted by robots. These characteristics enable them to produce large quantities in a short period of time which was especially required during Covid-19.
To improve the sustainability of its operations, the pharmaceutical industry has had to reduce waste and pollutants while also conserving energy. Robots can undoubtedly contribute to these goals, as the motors, drives, and gearboxes that power them have been found to be up to 95% energy efficient.
Because of robots' increased efficiency and dependability, there are fewer rejected products and wasted materials, saving millions of dollars. Furthermore, because each robot is made up of disposable components, cleaning costs, as well as the amount of water and chemicals consumed, are reduced, lowering carbon footprints.
Nowadays, Collaborative Robots (Cobots) are also being used in the pharmaceutical industry to ensure the safety of the workers. At Copenhagen University Hospital, Cobots are being used to improve care quality. Instead of providing patient care, Cobots are being used in the hospital's laboratory.
Universal Robots' UR5 robots help lab personnel in getting off from monotonous and time-consuming tasks. They sort about 7-8 samples per minute and about 3,000 tubes per day. A surveillance system can help with this. The samples are then sorted by color and placed in the appropriate compartment by the robots.
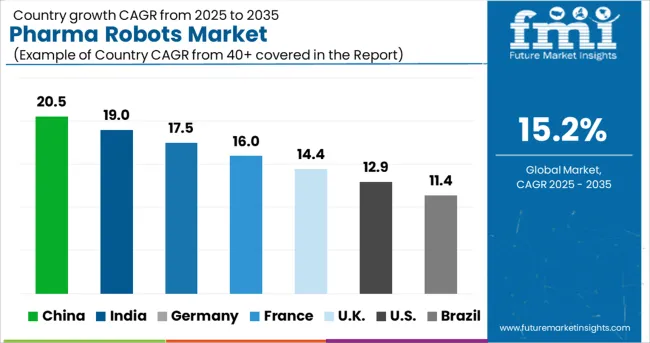
Asia Pacific is projected to account for the highest growth opportunity, where the market in countries like Japan, China and South Korea are predicted to account for a CAGR of 16.1%, 14.5% and 10.2%, respectively. It is mainly due to growing need for automation in the pharmaceutical industry in the region.
Another aspect supporting this market's growth is the minimization of errors due to human intervention. Adoption of such a pharmaceutical robots system result in immediate cost reductions in human labour, lowering production costs and promoting market expansion.
In China, more than 40 businesses have joined the medical robot market. Nearly half of them raised financing totalling more than USD 142.1 Million in 2020. The robotics in the pharmaceutical industry in the country is booming, owing to government incentives, a rapidly ageing population, rising personal incomes, and rapid technological improvement.
As a result, top pharmaceutical corporations with large production facilities in these nations are projected to drive the regional market forward.
The United States is expected to have the highest market share of USD 1186.9 Million by the end of 2035. This is mainly due to advancements in technology, increased investments in research and development, and the availability of skilled engineers and artificial intelligence experts.
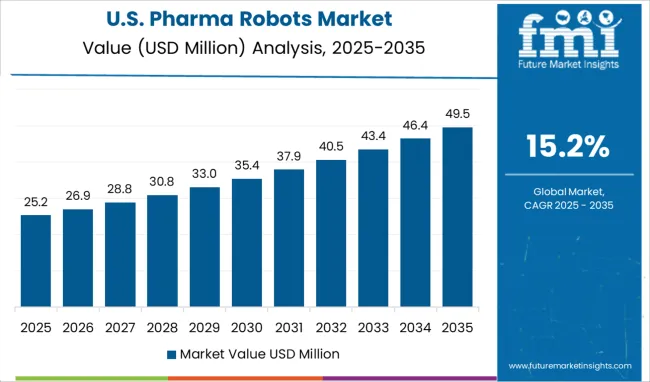
Because of the substantial presence of global pharmaceutical businesses in the United States, as well as the high adoption of production automation in this region, the market in North America is expected to develop at a significant rate.
The market through Traditional Robots are forecasted to grow at the highest CAGR of over 14.5% during 2025 to 2035. Due to the rise in the acceptance in material handling, picking and packaging, and inspection, traditional robots accounted for the largest revenue share of almost 65%, in 2024.
High precision, cleanliness, and authentication standards are required in the pharmaceutical industry, thus compelling them to use traditional robots, which are cost-effective as compared to collaborative robots. The precision of traditional robots, like articulated robots in pharmaceutical applications, is leading to the surge in their demand.
They can have both protected sleeves and sealed joints. These are crucial requirements for cleanroom devices. Pick and place, dispensing, and scanning are all common applications.
In 2024, the picking and packing division generated the most revenue of almost 55%, and is expected to expand at the highest rate throughout the projected period. The strong demand for customized packaging and the benefits connected with it, like fast speed, efficient tracking, and optimal floor space usage, are primarily responsible for this increase. Moreover, picking and packaging are the primary uses of all traditional robotic technologies.
The recent innovation in the picking and packaging segment is the four-axis SCARA robot, which is a popular type of pick-and-place robot. Due to their high speed and accuracy, these robots are commonly used in pick-and-place applications. They are securely fastened and fixed with the arm positioned on the z-axis. SCARA robots can also perform tasks such as sorting, dispensing, inspecting, assembling, and inserting objects.
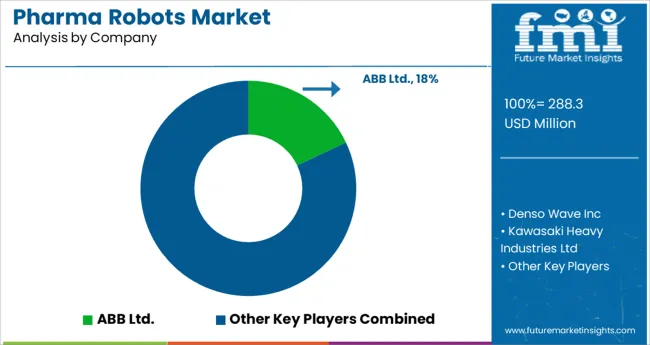
Players in the market are constantly developing improved analytical solutions as well as extending their product offerings. The providers of pharmaceutical robots are focused on alliances, technology collaborations, and product launch strategies.
Some of the recent developments of key Pharma Robots providers are as follows:
Similarly, recent developments related to companies’ pharmaceutical robots products have been tracked by the team at Future Market Insights, which are available in the full report.
| Attribute | Details |
|---|---|
| Forecast Period | 2025 to 2035 |
| Historical Data Available for | 2020 to 2024 |
| Market Analysis | million for Value |
| Key Regions Covered | North America; Latin America; Europe; Asia Pacific; Middle East & Africa |
| Key Countries Covered | United States, Canada, Brazil, Mexico, Germany, UK, France, Spain, Italy, Russia, China, Japan, South Korea, India, Australia, South Africa, Saudi Arabia, UAE and Israel. |
| Key Market Segments Covered | Product Type, Application, End-Use, Region |
| Key Companies Profiled |
ABB Ltd.; Universal Robots; Kawasaki Heavy Industries Ltd.; Yaskawa Electric Corporation; FANUC America Corporation; Marchesini Group S.P.A; Seiko Epson Corporation; Denso Wave Incorporation; Jianjia Robots |
| Pricing | Available upon Request |
The global pharma robots market is estimated to be valued at USD 288.3 million in 2025.
It is projected to reach USD 1,186.9 million by 2035.
The market is expected to grow at a 15.2% CAGR between 2025 and 2035.
The key product types are collaborative pharma robots, traditional robots, _articulated robots, _scara robots, _delta/parallel robots, _cartesian robots and _dual-arm robots.
picking and packaging segment is expected to dominate with a 42.0% industry share in 2025.


Full Research Suite comprises of:
Market outlook & trends analysis
Interviews & case studies
Strategic recommendations
Vendor profiles & capabilities analysis
5-year forecasts
8 regions and 60+ country-level data splits
Market segment data splits
12 months of continuous data updates
DELIVERED AS:
PDF EXCEL ONLINE
Pharmaceutical Zinc Powder Market Size and Share Forecast Outlook 2025 to 2035
Pharma Moisture Barrier Film Coating Market Size and Share Forecast Outlook 2025 to 2035
Pharmaceutical Grade Magnesium Sulfate Market Size and Share Forecast Outlook 2025 to 2035
Pharmaceutical Secondary Packaging Market Size and Share Forecast Outlook 2025 to 2035
Pharmaceutical Glass Packaging Market Size and Share Forecast Outlook 2025 to 2035
Pharmaceutical Manufacturing Equipment Market Forecast and Outlook 2025 to 2035
Pharma and Healthcare Social Media Marketing Market Size and Share Forecast Outlook 2025 to 2035
Pharmaceutical Plastic Bottle Market Forecast and Outlook 2025 to 2035
Pharmaceutical Grade Sodium Carbonate Market Forecast and Outlook 2025 to 2035
Pharmaceutical Industry Analysis in Saudi Arabia Forecast and Outlook 2025 to 2035
Pharmaceutical Packaging Market Size and Share Forecast Outlook 2025 to 2035
Pharmaceutical Grade Sodium Chloride Market Size and Share Forecast Outlook 2025 to 2035
Pharmaceutical Plastic Packaging Market Size and Share Forecast Outlook 2025 to 2035
Pharmaceutical Plastic Pots Market Size and Share Forecast Outlook 2025 to 2035
Pharmaceuticals Pouch Market Size and Share Forecast Outlook 2025 to 2035
Pharmaceutical Unit Dose Packaging Market Size and Share Forecast Outlook 2025 to 2035
Pharmaceutical Mini Batch Blender Market Size and Share Forecast Outlook 2025 to 2035
Pharma Sampling Valve Market Size and Share Forecast Outlook 2025 to 2035
Pharma Peeler Centrifuge Market Size and Share Forecast Outlook 2025 to 2035
Pharmaceutical Continuous Manufacturing Equipment Market Size and Share Forecast Outlook 2025 to 2035

Thank you!
You will receive an email from our Business Development Manager. Please be sure to check your SPAM/JUNK folder too.
Chat With
MaRIA