Reports

- Global Locations -

Headquarters

Future Market Insights, Inc.

Christiana Corporate, 200
Continental Drive, Suite 401,
Newark, Delaware - 19713,
United States

T: +1-845-579-5705

Americas

Future Market Insights, Inc.

616 Corporate Way, Suite 2-9018,
Valley Cottage, NY 10989, United States

T: +1-347-918-3531

MEA

Future Market Insights

1602-6 Jumeirah Bay X2 Tower, Plot No: JLT-PH2-X2A,
Jumeirah Lakes Towers, Dubai,
United Arab Emirates

Europe

Future Market Insights

3rd Floor, 207 Regent Street,
W1B 3HH London
United Kingdom

T: + 44 (0) 20 8123 9659
D: +44 (0) 20 3287 4268

Asia Pacific

Future Market Insights

IndiaLand Global Tech Park, Unit UG-1, Behind Grand HighStreet, Phase 1, Hinjawadi, MH, Pune – 411057, India

Spray Painting Machine Market Outlook (2023 to 2033)

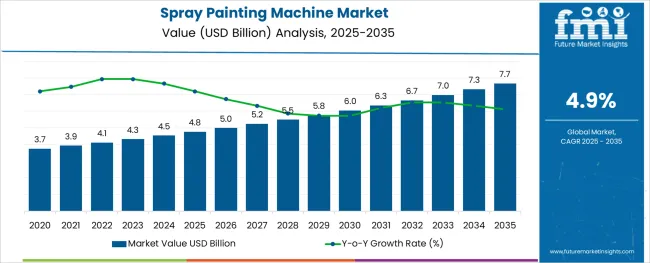
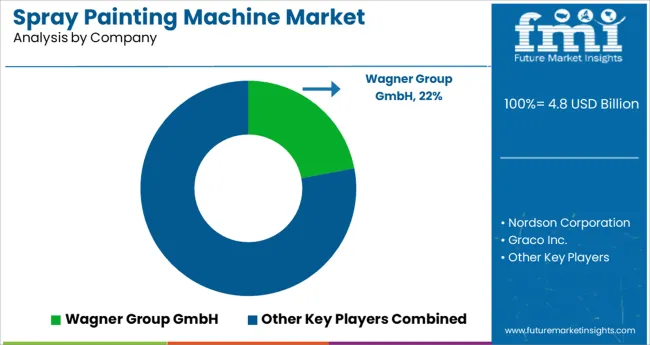
According to Future Market Insights research, during the projected period, the global spray painting machine market is expected to grow at a CAGR of 4.9%. The market value is projected to increase from US$ 4,325.4 million in 2023 to US$ 6,978.9 million by 2033.

Top market players claim that they benefit from their comprehensive expertise and many years of experience in coating technology for surface finishing. They offer innovative systems for wet paint and powder coating for industrial applications. To apply paint and plaster, craftsmen use their economical and reliable equipment in operation with various technologies such as ‘airless.’ These aspects are responsible for the future spray painting machine growth. Owing to their competence, the key players have been successful in developing a whole range of user-friendly renovation products, especially for DIY enthusiasts. Furthermore, they claim that their spray systems cover the widest range of applications due to their ideal units.

End users can achieve uniform coverage, in just one coat, with their wall paint spray systems to save drying time and avoid having to apply a second or third coat. This is expected to drive the sales of spray painting machine. Key players further provide a complete line of spray systems to dispense powder coatings, liquid coatings, adhesives, and sealants for a variety of applications. These include air-assist airless and airless technologies for liquid coatings, as well as dense-phase and tri-somatic technologies for powder coating. These devices deliver precise and stable power output with independent control of powder and air volumes for soft spray, superior application, tight process control, and significant power savings. These factors are evidently estimated to surge the adoption of spray painting machines.

Spray painting machines provide high-speed, precision application and optimal accuracy to ensure cost-efficient and quality manufacturing. The industrial applicators offered by key players use non-contact delivery for hygienic production, which is perfect for the nonwoven industry. Moreover, these machines deliver fine atomization and maximum reliability in high production, and their automated cleaning systems clear out nozzles without stopping the process. This is likely to surge the demand for spray painting machines. Almost every key company has a team of experts to guide their customers in choosing the accurate type of machine for their respective projects.

Furthermore, these sprayers and parts offered by the companies are designed to improve control and precision within the manufacturing processes, which facilitates the application of paint, powder, liquids, adhesives, and other materials more efficiently, which is likely to bolster the sales of spray painting machine in the forecast period. These machines offer accurate material regulation when it is important to operate spray guns at lower fluid pressures. End users can choose from fully-integrated industrial spraying systems to more advanced replacement components for industrial sprayer assembles.

Most market players are committed to professional contractors by designing high-performance sprayers that maximize productivity on the job. Hence, customers can choose from battery, electric, or gas-powered spray painting machines to grow their business and keep it profitable. These elements are estimated to propel the adoption of spray painting machines amongst various kinds of end users.

The spray guns deliver incredible performance using a very high-pressure pump to be able to work with a long hose length with powerful atomizing pressure, as well as a fast motor inversion to avoid pulsation. Additionally, the machines are also sustainable with full-sized wheels that prevent puncturing, along with an adapted sealing cartridge for a wider choice of material. All these factors are anticipated to drive product demand and expand the global spray painting machine market size.

Attributes Details
Market Size Value in 2023 US$ 4,325.4 million
Market Forecast Value in 2033 US$ 6,978.9 million
Global Growth Rate (2023 to 2033) 4.9% CAGR
Forecast Period 2023 to 2033
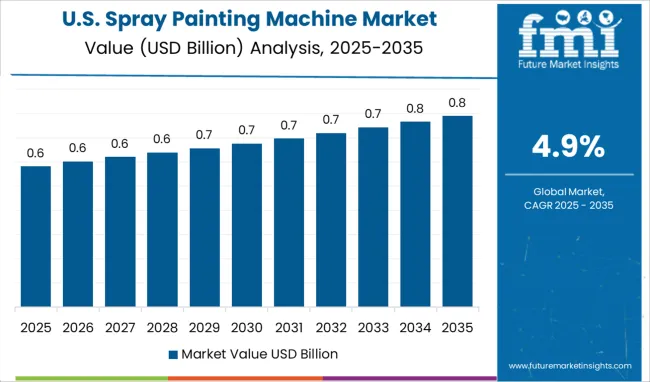
Market Share of USA 32.7%

Don't pay for what you don't need

Customize your report by selecting specific countries or regions and save 30%!

Introduction

The global Spray Painting Machine market was valued at US$ 4,325.4 million in 2023 and will reach US$ 6,978.9 million by the end of 2033, growing at a CAGR of 4.9% from 2023 to 2033.

A spray painting machine is a device that uses a compressed air system to atomize and deliver paint to a surface. The machine typically has a reservoir for paint, a compressor to generate the air pressure, and a nozzle through which the paint is sprayed.

Spray painting machines are used in a variety of applications, including automotive and industrial painting, powder coating, and general-purpose spraying. Automotive applications typically use electrostatic spray guns, which provide a more uniform paint finish. Industrial applications may use either electrostatic or air-assisted airless spray guns.

Spray Painting Machine Market

Historical Outlook vs Future Projections for Global Spray Painting Machine Market

The global spray painting machine market is forecast to reach US$ 3,248.1 million by 2017, according to a previous report by FMI. The market was valued at US$ 4,123.8 million in 2022 and is expected to grow at a CAGR of 4.9% during the forecast period.

The historical outlook for the spray painting machine market indicates that the market has shown steady growth in the past couple of years and is expected to continue on this growth trajectory in the coming years as well. The future projections for the global spray painting machine market are positive and indicate that the market will continue to grow at a healthy pace in the next few years.

Nandini Roy Choudhury

Principal Consultant

Talk to Analyst

Find your sweet spots for generating winning opportunities in this market.

Comparative Analysis of Adjacent Markets

Spray Painting Machine Market:

Attributes Spray Painting Machine Market
CAGR (2023 to 2033) 4.9%
Market Value (2033) US$ 6,978.9 million
Growth Factor Increasing deployment in the manufacturing sector, along with the rise in disposable income of people across the world.
Opportunity Manufacturers are engaged in producing spray painting machines that are lightweight, quickly cleanable, and include microprocessor-based controls.
Restraints These spraying equipment have high initial and maintenance costs. Moreover, if kept stagnant, it can result in poor performance in the future.

Dispensing Sprayers Market:

Attributes Dispensing Sprayers Market
CAGR (2023 to 2033) 4.1%
Market Value (2033) US$ 843.01 million
Growth Factor Used extensively in the fragrance industry, and limits the dispensing of the content which decreases the wastage of contents.
Opportunity Manufacturers are inclined toward developing these sprayers with convenient packaging and using product innovation and design to attract new customers.
Restraints Most of the dispensing sprayers are not refillable. Moreover, the disposal of used sprayers is a hassle and requires separate processes.

Painting Robots Market:

Attributes Painting Robots Market
CAGR (2023 to 2033) 10.1%
Market Value (2033) US$ 9.27 billion
Growth Factor Robots have eradicated health issues due to lead and VOC emissions by synthetic paints if planned by humans. Moreover, it can also be used to design construction sites.
Opportunity Advancements in artificial intelligence (AI) and sensor technology are making automation systems more adaptive and intelligent. Additionally, it boosts productivity and lowers unit costs.
Restraints Robotics technology is extremely expensive and is mostly deployed by large enterprises or OEMs.

Category-wise Insights

  • Airless Spraying Machines - By Product Type

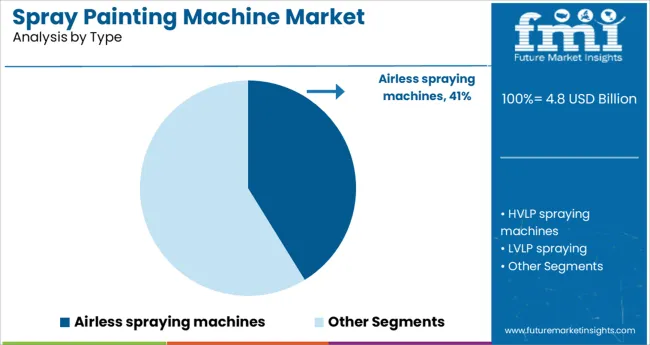
Airless spray painting machines provide a faster, more efficient way to paint than traditional methods. They can be used for a variety of projects, both large and small. Here are some benefits of using an airless spray painting machine:

  • Faster Painting Time - A typical paint job using a brush or roller can take several hours (or even days) to complete. With a spray painting machine, the job can be done in a fraction of the time.
  • Less Mess - Paintbrushes and rollers can leave behind a lot of mess. Spray painting machines minimize the amount of paint that is wasted and make cleaning up much easier.
  • Better Coverage - When using a brush or roller, it’s difficult to get an even coat of paint on your project. With a sprayer, you can achieve professional-looking results with fewer coats.
  • Food & Beverage Equipment Manufacturing Industry - By Application Type

In the food and beverage manufacturing industry, there are many different types of machinery and equipment that are used in production. One of the most important pieces of equipment is the spray painting machine. This type of machine is used to apply a variety of coatings to food and beverage products. The coatings can be applied for a variety of purposes, such as protection from spoilage, or to provide a decorative finish.

There are several reasons why the food and beverage manufacturing industry prefers spray painting machines. First, these machines are very versatile and can be used to apply a wide range of coatings. Second, spray painting machines are very efficient and can apply a coating very evenly. Finally, spray painting machines are relatively easy to operate and maintain.

Improving the Aesthetic look of Cars, Achieving a Blemish-free Surface & Other Aspects

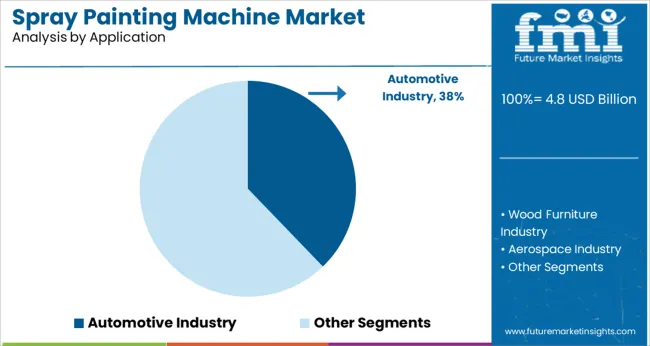
The adoption of spray painting machines is likely to rise owing to their intrinsic characteristics such as speed, even coating, and varied designs. Moreover, it is extensively being used in an increasing number of industrial units and penetration of passenger cars. In addition, consumers are deploying high-quality coating solutions to improve the aesthetic look of their cars which require the use of these machines.

The growing use of spray painting machines in the manufacturing sector is attributed to their use of machines to paint products, owing to much-desired advantages, such as quick painting, and blemish-free surface finish. Furthermore, the expanding construction sector is a macroeconomic driver, along with other end-use industries such as architecture (decorative) and OEMs.

Major market players are focusing on sustainable product development to enhance their presence in the global spray painting machine market share. Additionally, the increasing penetration of passenger cars is a significant factor raising the demand for the product from the automobile industry for spray painting machines. Moreover, rapid urbanization which surges construction projects is further likely to propel product demand.

High Pressure of this Equipment to Hinder Product Demand and Green Building Initiatives to Generate Market Opportunities

These spray painting machines require a lot of effort to clean. Moreover, good or industrial sprayers may have very high initial, as well as maintenance costs compared to rollers or brushers. In addition, the high pressure of this spraying equipment could be dangerous for the user. These factors are collectively expected to restrain market growth.

On the contrary, manufacturers are concentrating on using two types of production techniques, which are solvent-based and water-based technologies. Additionally, green building initiatives across various regions are likely to drive the demand for water-based paints in the forecast period. These factors are anticipated to influence manufacturers and generate creative market opportunities.
Get the data you need at a Fraction of the cost

Personalize your report by choosing insights you need
and save 40%!

Country-wise Insights

Growing Demand for Customized Vehicles in the USA

North America holds the largest share of the spray painting machine market which is attributed to the popular trend of do-it-yourself (DIY) activities for vehicle refurbishing activities and household purposes, along with the presence of major manufacturers. Moreover, there is a growing demand for customized vehicles in the region that involve the use of these paints to provide the desired aesthetic look.

Key players in the USA have decades of experience in portable airless spray painting machines and have been involved in innovation to deliver the high performance and maximum productivity required to grow businesses. Furthermore, the demand for spray painting machines is rising in the country since key players offer a configuration designed to meet the needs of small residential contractors to large contractors tackling various projects.

Market leaders in advanced paint applicators develop and market a wide array of painting and decorating products used in industrial fine finishing, home improvement, and commercial painting. Furthermore, they claim that their airless spray painting machines ensure a uniform and flawless coat of paint coverage on all surfaces for both interior and exterior painting tasks.

Customers can find spray painting machines with the highest-quality parts which are further backed by the industry’s leading warranty. Moreover, these machines are 100% factory-tested and field-proven. In addition, customers can further choose from electric, gas-powered, and battery-operated spray painting machines, according to their preference. This is likely to expand the global spray painting machine market size.

Architectural Industry in the United Kingdom and Soaring Investments in Real Estate

Europe holds the second largest share of the spray painting machine market owing to the proliferating architectural industry which is a potential driver for the growth of the demand for spray painting machines in this region. Additionally, robust economic growth, coupled with developments in the construction sector has major implications on the market size.

There have been soaring investments in real estate coupled with favorable government policies that have propelled the growth of the industry. Furthermore, new constructions have paved the way for the paint & coating market owing to the gateway opened by the European Central Bank’s ultra-low interest rates. These factors are estimated to surge the demand for spray painting machines.

Key players in the United Kingdom are offering high-efficiency airless spray painting machines for use with oil and water-based paints, varnishes, stains, and wood preservatives. Moreover, they are equipped with 360° spray orientation which allows for use on a multitude of projects, including hard-to-reach areas. In addition, they have adjustable flow rates and adequate spray pressure that allow precise regulation of the paint flow according to the task.

German manufacturers use robotic technology to produce spray painting machines

Germany is a remunerative spray painting machine market which is attributed to the presence of key manufacturers who are based in Germany and have their main production facilities in the country. Additionally, the market is competitive since the prices of these machines are kept low without compromising on their quality. Moreover, customers can choose from simple hand-held models to complex robotic systems.

German market players have generated innovative strategies for centuries for spray painting machines, individual components, and complete systems to coat surfaces and apply materials. Furthermore, they produce compact spray machines that are ideal for small work, and their wide range allows one to perform continuous work. In addition, they come equipped with special nozzles (SR) that are suitable for spot repairs on vehicles.

High precision application on these spray painting machines provides the perfect finishing touch to bases of color. Additionally, the machine body is refined with a chrome surface that is resistant to corrosion. Moreover, key players offer fast shipping, specialized advice catered to the end user’s specific requirements, as well as secure payments. These factors are expected to increase the sales of spray painting machines in this country.

Housing Schemes & Rising Disposable Income of Customers in India

India is a growing spray painting machine market owing to the significant growth of several industries such as automotive, construction, and electrical & electronics. Furthermore, the growth of the decorative segment and rapid expansion of end-use industries, reduction in brush repainting, a boost in housing schemes, and rising disposable incomes collectively contribute to the global market growth. Market players provide entry-level equipment for small projects to heavy-duty paint sprayers for large commercial applications.

Spray painting machines that are available in the Indian market are supplied with new air cap designs with increased pattern shape stability, which improves automatization and decreases blotching and mottling. Moreover, they are also equipped with an ergonomic grip for comfortable use that can also work at different pressures. They further provide smooth and precise airflow control. These factors are anticipated to surge the adoption of spray painting machines.

Key market players in the country offer a wide range of products, such as airless painting machine r470, putty spray machine, electric pressure washers, airless paint sprayers r450, wall sprayer machine, and road line marking machine. Additionally, manufacturers have consistently offered quality-approved spray painting machines to their customers in order to maintain the quality-conscious image of their brand in the industry.

New Entrants Transforming the Market - Start-up Economy

Start-up companies are contributing to the spray painting machine market growth by integrating advanced technologies such as artificial intelligence (AI), the Internet of Things (IoT), robotics, etc.:
  • Apellix - It builds a tethered multi-copter drone called Worker Bee for multiple uses. Its chief application is in spraying (water or paint) on vertical surfaces. Appelix claims that its drone is autonomous. The Appelix drone solution includes the drone and tether along with a ground control station and software for running the drone operations. It also does NDT using the drone.
  • Transforma Robotics - It is a developer of collaborative robotic solutions for quality inspection and painting. It offers a quality inspection and assessment robot that comes with a payload capacity. It also offers an indoor spray painting robot having applications in both commercial and residential spaces. It caters to the oil, power, construction, and gas industries.
  • Service - It is a mobile-first marketplace to book bike/scooter repair services. Provides free pickup and drop. Offers spray paint, dent rework, and scratch concealing services. As of Feb 2016, bookings are done via Whatsapp, which has yet to launch the app on Android and iOS.
  • Robot Muralist - It is a provider of mural painting robots. It enables painting any surface area like wood, brick, concrete block, metal, and more. It offers Albert-named robot paint with high-quality and crisp images on printable surfaces of a minimum 30-meter square area. It also offers another robot named, Leonardo, which is a hand-held robot that is suitable for indoor projects and converts any digital image into a 5 mm spray paint dot collection. These murals resemble the pointillism technique.

Competitive Landscape

The global market for spray painting machines is growing at a rapid pace. Key players in the market are investing heavily in research and development to gain a competitive edge. The market is highly fragmented with a large number of small and medium-sized manufacturers.

  • Key players are Wagner Group GmbH, Nordson Corporation, Graco Inc., Kremlin Rexson S.A.S., SAMES KREMLIN, IWAI, ANEST IWATA Corporation, SATA GmbH & Co. KG.

Spray Painting Machine Market Report Scope

Attributes Details
Forecast Period 2023 to 2033
Historical Data Available for 2017 to 2022
Market Analysis USD million for Value and Units for Volume
Key Regions Covered
  • North America
  • Latin America
  • Europe
  • Asia Pacific
  • Oceania
  • Middle East and Africa (MEA)
Key Countries Covered
  • USA
  • Canada
  • Mexico
  • Germany
  • United Kingdom
  • France
  • Italy
  • Spain
  • China
  • Japan
  • India
  • South Korea
  • Australia
  • Brazil
  • Argentina
  • South Africa
  • UAE
Key Segments Covered
  • Type
  • Application
  • Region
Key Companies Profiled
  • Wagner Group GmbH
  • Nordson Corporation
  • Graco Inc.
  • Kremlin Rexson S.A.S.
  • SAMES KREMLIN
  • IWAI
  • ANEST IWATA Corporation
  • SATA GmbH & Co. KG.
Report Coverage Market Forecast, Company Share Analysis, Competitive Landscape, DROT Analysis, Market Dynamics and Challenges, and Strategic Growth Initiatives
Customization & Pricing Available upon Request

Spray Painting Machine Market by Category

By Type, Spray Painting Machine Market is segmented as:

  • Airless spraying machines
  • HVLP spraying machines
  • LVLP spraying

By Application, Spray Painting Machine Market is segmented as:

  • Wood Furniture Industry
  • Automotive Industry
  • Aerospace Industry
  • Construction Industry
  • Food & Beverage Equipment Manufacturing Industry
  • Others

By Region, pray Painting Machine Market is segmented as:

  • North America
  • Latin America
  • Europe
  • East Asia
  • South Asia
  • Oceania
  • MEA

Frequently Asked Questions

How big is the Spray Painting Machine Market?

The Spray Painting Machine Market size is assessed to be US$ 4,325.4 million currently.

At What Rate is Spray Painting Machine Market expected to rise?

The Spray Painting Machine Market is expected to rise at a CAGR of 4.9%.

What is the North America, Spray Painting Machine Market Outlook?

The North American Spray Painting Machine Market is expected to register an 38% CAGR between 2023 and 2033.

Which are the major countries driving demand for Spray Painting Machine Market?

The USA, China, Canada, Germany, and Mexico are the major countries driving demand for Spray Painting Machine Market.

At what rate will the China Spray Painting Machine Market grow?

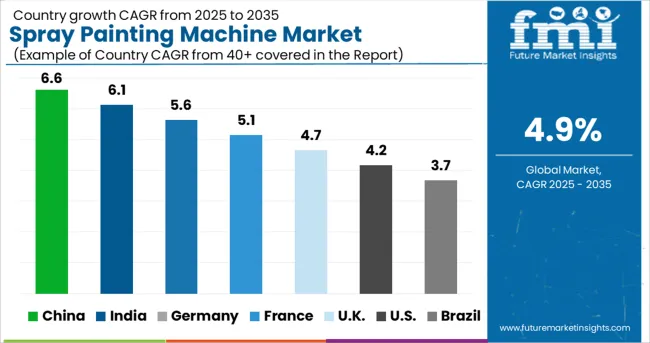
China Spray Painting Machine Market is projected to grow at a CAGR of 5.7%

At what rate will the United Kingdom Spray Painting Machine Market grow?

The United Kingdom Spray Painting Machine Market is projected to grow at a CAGR of 5.3%

At what rate will the India Spray Painting Machine Market grow?

India Spray Painting Machine Market is projected to grow at a CAGR of 6.3%.

At What Rate will, Spray Painting Machine Market Demand Grow in USA?

The demand for Spray Painting Machine Market in the USA is expected to grow by 32.7% in 2023.

At What Rate will, Spray Painting Machine Market Demand Grow in Japan?

The demand for Spray Painting Machine Market in Japan is expected to grow at 8.0% in 2023.

At What Rate will, Spray Painting Machine Market Demand Grow in Australia?

The demand for Spray Painting Machine Market in Australia is expected to grow at 2.7% in 2023.

What is the demand outlook forecast for the Spray Painting Machine Market?

The global Spray Painting Machine Market is forecasted to surpass US$ 6,978.9 million by the end of 2033.

Table of Content

1. Executive Summary | Spray Painting Machine Market

    1.1. Global Market Outlook

    1.2. Demand-side Trends

    1.3. Supply-side Trends

    1.4. Technology Roadmap Analysis

    1.5. Analysis and Recommendations

2. Market Overview

    2.1. Market Coverage / Taxonomy

    2.2. Market Definition / Scope / Limitations

3. Market Background

    3.1. Market Dynamics

        3.1.1. Drivers

        3.1.2. Restraints

        3.1.3. Opportunity

        3.1.4. Trends

    3.2. Scenario Forecast

        3.2.1. Demand in Optimistic Scenario

        3.2.2. Demand in Likely Scenario

        3.2.3. Demand in Conservative Scenario

    3.3. Product launches & Recent Developments

    3.4. Product Life Cycle Analysis

    3.5. Value Chain Analysis

        3.5.1. Supply Side Participants and their Roles

            3.5.1.1. Producers

            3.5.1.2. Mid-Level Participants (Traders/ Agents/ Brokers)

            3.5.1.3. Wholesalers and Distributors

        3.5.2. % of Operating Margin Analysis

        3.5.3. List of Raw Material Suppliers

        3.5.4. List of Existing and Potential Buyer’s

    3.6. Global Market - Pricing Analysis

        3.6.1. Price Point Assessment by Region

        3.6.2. Price Point Assessment by Product Type

        3.6.3. Price Forecast till 2033

        3.6.4. Factors affecting pricing

    3.7. Forecast Factors - Relevance & Impact

    3.8. PESTLE and Porter’s Analysis

    3.9. Regulatory Landscape

        3.9.1. Packaging & Labelling Regulations

        3.9.2. Certifications and Certifying Agency Overview

        3.9.3. Import/Export Policies

    3.10. Regional Parent Market Outlook

    3.11. Production and Consumption Statistics

    3.12. Import and Export Statistics

    3.13. Consumers Survey Analysis

    3.14. Macro-Economic Factors

    3.15. Product Claims & Nutritional Information Scan by Buyers

4. Global Analysis 2017 to 2022 and Forecast, 2023 to 2033

    4.1. Historical Market Size Value (US$ million) & Volume (MT) Analysis, 2017 to 2022

    4.2. Current and Future Market Size Value (US$ million) & Volume (MT) Projections, 2023 to 2033

        4.2.1. Y-o-Y Growth Trend Analysis

        4.2.2. Absolute $ Opportunity Analysis

5. Global Analysis 2017 to 2022 and Forecast 2023 to 2033, By Product Type

    5.1. Introduction / Key Findings

    5.2. Historical Market Size Value (US$ million) & Volume (MT) Analysis By Product Type, 2017 to 2022

    5.3. Current and Future Market Size Value (US$ million) & Volume (MT) Analysis and Forecast By Product Type, 2023 to 2033

        5.3.1. Airless spraying machines

        5.3.2. HVLP spraying machines

        5.3.3. LVLP spraying

    5.4. Y-o-Y Growth Trend Analysis By Product Type, 2017 to 2022

    5.5. Absolute $ Opportunity Analysis By Product Type, 2023 to 2033

6. Global Analysis 2017 to 2022 and Forecast 2023 to 2033, By Application

    6.1. Introduction / Key Findings

    6.2. Historical Market Size Value (US$ million) & Volume (MT) Analysis By Application, 2017 to 2022

    6.3. Current and Future Market Size Value (US$ million) & Volume (MT) Analysis and Forecast By Application, 2023 to 2033

        6.3.1. Wood Furniture Industry

        6.3.2. Aerospace Industry

        6.3.3. Food & Beverage Equipment Manufacturing Industry

        6.3.4. Automotive Industry

        6.3.5. Construction Industry

        6.3.6. Others

    6.4. Y-o-Y Growth Trend Analysis By Application, 2017 to 2022

    6.5. Absolute $ Opportunity Analysis By Application, 2023 to 2033

7. Global Analysis 2017 to 2022 and Forecast 2023 to 2033, By Region

    7.1. Introduction

    7.2. Historical Market Size Value (US$ million) & Volume (MT) Analysis By Region, 2017 to 2022

    7.3. Current Market Size Value (US$ million) & Volume (MT) Analysis and Forecast By Region, 2023 to 2033

        7.3.1. North America

        7.3.2. Latin America

        7.3.3. Europe

        7.3.4. East Asia

        7.3.5. South Asia

        7.3.6. Oceania

        7.3.7. Middle East and Africa (MEA)

    7.4. Market Attractiveness Analysis By Region

8. North America Analysis 2017 to 2022 and Forecast 2023 to 2033, By Country

    8.1. Historical Market Size Value (US$ million) & Volume (MT) Trend Analysis By Market Taxonomy, 2017 to 2022

    8.2. Market Size Value (US$ million) & Volume (MT) Forecast By Market Taxonomy, 2023 to 2033

        8.2.1. By Country

            8.2.1.1. The USA

            8.2.1.2. Canada

        8.2.2. By Product Type

        8.2.3. By Application

    8.3. Market Attractiveness Analysis

        8.3.1. By Country

        8.3.2. By Product Type

        8.3.3. By Application

    8.4. Key Takeaways

9. Latin America Analysis 2017 to 2022 and Forecast 2023 to 2033, By Country

    9.1. Historical Market Size Value (US$ million) & Volume (MT) Trend Analysis By Market Taxonomy, 2017 to 2022

    9.2. Market Size Value (US$ million) & Volume (MT) Forecast By Market Taxonomy, 2023 to 2033

        9.2.1. By Country

            9.2.1.1. Brazil

            9.2.1.2. Mexico

            9.2.1.3. Argentina

            9.2.1.4. Chile

            9.2.1.5. Peru

            9.2.1.6. Rest of Latin America

        9.2.2. By Product Type

        9.2.3. By Application

    9.3. Market Attractiveness Analysis

        9.3.1. By Country

        9.3.2. By Product Type

        9.3.3. By Application

    9.4. Key Takeaways

10. Europe Analysis 2017 to 2022 and Forecast 2023 to 2033, By Country

    10.1. Historical Market Size Value (US$ million) & Volume (MT) Trend Analysis By Market Taxonomy, 2017 to 2022

    10.2. Market Size Value (US$ million) & Volume (MT) Forecast By Market Taxonomy, 2023 to 2033

        10.2.1. By Country

            10.2.1.1. Germany

            10.2.1.2. Italy

            10.2.1.3. France

            10.2.1.4. The United Kingdom

            10.2.1.5. Spain

            10.2.1.6. Russia

            10.2.1.7. BENELUX

            10.2.1.8. Poland

            10.2.1.9. Nordic Countries

            10.2.1.10. Rest of Europe

        10.2.2. By Product Type

        10.2.3. By Application

    10.3. Market Attractiveness Analysis

        10.3.1. By Country

        10.3.2. By Product Type

        10.3.3. By Application

    10.4. Key Takeaways

11. East Asia Analysis 2017 to 2022 and Forecast 2023 to 2033, By Country

    11.1. Historical Market Size Value (US$ million) & Volume (MT) Trend Analysis By Market Taxonomy, 2017 to 2022

    11.2. Market Size Value (US$ million) & Volume (MT) Forecast By Market Taxonomy, 2023 to 2033

        11.2.1. By Country

            11.2.1.1. China

            11.2.1.2. Japan

            11.2.1.3. South Korea

        11.2.2. By Product Type

        11.2.3. By Application

    11.3. Market Attractiveness Analysis

        11.3.1. By Country

        11.3.2. By Product Type

        11.3.3. By Application

    11.4. Key Takeaways

12. South Asia Analysis 2017 to 2022 and Forecast 2023 to 2033, By Country

    12.1. Historical Market Size Value (US$ million) & Volume (MT) Trend Analysis By Market Taxonomy, 2017 to 2022

    12.2. Market Size Value (US$ million) & Volume (MT) Forecast By Market Taxonomy, 2023 to 2033

        12.2.1. By Country

            12.2.1.1. India

            12.2.1.2. Thailand

            12.2.1.3. Malaysia

            12.2.1.4. Indonesia

            12.2.1.5. Singapore

            12.2.1.6. Rest of South Asia

        12.2.2. By Product Type

        12.2.3. By Application

    12.3. Market Attractiveness Analysis

        12.3.1. By Country

        12.3.2. By Product Type

        12.3.3. By Application

    12.4. Key Takeaways

13. Oceania Analysis 2017 to 2022 and Forecast 2023 to 2033, By Country

    13.1. Historical Market Size Value (US$ million) & Volume (MT) Trend Analysis By Market Taxonomy, 2017 to 2022

    13.2. Market Size Value (US$ million) & Volume (MT) Forecast By Market Taxonomy, 2023 to 2033

        13.2.1. By Country

            13.2.1.1. Australia

            13.2.1.2. New Zealand

        13.2.2. By Product Type

        13.2.3. By Application

    13.3. Market Attractiveness Analysis

        13.3.1. By Country

        13.3.2. By Product Type

        13.3.3. By Application

    13.4. Key Takeaways

14. MEA Analysis 2017 to 2022 and Forecast 2023 to 2033, By Country

    14.1. Historical Market Size Value (US$ million) & Volume (MT) Trend Analysis By Market Taxonomy, 2017 to 2022

    14.2. Market Size Value (US$ million) & Volume (MT) Forecast By Market Taxonomy, 2023 to 2033

        14.2.1. By Country

            14.2.1.1. GCC Countries

            14.2.1.2. South Africa

            14.2.1.3. Central Africa

            14.2.1.4. North Africa

        14.2.2. By Product Type

        14.2.3. By Application

    14.3. Market Attractiveness Analysis

        14.3.1. By Country

        14.3.2. By Product Type

        14.3.3. By Application

    14.4. Key Takeaways

15. Key Countries  Analysis

    15.1. The USA

        15.1.1. Pricing Analysis

        15.1.2. Market Share Analysis, 2022

            15.1.2.1. By Product Type

            15.1.2.2. By Application

    15.2. Canada

        15.2.1. Pricing Analysis

        15.2.2. Market Share Analysis, 2022

            15.2.2.1. By Product Type

            15.2.2.2. By Application

    15.3. Brazil

        15.3.1. Pricing Analysis

        15.3.2. Market Share Analysis, 2022

            15.3.2.1. By Product Type

            15.3.2.2. By Application

    15.4. Mexico

        15.4.1. Pricing Analysis

        15.4.2. Market Share Analysis, 2022

            15.4.2.1. By Product Type

            15.4.2.2. By Application

    15.5. Argentina

        15.5.1. Pricing Analysis

        15.5.2. Market Share Analysis, 2022

            15.5.2.1. By Product Type

            15.5.2.2. By Application

    15.6. Chile

        15.6.1. Pricing Analysis

        15.6.2. Market Share Analysis, 2022

            15.6.2.1. By Product Type

            15.6.2.2. By Application

    15.7. Peru

        15.7.1. Pricing Analysis

        15.7.2. Market Share Analysis, 2022

            15.7.2.1. By Product Type

            15.7.2.2. By Application

    15.8. Germany

        15.8.1. Pricing Analysis

        15.8.2. Market Share Analysis, 2022

            15.8.2.1. By Product Type

            15.8.2.2. By Application

    15.9. Italy

        15.9.1. Pricing Analysis

        15.9.2. Market Share Analysis, 2022

            15.9.2.1. By Product Type

            15.9.2.2. By Application

    15.10. France

        15.10.1. Pricing Analysis

        15.10.2. Market Share Analysis, 2022

            15.10.2.1. By Product Type

            15.10.2.2. By Application

    15.11. Spain

        15.11.1. Pricing Analysis

        15.11.2. Market Share Analysis, 2022

            15.11.2.1. By Product Type

            15.11.2.2. By Application

    15.12. The United Kingdom

        15.12.1. Pricing Analysis

        15.12.2. Market Share Analysis, 2022

            15.12.2.1. By Product Type

            15.12.2.2. By Application

    15.13. Russia

        15.13.1. Pricing Analysis

        15.13.2. Market Share Analysis, 2022

            15.13.2.1. By Product Type

            15.13.2.2. By Application

    15.14. Poland

        15.14.1. Pricing Analysis

        15.14.2. Market Share Analysis, 2022

            15.14.2.1. By Product Type

            15.14.2.2. By Application

    15.15. BENELUX

        15.15.1. Pricing Analysis

        15.15.2. Market Share Analysis, 2022

            15.15.2.1. By Product Type

            15.15.2.2. By Application

    15.16. Nordic Countries

        15.16.1. Pricing Analysis

        15.16.2. Market Share Analysis, 2022

            15.16.2.1. By Product Type

            15.16.2.2. By Application

    15.17. China

        15.17.1. Pricing Analysis

        15.17.2. Market Share Analysis, 2022

            15.17.2.1. By Product Type

            15.17.2.2. By Application

    15.18. Japan

        15.18.1. Pricing Analysis

        15.18.2. Market Share Analysis, 2022

            15.18.2.1. By Product Type

            15.18.2.2. By Application

    15.19. South Korea

        15.19.1. Pricing Analysis

        15.19.2. Market Share Analysis, 2022

            15.19.2.1. By Product Type

            15.19.2.2. By Application

    15.20. India

        15.20.1. Pricing Analysis

        15.20.2. Market Share Analysis, 2022

            15.20.2.1. By Product Type

            15.20.2.2. By Application

    15.21. Thailand

        15.21.1. Pricing Analysis

        15.21.2. Market Share Analysis, 2022

            15.21.2.1. By Product Type

            15.21.2.2. By Application

    15.22. Indonesia

        15.22.1. Pricing Analysis

        15.22.2. Market Share Analysis, 2022

            15.22.2.1. By Product Type

            15.22.2.2. By Application

    15.23. Malaysia

        15.23.1. Pricing Analysis

        15.23.2. Market Share Analysis, 2022

            15.23.2.1. By Product Type

            15.23.2.2. By Application

    15.24. Singapore

        15.24.1. Pricing Analysis

        15.24.2. Market Share Analysis, 2022

            15.24.2.1. By Product Type

            15.24.2.2. By Application

    15.25. Australia

        15.25.1. Pricing Analysis

        15.25.2. Market Share Analysis, 2022

            15.25.2.1. By Product Type

            15.25.2.2. By Application

    15.26. New Zealand

        15.26.1. Pricing Analysis

        15.26.2. Market Share Analysis, 2022

            15.26.2.1. By Product Type

            15.26.2.2. By Application

    15.27. GCC Countries

        15.27.1. Pricing Analysis

        15.27.2. Market Share Analysis, 2022

            15.27.2.1. By Product Type

            15.27.2.2. By Application

    15.28. South Africa

        15.28.1. Pricing Analysis

        15.28.2. Market Share Analysis, 2022

            15.28.2.1. By Product Type

            15.28.2.2. By Application

    15.29. North Africa

        15.29.1. Pricing Analysis

        15.29.2. Market Share Analysis, 2022

            15.29.2.1. By Product Type

            15.29.2.2. By Application

    15.30. Central Africa

        15.30.1. Pricing Analysis

        15.30.2. Market Share Analysis, 2022

            15.30.2.1. By Product Type

            15.30.2.2. By Application

16. Market Structure Analysis

    16.1. Competition Dashboard

    16.2. Competition Benchmarking

    16.3. Market Share Analysis of Top Players

        16.3.1. By Regional

        16.3.2. By Product Type

        16.3.3. By Application

17. Competition Analysis

    17.1. Competition Deep Dive

        17.1.1. Wagner Group GmbH

            17.1.1.1. Overview

            17.1.1.2. Product Portfolio

            17.1.1.3. Profitability by Market Segments (Product/Age /Sales Channel/Region)

            17.1.1.4. Sales Footprint

            17.1.1.5. Strategy Overview

                17.1.1.5.1. Marketing Strategy

                17.1.1.5.2. Product Strategy

                17.1.1.5.3. Channel Strategy

        17.1.2. Nordson Corporation

            17.1.2.1. Overview

            17.1.2.2. Product Portfolio

            17.1.2.3. Profitability by Market Segments (Product/Age /Sales Channel/Region)

            17.1.2.4. Sales Footprint

            17.1.2.5. Strategy Overview

                17.1.2.5.1. Marketing Strategy

                17.1.2.5.2. Product Strategy

                17.1.2.5.3. Channel Strategy

        17.1.3. Graco Inc. 

            17.1.3.1. Overview

            17.1.3.2. Product Portfolio

            17.1.3.3. Profitability by Market Segments (Product/Age /Sales Channel/Region)

            17.1.3.4. Sales Footprint

            17.1.3.5. Strategy Overview

                17.1.3.5.1. Marketing Strategy

                17.1.3.5.2. Product Strategy

                17.1.3.5.3. Channel Strategy

        17.1.4. Kremlin Rexson S.A.S.

            17.1.4.1. Overview

            17.1.4.2. Product Portfolio

            17.1.4.3. Profitability by Market Segments (Product/Age /Sales Channel/Region)

            17.1.4.4. Sales Footprint

            17.1.4.5. Strategy Overview

                17.1.4.5.1. Marketing Strategy

                17.1.4.5.2. Product Strategy

                17.1.4.5.3. Channel Strategy

        17.1.5. SAMES KREMLIN

            17.1.5.1. Overview

            17.1.5.2. Product Portfolio

            17.1.5.3. Profitability by Market Segments (Product/Age /Sales Channel/Region)

            17.1.5.4. Sales Footprint

            17.1.5.5. Strategy Overview

                17.1.5.5.1. Marketing Strategy

                17.1.5.5.2. Product Strategy

                17.1.5.5.3. Channel Strategy

        17.1.6. IWAI

            17.1.6.1. Overview

            17.1.6.2. Product Portfolio

            17.1.6.3. Profitability by Market Segments (Product/Age /Sales Channel/Region)

            17.1.6.4. Sales Footprint

            17.1.6.5. Strategy Overview

                17.1.6.5.1. Marketing Strategy

                17.1.6.5.2. Product Strategy

                17.1.6.5.3. Channel Strategy

        17.1.7. ANEST IWATA Corporation

            17.1.7.1. Overview

            17.1.7.2. Product Portfolio

            17.1.7.3. Profitability by Market Segments (Product/Age /Sales Channel/Region)

            17.1.7.4. Sales Footprint

            17.1.7.5. Strategy Overview

                17.1.7.5.1. Marketing Strategy

                17.1.7.5.2. Product Strategy

                17.1.7.5.3. Channel Strategy

        17.1.8. SATA GmbH & Co. KG.

            17.1.8.1. Overview

            17.1.8.2. Product Portfolio

            17.1.8.3. Profitability by Market Segments (Product/Age /Sales Channel/Region)

            17.1.8.4. Sales Footprint

            17.1.8.5. Strategy Overview

                17.1.8.5.1. Marketing Strategy

                17.1.8.5.2. Product Strategy

                17.1.8.5.3. Channel Strategy

18. Assumptions & Acronyms Used

19. Research Methodology

List of Tables

Table 1: Global Value (US$ million) Forecast by Region, 2017 to 2033

Table 2: Global Volume (MT) Forecast by Region, 2017 to 2033

Table 3: Global Value (US$ million) Forecast by Product Type, 2017 to 2033

Table 4: Global Volume (MT) Forecast by Product Type, 2017 to 2033

Table 5: Global Value (US$ million) Forecast by Application, 2017 to 2033

Table 6: Global Volume (MT) Forecast by Application, 2017 to 2033

Table 7: North America Value (US$ million) Forecast by Country, 2017 to 2033

Table 8: North America Volume (MT) Forecast by Country, 2017 to 2033

Table 9: North America Value (US$ million) Forecast by Product Type, 2017 to 2033

Table 10: North America Volume (MT) Forecast by Product Type, 2017 to 2033

Table 11: North America Value (US$ million) Forecast by Application, 2017 to 2033

Table 12: North America Volume (MT) Forecast by Application, 2017 to 2033

Table 13: Latin America Value (US$ million) Forecast by Country, 2017 to 2033

Table 14: Latin America Volume (MT) Forecast by Country, 2017 to 2033

Table 15: Latin America Value (US$ million) Forecast by Product Type, 2017 to 2033

Table 16: Latin America Volume (MT) Forecast by Product Type, 2017 to 2033

Table 17: Latin America Value (US$ million) Forecast by Application, 2017 to 2033

Table 18: Latin America Volume (MT) Forecast by Application, 2017 to 2033

Table 19: Europe Value (US$ million) Forecast by Country, 2017 to 2033

Table 20: Europe Volume (MT) Forecast by Country, 2017 to 2033

Table 21: Europe Value (US$ million) Forecast by Product Type, 2017 to 2033

Table 22: Europe Volume (MT) Forecast by Product Type, 2017 to 2033

Table 23: Europe Value (US$ million) Forecast by Application, 2017 to 2033

Table 24: Europe Volume (MT) Forecast by Application, 2017 to 2033

Table 25: East Asia Value (US$ million) Forecast by Country, 2017 to 2033

Table 26: East Asia Volume (MT) Forecast by Country, 2017 to 2033

Table 27: East Asia Value (US$ million) Forecast by Product Type, 2017 to 2033

Table 28: East Asia Volume (MT) Forecast by Product Type, 2017 to 2033

Table 29: East Asia Value (US$ million) Forecast by Application, 2017 to 2033

Table 30: East Asia Volume (MT) Forecast by Application, 2017 to 2033

Table 31: South Asia Value (US$ million) Forecast by Country, 2017 to 2033

Table 32: South Asia Volume (MT) Forecast by Country, 2017 to 2033

Table 33: South Asia Value (US$ million) Forecast by Product Type, 2017 to 2033

Table 34: South Asia Volume (MT) Forecast by Product Type, 2017 to 2033

Table 35: South Asia Value (US$ million) Forecast by Application, 2017 to 2033

Table 36: South Asia Volume (MT) Forecast by Application, 2017 to 2033

Table 37: Oceania Value (US$ million) Forecast by Country, 2017 to 2033

Table 38: Oceania Volume (MT) Forecast by Country, 2017 to 2033

Table 39: Oceania Value (US$ million) Forecast by Product Type, 2017 to 2033

Table 40: Oceania Volume (MT) Forecast by Product Type, 2017 to 2033

Table 41: Oceania Value (US$ million) Forecast by Application, 2017 to 2033

Table 42: Oceania Volume (MT) Forecast by Application, 2017 to 2033

Table 43: MEA Value (US$ million) Forecast by Country, 2017 to 2033

Table 44: MEA Volume (MT) Forecast by Country, 2017 to 2033

Table 45: MEA Value (US$ million) Forecast by Product Type, 2017 to 2033

Table 46: MEA Volume (MT) Forecast by Product Type, 2017 to 2033

Table 47: MEA Value (US$ million) Forecast by Application, 2017 to 2033

Table 48: MEA Volume (MT) Forecast by Application, 2017 to 2033

List of Charts

Figure 1: Global Value (US$ million) by Product Type, 2023 to 2033

Figure 2: Global Value (US$ million) by Application, 2023 to 2033

Figure 3: Global Value (US$ million) by Region, 2023 to 2033

Figure 4: Global Value (US$ million) Analysis by Region, 2017 to 2033

Figure 5: Global Volume (MT) Analysis by Region, 2017 to 2033

Figure 6: Global Value Share (%) and BPS Analysis by Region, 2023 to 2033

Figure 7: Global Y-o-Y Growth (%) Projections by Region, 2023 to 2033

Figure 8: Global Value (US$ million) Analysis by Product Type, 2017 to 2033

Figure 9: Global Volume (MT) Analysis by Product Type, 2017 to 2033

Figure 10: Global Value Share (%) and BPS Analysis by Product Type, 2023 to 2033

Figure 11: Global Y-o-Y Growth (%) Projections by Product Type, 2023 to 2033

Figure 12: Global Value (US$ million) Analysis by Application, 2017 to 2033

Figure 13: Global Volume (MT) Analysis by Application, 2017 to 2033

Figure 14: Global Value Share (%) and BPS Analysis by Application, 2023 to 2033

Figure 15: Global Y-o-Y Growth (%) Projections by Application, 2023 to 2033

Figure 16: Global Attractiveness by Product Type, 2023 to 2033

Figure 17: Global Attractiveness by Application, 2023 to 2033

Figure 18: Global Attractiveness by Region, 2023 to 2033

Figure 19: North America Value (US$ million) by Product Type, 2023 to 2033

Figure 20: North America Value (US$ million) by Application, 2023 to 2033

Figure 21: North America Value (US$ million) by Country, 2023 to 2033

Figure 22: North America Value (US$ million) Analysis by Country, 2017 to 2033

Figure 23: North America Volume (MT) Analysis by Country, 2017 to 2033

Figure 24: North America Value Share (%) and BPS Analysis by Country, 2023 to 2033

Figure 25: North America Y-o-Y Growth (%) Projections by Country, 2023 to 2033

Figure 26: North America Value (US$ million) Analysis by Product Type, 2017 to 2033

Figure 27: North America Volume (MT) Analysis by Product Type, 2017 to 2033

Figure 28: North America Value Share (%) and BPS Analysis by Product Type, 2023 to 2033

Figure 29: North America Y-o-Y Growth (%) Projections by Product Type, 2023 to 2033

Figure 30: North America Value (US$ million) Analysis by Application, 2017 to 2033

Figure 31: North America Volume (MT) Analysis by Application, 2017 to 2033

Figure 32: North America Value Share (%) and BPS Analysis by Application, 2023 to 2033

Figure 33: North America Y-o-Y Growth (%) Projections by Application, 2023 to 2033

Figure 34: North America Attractiveness by Product Type, 2023 to 2033

Figure 35: North America Attractiveness by Application, 2023 to 2033

Figure 36: North America Attractiveness by Country, 2023 to 2033

Figure 37: Latin America Value (US$ million) by Product Type, 2023 to 2033

Figure 38: Latin America Value (US$ million) by Application, 2023 to 2033

Figure 39: Latin America Value (US$ million) by Country, 2023 to 2033

Figure 40: Latin America Value (US$ million) Analysis by Country, 2017 to 2033

Figure 41: Latin America Volume (MT) Analysis by Country, 2017 to 2033

Figure 42: Latin America Value Share (%) and BPS Analysis by Country, 2023 to 2033

Figure 43: Latin America Y-o-Y Growth (%) Projections by Country, 2023 to 2033

Figure 44: Latin America Value (US$ million) Analysis by Product Type, 2017 to 2033

Figure 45: Latin America Volume (MT) Analysis by Product Type, 2017 to 2033

Figure 46: Latin America Value Share (%) and BPS Analysis by Product Type, 2023 to 2033

Figure 47: Latin America Y-o-Y Growth (%) Projections by Product Type, 2023 to 2033

Figure 48: Latin America Value (US$ million) Analysis by Application, 2017 to 2033

Figure 49: Latin America Volume (MT) Analysis by Application, 2017 to 2033

Figure 50: Latin America Value Share (%) and BPS Analysis by Application, 2023 to 2033

Figure 51: Latin America Y-o-Y Growth (%) Projections by Application, 2023 to 2033

Figure 52: Latin America Attractiveness by Product Type, 2023 to 2033

Figure 53: Latin America Attractiveness by Application, 2023 to 2033

Figure 54: Latin America Attractiveness by Country, 2023 to 2033

Figure 55: Europe Value (US$ million) by Product Type, 2023 to 2033

Figure 56: Europe Value (US$ million) by Application, 2023 to 2033

Figure 57: Europe Value (US$ million) by Country, 2023 to 2033

Figure 58: Europe Value (US$ million) Analysis by Country, 2017 to 2033

Figure 59: Europe Volume (MT) Analysis by Country, 2017 to 2033

Figure 60: Europe Value Share (%) and BPS Analysis by Country, 2023 to 2033

Figure 61: Europe Y-o-Y Growth (%) Projections by Country, 2023 to 2033

Figure 62: Europe Value (US$ million) Analysis by Product Type, 2017 to 2033

Figure 63: Europe Volume (MT) Analysis by Product Type, 2017 to 2033

Figure 64: Europe Value Share (%) and BPS Analysis by Product Type, 2023 to 2033

Figure 65: Europe Y-o-Y Growth (%) Projections by Product Type, 2023 to 2033

Figure 66: Europe Value (US$ million) Analysis by Application, 2017 to 2033

Figure 67: Europe Volume (MT) Analysis by Application, 2017 to 2033

Figure 68: Europe Value Share (%) and BPS Analysis by Application, 2023 to 2033

Figure 69: Europe Y-o-Y Growth (%) Projections by Application, 2023 to 2033

Figure 70: Europe Attractiveness by Product Type, 2023 to 2033

Figure 71: Europe Attractiveness by Application, 2023 to 2033

Figure 72: Europe Attractiveness by Country, 2023 to 2033

Figure 73: East Asia Value (US$ million) by Product Type, 2023 to 2033

Figure 74: East Asia Value (US$ million) by Application, 2023 to 2033

Figure 75: East Asia Value (US$ million) by Country, 2023 to 2033

Figure 76: East Asia Value (US$ million) Analysis by Country, 2017 to 2033

Figure 77: East Asia Volume (MT) Analysis by Country, 2017 to 2033

Figure 78: East Asia Value Share (%) and BPS Analysis by Country, 2023 to 2033

Figure 79: East Asia Y-o-Y Growth (%) Projections by Country, 2023 to 2033

Figure 80: East Asia Value (US$ million) Analysis by Product Type, 2017 to 2033

Figure 81: East Asia Volume (MT) Analysis by Product Type, 2017 to 2033

Figure 82: East Asia Value Share (%) and BPS Analysis by Product Type, 2023 to 2033

Figure 83: East Asia Y-o-Y Growth (%) Projections by Product Type, 2023 to 2033

Figure 84: East Asia Value (US$ million) Analysis by Application, 2017 to 2033

Figure 85: East Asia Volume (MT) Analysis by Application, 2017 to 2033

Figure 86: East Asia Value Share (%) and BPS Analysis by Application, 2023 to 2033

Figure 87: East Asia Y-o-Y Growth (%) Projections by Application, 2023 to 2033

Figure 88: East Asia Attractiveness by Product Type, 2023 to 2033

Figure 89: East Asia Attractiveness by Application, 2023 to 2033

Figure 90: East Asia Attractiveness by Country, 2023 to 2033

Figure 91: South Asia Value (US$ million) by Product Type, 2023 to 2033

Figure 92: South Asia Value (US$ million) by Application, 2023 to 2033

Figure 93: South Asia Value (US$ million) by Country, 2023 to 2033

Figure 94: South Asia Value (US$ million) Analysis by Country, 2017 to 2033

Figure 95: South Asia Volume (MT) Analysis by Country, 2017 to 2033

Figure 96: South Asia Value Share (%) and BPS Analysis by Country, 2023 to 2033

Figure 97: South Asia Y-o-Y Growth (%) Projections by Country, 2023 to 2033

Figure 98: South Asia Value (US$ million) Analysis by Product Type, 2017 to 2033

Figure 99: South Asia Volume (MT) Analysis by Product Type, 2017 to 2033

Figure 100: South Asia Value Share (%) and BPS Analysis by Product Type, 2023 to 2033

Figure 101: South Asia Y-o-Y Growth (%) Projections by Product Type, 2023 to 2033

Figure 102: South Asia Value (US$ million) Analysis by Application, 2017 to 2033

Figure 103: South Asia Volume (MT) Analysis by Application, 2017 to 2033

Figure 104: South Asia Value Share (%) and BPS Analysis by Application, 2023 to 2033

Figure 105: South Asia Y-o-Y Growth (%) Projections by Application, 2023 to 2033

Figure 106: South Asia Attractiveness by Product Type, 2023 to 2033

Figure 107: South Asia Attractiveness by Application, 2023 to 2033

Figure 108: South Asia Attractiveness by Country, 2023 to 2033

Figure 109: Oceania Value (US$ million) by Product Type, 2023 to 2033

Figure 110: Oceania Value (US$ million) by Application, 2023 to 2033

Figure 111: Oceania Value (US$ million) by Country, 2023 to 2033

Figure 112: Oceania Value (US$ million) Analysis by Country, 2017 to 2033

Figure 113: Oceania Volume (MT) Analysis by Country, 2017 to 2033

Figure 114: Oceania Value Share (%) and BPS Analysis by Country, 2023 to 2033

Figure 115: Oceania Y-o-Y Growth (%) Projections by Country, 2023 to 2033

Figure 116: Oceania Value (US$ million) Analysis by Product Type, 2017 to 2033

Figure 117: Oceania Volume (MT) Analysis by Product Type, 2017 to 2033

Figure 118: Oceania Value Share (%) and BPS Analysis by Product Type, 2023 to 2033

Figure 119: Oceania Y-o-Y Growth (%) Projections by Product Type, 2023 to 2033

Figure 120: Oceania Value (US$ million) Analysis by Application, 2017 to 2033

Figure 121: Oceania Volume (MT) Analysis by Application, 2017 to 2033

Figure 122: Oceania Value Share (%) and BPS Analysis by Application, 2023 to 2033

Figure 123: Oceania Y-o-Y Growth (%) Projections by Application, 2023 to 2033

Figure 124: Oceania Attractiveness by Product Type, 2023 to 2033

Figure 125: Oceania Attractiveness by Application, 2023 to 2033

Figure 126: Oceania Attractiveness by Country, 2023 to 2033

Figure 127: MEA Value (US$ million) by Product Type, 2023 to 2033

Figure 128: MEA Value (US$ million) by Application, 2023 to 2033

Figure 129: MEA Value (US$ million) by Country, 2023 to 2033

Figure 130: MEA Value (US$ million) Analysis by Country, 2017 to 2033

Figure 131: MEA Volume (MT) Analysis by Country, 2017 to 2033

Figure 132: MEA Value Share (%) and BPS Analysis by Country, 2023 to 2033

Figure 133: MEA Y-o-Y Growth (%) Projections by Country, 2023 to 2033

Figure 134: MEA Value (US$ million) Analysis by Product Type, 2017 to 2033

Figure 135: MEA Volume (MT) Analysis by Product Type, 2017 to 2033

Figure 136: MEA Value Share (%) and BPS Analysis by Product Type, 2023 to 2033

Figure 137: MEA Y-o-Y Growth (%) Projections by Product Type, 2023 to 2033

Figure 138: MEA Value (US$ million) Analysis by Application, 2017 to 2033

Figure 139: MEA Volume (MT) Analysis by Application, 2017 to 2033

Figure 140: MEA Value Share (%) and BPS Analysis by Application, 2023 to 2033

Figure 141: MEA Y-o-Y Growth (%) Projections by Application, 2023 to 2033

Figure 142: MEA Attractiveness by Product Type, 2023 to 2033

Figure 143: MEA Attractiveness by Application, 2023 to 2033

Figure 144: MEA Attractiveness by Country, 2023 to 2033

Explore Process Automation Insights

View Reports

Spray Painting Machine Market