
- Market Size (2026)
- USD 2327.7 Mn
- Forecast (2036)
- USD 4452.1 Mn
- CAGR (2026 to 2036)
- 6.7%
How big is Spray Foam Insulation Market in 2026?
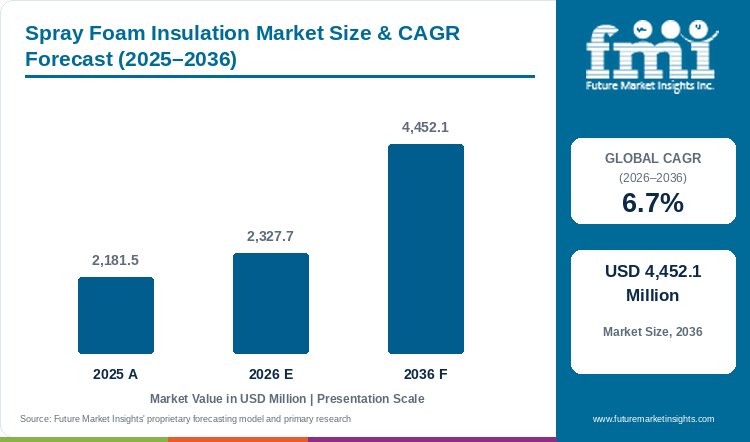
The spray foam insulation market is estimated at USD 2,181.5 million in 2025 and is forecast to reach USD 2,327.7 million in 2026. Spray foam insulation sales are projected to grow at a 6.7% CAGR and reach USD 4,452.1 million by 2036.
Adoption of spray foam insulation is growing in roof decks, rim joists and commercial walls, with 2025 sales estimated at USD 2,181.5 million and 2026 sales expected to reach USD 2,327.7 million. A 6.7% CAGR from that base is projected for the spray foam insulation market, with sales reaching USD 4,452.1 million by 2036. Through 2036, the trend shaping sales most will be a higher chemical cost for MDI-based foam systems, as isocyanate makers rebuild margins. Huntsman reported a 16% rise in Polyurethanes segment sales, to USD 1,079 million, between April and June 2026, with about 10 points from higher selling prices and mix, and said MDI prices rose in all three regions.[1] Higher MDI prices pass into the A-side drum and then into the installed price per board foot, so the cost per inch is becoming the next battleground for market share between closed-cell foam and mineral wool or board. FMI analysts advise spray foam contractors to secure quarterly chemical supply terms and to quote closed-cell jobs with price adjustment clauses, since commercial roof and wall projects can run for months between bid and installation.
Key Market Trends & Insights
- Closed-cell foam, the denser of the two types, will hold 61.3% of 2026 sales by product type, as the foam adds structural rigidity and a vapour retarder in one layer, and open-cell foam follows at an estimated 38.7%.
- Demand for wall insulation keeps the application at about 42.2% of sales in 2026, ahead of roofing and flooring near 24.6%. Carlisle launched SealTite PRO HYX, a closed-cell foam that forms a Class II vapour retarder at one and a half inches.[2]
- Residential buildings are likely to remain the largest end use in 2026, with 45.4% of sales, and commercial buildings about 36.2%. In the June quarter, commercial sales at Installed Building Products grew 14.1%, against a fall in residential new construction.[3]
Regional Highlights
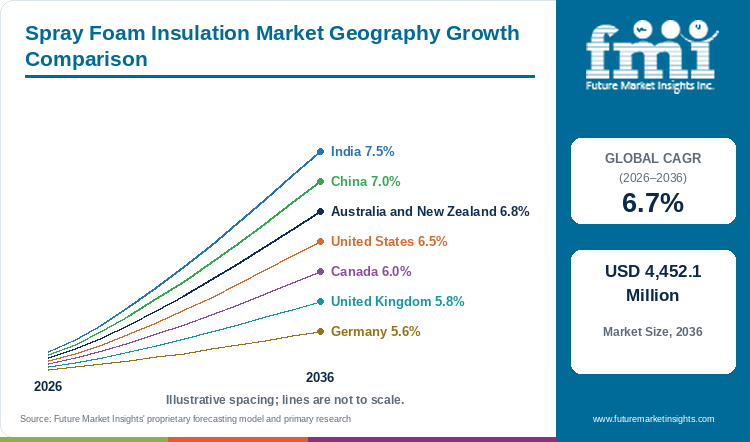
- Per FMI's country model, India has the highest rate, a 7.5% CAGR that is faster than the spray foam insulation market average of 6.7%, as urban housing and commercial towers adopt green building codes.
- Cold stores and factory sheds put China second on 7%, a shade ahead of Australia and New Zealand at 6.8%. Commercial work holds the United States at 6.5%, and cold-climate homes support Canada at 6%. The United Kingdom and Germany grow slowest, with Germany lowest at 5.6%.
- Huntsman spray foam systems Heatlok ECO and Classic LD-C-50 gained Australian Made certification in October 2026.[4]
Market Size & Forecast
Table 1: Market Size and Forecast for the Spray Foam Insulation Market (USD million and percentage), 2025 to 2036
| Metric | Value |
|---|---|
| 2025 Market Size | USD 2,181.5 million |
| Estimated Market Size in 2026 | USD 2,327.7 million |
| Projected Market Size by 2036 | USD 4,452.1 million |
| CAGR, 2026 to 2036 | 6.7% |
| Added Revenue, 2026 to 2036 | USD 2,124.4 million |
| Market Expansion Multiple | 1.9x |
Spray foam orders follow building completions and roof replacement cycles, and contractors buy chemical sets a few weeks before each job. Installed Building Products, a large spray foam installer, grew net revenue 2.3% to USD 777.8 million over April to June 2026, as commercial sales grew and total completions fell 4.9%.[3] Residential same-branch sales at the company fell 6.1%, and the CEO said affordability and consumer confidence will continue to weigh on the housing market.[3] Re-roofing adds steady volume, and a 5.3% CAGR outlook for the roofing materials market keeps that work steady. FMI analysts expect 2036 spray foam insulation sales to exceed the 2026 base by USD 2,124.4 million, close to double the 2026 figure. A slower housing market is the main risk to this path, since new homes use most open-cell foam.
Chemical Supply, Carbon Footprint and Rival Insulation
System houses buy isocyanate from a small group of suppliers. Olin and Huntsman agreed in June 2026 to an all-stock merger of equals, with combined 2025 revenue of about USD 12.5 billion and a close expected during January to June 2027.[5] Covestro introduced Desmodur ClimateValue pMDI in September 2026 for European insulation customers, with a product carbon footprint about 25% below standard grades, supplied from sites in Germany.[6] Foam formulators will pay more for verified low-carbon MDI when specifiers ask for building product declarations.
Mineral wool makers are gaining from the same energy efficiency push. Rockwool reported second-quarter sales of EUR 1,000 million, a new quarterly high and 10% more in local currencies, and the CEO said energy price increases are driving greater focus on energy efficiency in buildings.[7] Stone wool and PIR boards compete with closed-cell foam on commercial walls and roofs. Contractors will hold those jobs by selling air sealing and insulation in one application.
Table 2: Chemical Cost, Installer and Rival Insulation Indicators for the Spray Foam Insulation Market (sales, growth and specifications), 2026
| Indicator | Data Point | Relevance | Source |
|---|---|---|---|
| Huntsman Polyurethanes sales, Q2 2026 | USD 1,079 million; up 16% | MDI price rises reach foam systems. | [1] |
| Olin and Huntsman merger, June 2026 | About USD 12.5 billion combined 2025 revenue | Isocyanate and foam system supply consolidates. | [5] |
| Installed Building Products commercial sales, Q2 2026 | USD 141.0 million; up 14.1% | Commercial jobs offset weak housing. | [3] |
| Covestro Desmodur ClimateValue pMDI, September 2026 | About 25% lower product carbon footprint | Low-carbon inputs for European insulation. | [6] |
| Rockwool sales, Q2 2026 | EUR 1,000 million; up 10% | Rival insulation grows on efficiency demand. | [7] |
| Carlisle SealTite PRO HYX yield, 2026 | Up to 6,200 board feet per set | Yield sets installed cost per job. | [2] |
Analyst Perspective
“Spray foam contractors are selling an air barrier and insulation in one visit, and that pitch is strongest on commercial roofs and walls, which are holding up better than new homes in 2026. I expect closed-cell systems with higher yield per set and lower-carbon chemistry to gain specifications through 2036, as suppliers move those blends from production capacity to commercial scale. Yield and carbon decide the bid.”
- Nikhil Kaitwade, Principal Consultant, Future Market Insights.
How is the spray foam insulation market segmented?
The market is segmented into product type, application, end use, and region. Closed-cell foam is expected to lead product type with 61.3% share in 2026, and wall insulation leads application with 42.2%.
By product type: closed-cell spray foam, and open-cell spray foam.
By application: wall insulation, roofing and flooring, attics and ceilings, HVAC systems, and others.
By end use: residential, commercial, and industrial.
By region: new and existing buildings in North America, Latin America, Western Europe, Eastern Europe, East Asia, South Asia and Pacific, and Middle East and Africa.
Why does closed-cell foam lead spray foam insulation sales by product type?
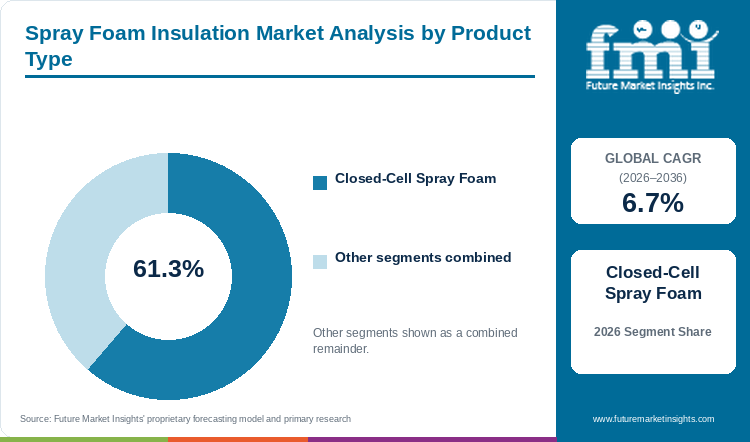
Closed-cell spray foam is expected to lead product type sales with 61.3% share in 2026, ahead of open-cell spray foam at about 38.7%.
Table 3: Product Type Share for the Spray Foam Insulation Market (percentage share), 2026
| Product Type | Estimated Share (2026) |
|---|---|
| Closed-Cell Spray Foam | 61.3% |
| Open-Cell Spray Foam | 38.7% |
| Total | 100.0% |
Table 4: Product Type Leadership and Market Growth for the Spray Foam Insulation Market (segment and CAGR percentage), 2026 to 2036
| Metric | Value |
|---|---|
| Global CAGR (2026 to 2036) | 6.7% |
| Leading Segment | Closed-Cell Spray Foam |
With an expected 61.3% share in 2026, closed-cell spray foam leads product type, as each inch gives a higher R-value, blocks water vapour and stiffens walls and roof decks, which suits commercial roofs, basements and cold climates. Open-cell foam, about 38.7%, expands to fill cavities at a lower cost per board foot and absorbs sound, so builders choose open-cell foam for interior walls and attic rooflines of homes. Closed-cell foam uses more chemical per square foot, so MDI price rises affect closed-cell jobs most, and Huntsman reported higher MDI prices in all regions in Q2 2026.[1] A contractor bidding a commercial roof will choose closed-cell foam for moisture and strength, and a home builder pricing an attic will choose open-cell foam to save cost.
- High-pressure two-component rigs and low-pressure kits both apply closed-cell foam, with rigs used on larger jobs.
- SealTite PRO HYX from Carlisle covers up to 6,200 board feet per set at a core density of 1.9 pcf, Spray Foam Magazine reported in September 2026.[2]
Why does wall insulation lead spray foam insulation sales by application?
Wall insulation is likely to hold 42.2% of application sales in 2026, with roofing and flooring at about 24.6% and attics and ceilings at roughly 18.3%.
Table 5: Application Share for the Spray Foam Insulation Market (percentage share), 2026
| Application | Estimated Share (2026) |
|---|---|
| Wall Insulation | 42.2% |
| Roofing and Flooring | 24.6% |
| Attics and Ceilings | 18.3% |
| HVAC Systems | 8.1% |
| Others | 6.8% |
| Total | 100.0% |
Wall insulation, projected at 42.2% share in 2026, leads application sales, as walls have the largest surface in most buildings and spray foam seals gaps around studs, pipes and outlets in the same pass. Roofing and flooring, an estimated 24.6%, include spray foam roof systems on flat commercial roofs and slab edges. Attics and ceilings, near 18.3%, use open-cell foam at the roofline of homes. HVAC systems, about 8.1%, cover ducts, chillers and cold rooms. Other uses, around 6.8%, include tanks and pipes. Builders insulating a wall will pick spray foam on projects with strict air tightness targets, and roofers will pick foam when the roof needs a continuous membrane.
- Exterior walls, rim joists and basement walls form most wall applications.
- Some mortgage lenders in the United Kingdom refused loans for homes with spray foam in roof assemblies, Spray Foam Magazine reported in September 2026.[8]
Why do residential buildings lead spray foam insulation sales by end use?
Residential buildings are estimated at 45.4% of end use sales in 2026, against about 36.2% for commercial buildings and 18.4% for industrial sites.
Table 6: End Use Share for the Spray Foam Insulation Market (percentage share), 2026
| End Use | Estimated Share (2026) |
|---|---|
| Residential | 45.4% |
| Commercial | 36.2% |
| Industrial | 18.4% |
| Total | 100.0% |
Residential buildings are the largest end use, with 45.4% share expected in 2026, as home builders and retrofit contractors use spray foam in walls, attics and crawl spaces of single-family homes. Commercial buildings, about 36.2%, include offices, warehouses and retail stores that use closed-cell foam on roofs and walls, and Installed Building Products reported 14.1% commercial sales growth in Q2 2026.[3] Industrial sites, near 18.4%, use foam on tanks, pipes and cold storage. New home completions are falling in the United States, so commercial work is gaining part of the share over the forecast period. Homeowners will keep choosing spray foam for comfort and energy savings, and commercial owners will choose foam roofs to avoid tear-off costs.
- Single-family homes, multi-family buildings and home retrofits make up residential demand.
- In the June 2026 quarter, overall completions tracked by Installed Building Products fell 4.9%, and single-family completions fell 5.8%.[3]
What are the drivers, restraints, and opportunities in the spray foam insulation market?
Tighter energy codes and higher energy prices push builders toward air-sealing insulation. Chemical price rises and buyer doubts about installation quality hold back some jobs, and commercial roofs and lower-carbon systems open new work.
- Driver: Building owners facing higher energy bills want insulation that also seals air leaks, which favours spray foam in walls and roofs.
- Restraint: Isocyanate price rises and concern among lenders and buyers about poorly installed foam make some homeowners choose cheaper fibre insulation.
- Opportunity: Commercial roof retrofits and lower-carbon foam chemistry give contractors larger jobs and access to green building projects.
Energy Costs Push Builders Toward Air-Sealing Insulation
Key driver analysis points at energy prices and stricter building codes. Rockwool said in August 2026 that energy price increases are driving greater focus on energy efficiency in the built environment.[7] Buyers of green building products are also adding orders, and sales in the green building materials market are expected to expand by an 11.3% CAGR. Builders meeting air tightness tests will specify spray foam on walls and rim joists that fibre products cannot seal.
Chemical Prices and Installation Doubts Hold Back Some Jobs
Producers of spray foam insulation face rising chemical costs and buyer doubts. Huntsman said rising and volatile energy and crude oil costs, particularly in Europe, remain a headwind.[1] Some insurers in the United Kingdom declined cover for homes with foam in roof assemblies and basements, and most reported problems came from poor installation.[8] Contractors with trained crews and documented jobs will keep buyer confidence, and untrained installers will lose work.
Commercial Roofs and Low-Carbon Systems Open New Work
Growth of the spray foam insulation market will come from commercial roofs and lower-carbon systems. Covestro offers pMDI with a 25% lower product carbon footprint for European insulation makers.[6] Heat pumps work best in sealed buildings, and the heat pump market is expected to expand at 10.2% CAGR, which adds retrofit insulation work before each installation. Contractors offering foam roofs with long warranties will gain re-roofing contracts from warehouse owners.
Which country CAGRs are profiled in the spray foam insulation market?
Table 7: Country CAGR Comparison for the Spray Foam Insulation Market (CAGR percentage), 2026 to 2036
| Country | CAGR (2026 to 2036) |
|---|---|
| India | 7.5% |
| China | 7% |
| Australia and New Zealand | 6.8% |
| United States | 6.5% |
| Canada | 6% |
| United Kingdom | 5.8% |
| Germany | 5.6% |
How do country-level CAGRs compare in the spray foam insulation market?
Indian builders following the Energy Conservation Building Code and IGBC and GRIHA green ratings are adding foam to commercial towers, so India leads at 7.5% per FMI's country model. China is expected at 7%, with cold-chain warehouses and new urban floor area adding closed-cell jobs. Australian contractors now buy locally certified foam, which gives Australia and New Zealand a 6.8% rate. Commercial work offsets weak new housing in the United States, which is expected at 6.5%. In Canada, long winters and cold storage growth point to 6%. Lender caution slows the United Kingdom to 5.8%. German builders prefer boards and mineral wool, so Germany grows at 5.6%.
- Green building codes in India favour high-performance insulation.
- Chinese cold-chain builders are ordering closed-cell foam for warehouse walls.
- Australian Made certification for Huntsman systems eases local supply in Australia and New Zealand.
- Commercial roofing offsets fewer new homes in the United States.
- Cold winters and warehouse growth support foam in Canada.
- Mortgage lenders in the United Kingdom are wary of foam in roof spaces.
- Board and mineral wool systems dominate German wall insulation.
Full report country CAGRs cover: Green building codes in India, cold chain sheds in China and certified local supply in Australia and New Zealand put those three over 6.7% in FMI's full report. The United States, Canada and the United Kingdom are a little under that figure, and Germany is lowest. Regional estimates cover Latin America, Eastern Europe and Middle East and Africa.
Country-wise Analysis
India Spray Foam Insulation Market Outlook (2026 to 2036)
Demand for spray foam insulation in India is rising with commercial towers, data halls and cold stores that follow the Energy Conservation Building Code. Developers seeking IGBC and GRIHA ratings use closed-cell foam on roofs and cold rooms to meet energy targets. FMI analysts expect a 7.5% CAGR for India from a small base.
Key takeaway: Green ratings and cold storage give India the highest growth.
China Spray Foam Insulation Market Outlook (2026 to 2036)
China builds the largest volume of new floor area, and cold-chain warehouses and industrial plants use closed-cell foam on walls and roofs. Huntsman reported higher equity earnings from the China joint venture in Q2 2026, which shows active MDI supply in the country.[1] Domestic foam system makers compete on price with global brands. China is expected to add foam volume at 7%.
Key takeaway: Cold stores and factory sheds give China a 7% rate, three-tenths over 6.7%.
Australia and New Zealand Spray Foam Insulation Market Outlook (2026 to 2036)
Huntsman Heatlok ECO and Classic LD-C-50 systems gained Australian Made certification in October 2026, supplied through Pacific Urethanes, with CodeMark approval and Group 2 fire performance when used with DC315 intumescent coating.[4] Local supply and fire approval make foam easier to specify on Australian commercial jobs. The outlook for Australia and New Zealand is 6.8%.
Key takeaway: Certified local supply opens commercial specifications in Australia.
United States Spray Foam Insulation Market Outlook (2026 to 2036)
Spray foam work in the United States is moving from new homes toward commercial roofs and retrofits. For Installed Building Products, new-home sales came to USD 522.6 million over April to June 2026, a decline, and commercial sales rose to USD 141.0 million.[3] Carlisle recently launched SealTite PRO HYX with up to 6,200 board feet per set.[2] Growth of 6.5% is forecast for the United States, a little short of the market average.
Key takeaway: Commercial work carries the United States through a weak housing cycle.
Canada Spray Foam Insulation Market Outlook (2026 to 2036)
Canadian builders use closed-cell foam on basement walls, rim joists and cathedral ceilings to handle long winters. Cold storage and warehouse expansion add commercial jobs. Contractors serve both markets with the same high-pressure rigs. The outlook for Canada is a 6% CAGR.
Key takeaway: Cold winters and warehouses support spray foam insulation demand in Canada.
United Kingdom Spray Foam Insulation Market Outlook (2026 to 2036)
Sales of spray foam insulation in the United Kingdom are held back by lender and insurer caution. Some mortgage lenders refused loans and some insurers declined cover for homes with foam in roof assemblies and basements, after moisture problems from poor installation.[8] Contractors are moving to commercial jobs and fire-resistant grades. Spray foam insulation sales in the United Kingdom are likely to rise at 5.8%, held back by mortgage checks.
Key takeaway: Lender caution slows residential foam in the United Kingdom.
Germany Spray Foam Insulation Market Outlook (2026 to 2036)
German builders mostly insulate walls with mineral wool, EPS and PIR boards, so spray foam serves niche roof, basement and renovation work. Covestro supplies a lower-carbon pMDI grade from German sites for insulation customers in Europe.[6] Foam formulators will use such grades to meet product declarations on public projects. With a 5.6% CAGR, Germany has the slowest outlook in the table.
Key takeaway: Board-based building habits keep Germany slowest among the profiled countries.
Who are the notable companies in the spray foam insulation market?
Huntsman, BASF, Dow, Carlisle, Johns Manville, Saint-Gobain, Sunvek, Leehwa Polytech, SprayIT Solutions and Installed Building Products are the profiled companies.
Chemical system houses formulate the foam, building products groups sell branded systems, and installation contractors buy and apply the foam. FMI profiles ten companies across these roles. Huntsman sells Heatlok closed-cell systems and is merging with Olin.[5] Carlisle sells SealTite closed-cell and open-cell foams.[2] BASF and Dow supply polyurethane systems, and Johns Manville and Saint-Gobain sell foam alongside fibre insulation.
- Chemical system houses: Huntsman, BASF and Dow.
- Building products groups: Carlisle, Johns Manville and Saint-Gobain.
- Regional foam system suppliers: Sunvek, Leehwa Polytech and SprayIT Solutions.
- Installation contractors: Installed Building Products.
Competitive Benchmarking: Spray Foam Insulation Market
Table 8: Competitive Benchmarking for the Spray Foam Insulation Market (qualitative documentation ratings), 2026
| Company | Closed-Cell Range | Open-Cell Range | Regional Reach | Recency |
|---|---|---|---|---|
| Huntsman | High | High | High | High |
| Carlisle | High | High | Medium | High |
| BASF | Medium | Medium | High | Low |
| Dow | Medium | Low | High | Low |
| Johns Manville | Medium | Medium | Medium | Low |
FMI ratings count the dated product and company releases found for each supplier, and no rating ranks share.
Key Developments in the Spray Foam Insulation Market
- On 20 October 2026, Spray Foam Magazine reported Australian Made certification for Huntsman Heatlok ECO and Classic LD-C-50.[4]
- On 30 September 2026, Spray Foam Magazine reported the launch of Carlisle SealTite PRO HYX closed-cell foam.[2]
- On 30 September 2026, Spray Foam Magazine reported lender and insurer caution on spray foam homes in the United Kingdom.[8]
- On 23 September 2026, Covestro introduced Desmodur ClimateValue pMDI with a lower product carbon footprint.[6]
- On 19 August 2026, Rockwool linked higher energy prices to greater focus on energy efficiency in buildings.[7]
- On 6 August 2026, commercial work gave Installed Building Products 14.1% sales growth in that segment over the June quarter, against a fall in new-home sales.[3]
- On 30 July 2026, Huntsman said Polyurethanes, the division supplying spray foam chemicals, grew sales 16% in Q2 2026.[1]
- On 16 June 2026, Olin and Huntsman announced an all-stock merger of equals.[5]
Key Players in the Spray Foam Insulation Market
Chemical System Houses
- Huntsman
- BASF
- Dow
Building Products Groups
- Carlisle
- Johns Manville
- Saint-Gobain
Regional Foam System Suppliers
- Sunvek
- Leehwa Polytech
- SprayIT Solutions
Installation Contractors
- Installed Building Products
Spray Foam Insulation Market - Report Scope
Table 9: Report Scope for the Spray Foam Insulation Market (coverage fields and definitions), 2026 to 2036
| Coverage field | Report scope |
|---|---|
| Market breakdown | Product type; application; end use; region |
| Quantitative units | USD million |
| Market definition | Closed-cell and open-cell polyurethane spray foam systems applied by high-pressure or low-pressure equipment for wall, roof, floor, attic, ceiling and HVAC insulation in residential, commercial and industrial buildings. |
| Regions covered | North America; Latin America; Western Europe; Eastern Europe; East Asia; South Asia and Pacific; Middle East and Africa |
| Countries covered | United States; Canada; Brazil; Mexico; Argentina; Chile; Germany; France; United Kingdom; Italy; Spain; Benelux; Nordics; Poland; Czech Republic; Romania; Hungary; China; Japan; South Korea; India; ASEAN; Australia and New Zealand; GCC Countries; South Africa; Türkiye; Israel |
| Key companies profiled | Huntsman, BASF, Dow, Carlisle, Johns Manville, Saint-Gobain, Sunvek, Leehwa Polytech, SprayIT Solutions, Installed Building Products |
| Forecast period | 2026 to 2036 |
Spray Foam Insulation Market - Research Methodology
Table 10: Research Methodology for the Spray Foam Insulation Market (research methods and approach), 2026 edition
| Method | Approach |
|---|---|
| Data Sources | Chemical maker and installer results, product releases, merger announcements and spray foam trade press from May 2025 onward. |
| Desk Research | Desk research covers MDI prices, foam system launches, installer volumes, rival insulation sales and lender attitudes. |
| Market Sizing and Forecasting | Sizing starts from the 2026 base of USD 2,327.7 million and the 6.7% CAGR for 2026 to 2036. |
| Data Validation | Prices, sales and product figures were matched to the company release or trade article that carried each figure. |
Spray Foam Insulation Market by Segments
Spray Foam Insulation Market segmented by Product Type:
- Closed-Cell Spray Foam
- Open-Cell Spray Foam
Spray Foam Insulation Market segmented by Application:
- Wall Insulation
- Roofing and Flooring
- Attics and Ceilings
- HVAC Systems
- Others
Spray Foam Insulation Market segmented by End Use:
- Residential
- Commercial
- Industrial
Spray Foam Insulation Market by Region
- North America
- United States
- Canada
- Latin America
- Brazil
- Mexico
- Argentina
- Chile
- Western Europe
- Germany
- France
- United Kingdom
- Italy
- Spain
- Benelux
- Nordics
- Eastern Europe
- Poland
- Czech Republic
- Romania
- Hungary
- East Asia
- China
- Japan
- South Korea
- South Asia and Pacific
- India
- ASEAN
- Australia and New Zealand
- Middle East and Africa
- GCC Countries
- South Africa
- Türkiye
- Israel
Research Sources and Bibliography
- [1] Huntsman Corporation. (2026, July 30). Huntsman Announces Second Quarter 2026 Earnings. https://www.huntsman.com/news/media-releases/detail/629/huntsman-announces-second-quarter-2026-earnings
- [2] Spray Foam Magazine. (2026, September 30). The Next Evolution in Closed-Cell Foam. https://www.sprayfoammagazine.com/foam-news/the-next-evolution-in-closed-cell-foam/4745
- [3] Installed Building Products. (2026, August 6). Installed Building Products Reports Second Quarter 2026 Results. https://investors.installedbuildingproducts.com/news-releases/news-release-details/installed-building-products-reports-second-quarter-2026-results
- [4] Spray Foam Magazine. (2026, October 20). Huntsman's Heatlok ECO and Classic LD-C-50 Spray Foam Earn Australian Made Certification. https://www.sprayfoammagazine.com/foam-news/huntsmans-heatlok-eco-and-classic-ld-c-50-spray-foam-earn-australian-made-certification/4758
- [5] Huntsman Corporation. (2026, June 16). Olin and Huntsman Announce Transformative Merger of Equals. https://www.huntsman.com/news/media-releases/detail/626/olin-and-huntsman-announce-transformative-merger-of-equals
- [6] Covestro. (2026, September 23). Covestro introduces pMDI with verified reduced Product Carbon Footprint (PCF). https://www.covestro.com/press/covestro-introduces-pmdi-with-verified-reduced-product-carbon-footprint-pcf/
- [7] ROCKWOOL Group. (2026, August 19). ROCKWOOL releases H1 2026 results. https://www.rockwool.com/group/about-us/news/2026/rockwool-releases-h1-2026-results/
- [8] Spray Foam Magazine. (2026, September 30). Spray Foam Insulation and Home Resale. https://www.sprayfoammagazine.com/foam-news/spray-foam-insulation-and-home-resale/4741
This bibliography is provided for reader reference. The full report contains the complete reference list and detailed citations.
This Report Answers
- How big is the spray foam insulation market during 2026?
- What market size is projected by 2036?
- Which product type holds notable share?
- Which application holds notable share?
- Which countries have notable growth?
- Which companies are notable in the market?
Table of Content
- Key Takeaways
- Market Size and CAGR
- Top Growth Driver
- Fastest Growing Segment
- Leading Region
- Key Companies
- Emerging Opportunities
- Executive Summary
- Global Market Outlook
- Demand-side Trends
- Supply-side Trends
- Technology Roadmap Analysis
- Analysis and Recommendations
- Analyst Perspective (What is happening? Why now? What should investors know?)
- Key Questions Answered
- How large is the market?
- What is the CAGR?
- What are key trends?
- Which region dominates?
- Who are the leaders?
Read More...
- Market Overview
- Market Coverage / Taxonomy
- Market Definition / Scope / Limitations
- Research Methodology
- Chapter Orientation
- Analytical Lens and Working Hypotheses
- Market Structure, Signals, and Trend Drivers
- Benchmarking and Cross-market Comparability
- Market Sizing, Forecasting, and Opportunity Mapping
- Research Design and Evidence Framework
- Desk Research Programme (Secondary Evidence)
- Expert Input and Fieldwork (Primary Evidence)
- Tooling, Models, and Reference Databases
- Data Engineering and Model Build
- Quality Assurance and Audit Trail
- Market Background
- Market Dynamics (Drivers, Restraints, Opportunity, Trends)
- Scenario Forecast (Optimistic, Likely, Conservative)
- Impact Analysis
- AI Impact
- Sustainability Impact
- Regulatory Impact
- Technology Impact
- Consumer / Buyer Analysis
- Purchase Drivers
- Adoption Barriers
- Buyer Journey
- Opportunity Map Analysis
- Product Life Cycle Analysis
- Supply Chain Analysis
- Investment Feasibility Matrix
- Value Chain Analysis
- PESTLE and Porter's Analysis
- Regulatory Landscape
- Regional Parent Market Outlook
- Production and Consumption Statistics
- Import and Export Statistics
- Global Market Analysis and Forecast, 2021 to 2036
- Historical Market Size Value (USD Million) Analysis, 2021 to 2025
- Current and Future Market Size Value (USD Million) Projections, 2026 to 2036
- Y-o-Y Growth Trend Analysis
- Absolute $ Opportunity Analysis
- Global Market Pricing Analysis, 2021 to 2036
- Global Market Analysis and Forecast, By Product Type, 2021 to 2036
- Introduction / Key Findings
- Historical Market Size Value (USD Million) Analysis By Product Type, 2021 to 2025
- Current and Future Market Size Value (USD Million) Analysis and Forecast By Product Type, 2026 to 2036
- Closed-Cell Spray Foam
- Open-Cell Spray Foam
- Y-o-Y Growth Trend Analysis By Product Type, 2021 to 2025
- Absolute $ Opportunity Analysis By Product Type, 2026 to 2036
- Global Market Analysis and Forecast, By Application, 2021 to 2036
- Introduction / Key Findings
- Historical Market Size Value (USD Million) Analysis By Application, 2021 to 2025
- Current and Future Market Size Value (USD Million) Analysis and Forecast By Application, 2026 to 2036
- Wall Insulation
- Roofing and Flooring
- Attics and Ceilings
- HVAC Systems
- Others
- Y-o-Y Growth Trend Analysis By Application, 2021 to 2025
- Absolute $ Opportunity Analysis By Application, 2026 to 2036
- Global Market Analysis and Forecast, By End Use, 2021 to 2036
- Introduction / Key Findings
- Historical Market Size Value (USD Million) Analysis By End Use, 2021 to 2025
- Current and Future Market Size Value (USD Million) Analysis and Forecast By End Use, 2026 to 2036
- Residential
- Commercial
- Industrial
- Y-o-Y Growth Trend Analysis By End Use, 2021 to 2025
- Absolute $ Opportunity Analysis By End Use, 2026 to 2036
- Global Market Analysis and Forecast, By Region, 2021 to 2036
- Introduction
- Historical Market Size Value (USD Million) Analysis By Region, 2021 to 2025
- Current Market Size Value (USD Million) Analysis and Forecast By Region, 2026 to 2036
- North America
- Latin America
- Western Europe
- Eastern Europe
- East Asia
- South Asia and Pacific
- Middle East and Africa
- Market Attractiveness Analysis By Region
- North America Market Analysis and Forecast, By Country, 2021 to 2036
- Historical Market Size Value (USD Million) Trend Analysis By Market Taxonomy, 2021 to 2025
- Market Size Value (USD Million) Forecast By Market Taxonomy, 2026 to 2036
- By Country
- United States
- Canada
- By Product Type
- By Application
- By End Use
- By Country
- Market Attractiveness Analysis
- By Country
- By Product Type
- By Application
- By End Use
- Key Takeaways
- Latin America Market Analysis and Forecast, By Country
- Historical Market Size Value (USD Million) Trend Analysis By Market Taxonomy, 2021 to 2025
- Market Size Value (USD Million) Forecast By Market Taxonomy, 2026 to 2036
- By Country
- Brazil
- Mexico
- Argentina
- Chile
- By Product Type
- By Application
- By End Use
- By Country
- Market Attractiveness Analysis
- By Country
- By Product Type
- By Application
- By End Use
- Key Takeaways
- Western Europe Market Analysis and Forecast, By Country
- Historical Market Size Value (USD Million) Trend Analysis By Market Taxonomy, 2021 to 2025
- Market Size Value (USD Million) Forecast By Market Taxonomy, 2026 to 2036
- By Country
- Germany
- France
- United Kingdom
- Italy
- Spain
- Benelux
- Nordics
- By Product Type
- By Application
- By End Use
- By Country
- Market Attractiveness Analysis
- By Country
- By Product Type
- By Application
- By End Use
- Key Takeaways
- Eastern Europe Market Analysis and Forecast, By Country
- Historical Market Size Value (USD Million) Trend Analysis By Market Taxonomy, 2021 to 2025
- Market Size Value (USD Million) Forecast By Market Taxonomy, 2026 to 2036
- By Country
- Poland
- Czech Republic
- Romania
- Hungary
- By Product Type
- By Application
- By End Use
- By Country
- Market Attractiveness Analysis
- By Country
- By Product Type
- By Application
- By End Use
- Key Takeaways
- East Asia Market Analysis and Forecast, By Country
- Historical Market Size Value (USD Million) Trend Analysis By Market Taxonomy, 2021 to 2025
- Market Size Value (USD Million) Forecast By Market Taxonomy, 2026 to 2036
- By Country
- China
- Japan
- South Korea
- By Product Type
- By Application
- By End Use
- By Country
- Market Attractiveness Analysis
- By Country
- By Product Type
- By Application
- By End Use
- Key Takeaways
- South Asia and Pacific Market Analysis and Forecast, By Country
- Historical Market Size Value (USD Million) Trend Analysis By Market Taxonomy, 2021 to 2025
- Market Size Value (USD Million) Forecast By Market Taxonomy, 2026 to 2036
- By Country
- India
- ASEAN
- Australia and New Zealand
- By Product Type
- By Application
- By End Use
- By Country
- Market Attractiveness Analysis
- By Country
- By Product Type
- By Application
- By End Use
- Key Takeaways
- Middle East and Africa Market Analysis and Forecast, By Country
- Historical Market Size Value (USD Million) Trend Analysis By Market Taxonomy, 2021 to 2025
- Market Size Value (USD Million) Forecast By Market Taxonomy, 2026 to 2036
- By Country
- GCC Countries
- South Africa
- Türkiye
- Israel
- By Product Type
- By Application
- By End Use
- By Country
- Market Attractiveness Analysis
- By Country
- By Product Type
- By Application
- By End Use
- Key Takeaways
- Key Countries Market Analysis
- United States
- Pricing Analysis
- Market Share Analysis, 2025
- By Product Type
- By Application
- By End Use
- Canada
- Pricing Analysis
- Market Share Analysis, 2025
- By Product Type
- By Application
- By End Use
- Mexico
- Pricing Analysis
- Market Share Analysis, 2025
- By Product Type
- By Application
- By End Use
- Brazil
- Pricing Analysis
- Market Share Analysis, 2025
- By Product Type
- By Application
- By End Use
- Chile
- Pricing Analysis
- Market Share Analysis, 2025
- By Product Type
- By Application
- By End Use
- Germany
- Pricing Analysis
- Market Share Analysis, 2025
- By Product Type
- By Application
- By End Use
- United Kingdom
- Pricing Analysis
- Market Share Analysis, 2025
- By Product Type
- By Application
- By End Use
- Italy
- Pricing Analysis
- Market Share Analysis, 2025
- By Product Type
- By Application
- By End Use
- Spain
- Pricing Analysis
- Market Share Analysis, 2025
- By Product Type
- By Application
- By End Use
- France
- Pricing Analysis
- Market Share Analysis, 2025
- By Product Type
- By Application
- By End Use
- India
- Pricing Analysis
- Market Share Analysis, 2025
- By Product Type
- By Application
- By End Use
- ASEAN
- Pricing Analysis
- Market Share Analysis, 2025
- By Product Type
- By Application
- By End Use
- Australia and New Zealand
- Pricing Analysis
- Market Share Analysis, 2025
- By Product Type
- By Application
- By End Use
- China
- Pricing Analysis
- Market Share Analysis, 2025
- By Product Type
- By Application
- By End Use
- Japan
- Pricing Analysis
- Market Share Analysis, 2025
- By Product Type
- By Application
- By End Use
- South Korea
- Pricing Analysis
- Market Share Analysis, 2025
- By Product Type
- By Application
- By End Use
- Poland
- Pricing Analysis
- Market Share Analysis, 2025
- By Product Type
- By Application
- By End Use
- Hungary
- Pricing Analysis
- Market Share Analysis, 2025
- By Product Type
- By Application
- By End Use
- Türkiye
- Pricing Analysis
- Market Share Analysis, 2025
- By Product Type
- By Application
- By End Use
- South Africa
- Pricing Analysis
- Market Share Analysis, 2025
- By Product Type
- By Application
- By End Use
- United States
- Market Structure Analysis
- Competition Dashboard
- Competition Benchmarking
- Market Share Analysis of Top Players
- By Regional
- By Product Type
- By Application
- By End Use
- Emerging Startups
- Innovation Benchmarking
- Competition Analysis
- Competition Deep Dive
- Huntsman
- Overview
- Product Portfolio
- Profitability by Market Segments
- Sales Footprint
- Strategy Overview
- Marketing Strategy
- Product Strategy
- Channel Strategy
- Carlisle
- BASF
- Dow
- Johns Manville
- Saint-Gobain
- Sunvek
- Leehwa Polytech
- SprayIT Solutions
- Installed Building Products
- Huntsman
- Case Studies
- Success Stories
- Recent Developments
- Competition Deep Dive
- Assumptions & Acronyms Used
List of Tables
- Table 1: Global Market Value (USD Million) Forecast by Region, 2021 to 2036
- Table 2: Global Market Value (USD Million) Forecast by Product Type, 2021 to 2036
- Table 3: Global Market Value (USD Million) Forecast by Application, 2021 to 2036
- Table 4: Global Market Value (USD Million) Forecast by End Use, 2021 to 2036
- Table 5: North America Market Value (USD Million) Forecast by Country, 2021 to 2036
- Table 6: North America Market Value (USD Million) Forecast by Product Type, 2021 to 2036
- Table 7: North America Market Value (USD Million) Forecast by Application, 2021 to 2036
- Table 8: North America Market Value (USD Million) Forecast by End Use, 2021 to 2036
- Table 9: Latin America Market Value (USD Million) Forecast by Country, 2021 to 2036
- Table 10: Latin America Market Value (USD Million) Forecast by Product Type, 2021 to 2036
- Table 11: Latin America Market Value (USD Million) Forecast by Application, 2021 to 2036
- Table 12: Latin America Market Value (USD Million) Forecast by End Use, 2021 to 2036
- Table 13: Western Europe Market Value (USD Million) Forecast by Country, 2021 to 2036
- Table 14: Western Europe Market Value (USD Million) Forecast by Product Type, 2021 to 2036
- Table 15: Western Europe Market Value (USD Million) Forecast by Application, 2021 to 2036
- Table 16: Western Europe Market Value (USD Million) Forecast by End Use, 2021 to 2036
- Table 17: Eastern Europe Market Value (USD Million) Forecast by Country, 2021 to 2036
- Table 18: Eastern Europe Market Value (USD Million) Forecast by Product Type, 2021 to 2036
- Table 19: Eastern Europe Market Value (USD Million) Forecast by Application, 2021 to 2036
- Table 20: Eastern Europe Market Value (USD Million) Forecast by End Use, 2021 to 2036
- Table 21: East Asia Market Value (USD Million) Forecast by Country, 2021 to 2036
- Table 22: East Asia Market Value (USD Million) Forecast by Product Type, 2021 to 2036
- Table 23: East Asia Market Value (USD Million) Forecast by Application, 2021 to 2036
- Table 24: East Asia Market Value (USD Million) Forecast by End Use, 2021 to 2036
- Table 25: South Asia and Pacific Market Value (USD Million) Forecast by Country, 2021 to 2036
- Table 26: South Asia and Pacific Market Value (USD Million) Forecast by Product Type, 2021 to 2036
- Table 27: South Asia and Pacific Market Value (USD Million) Forecast by Application, 2021 to 2036
- Table 28: South Asia and Pacific Market Value (USD Million) Forecast by End Use, 2021 to 2036
- Table 29: Middle East and Africa Market Value (USD Million) Forecast by Country, 2021 to 2036
- Table 30: Middle East and Africa Market Value (USD Million) Forecast by Product Type, 2021 to 2036
- Table 31: Middle East and Africa Market Value (USD Million) Forecast by Application, 2021 to 2036
- Table 32: Middle East and Africa Market Value (USD Million) Forecast by End Use, 2021 to 2036
List of Figures
- Figure 1: Global Market Pricing Analysis
- Figure 2: Global Market Value (USD Million) Forecast 2021-2036
- Figure 3: Global Market Value Share and BPS Analysis by Product Type, 2026 and 2036
- Figure 4: Global Market Y-o-Y Growth Comparison by Product Type, 2026-2036
- Figure 5: Global Market Attractiveness Analysis by Product Type
- Figure 6: Global Market Value Share and BPS Analysis by Application, 2026 and 2036
- Figure 7: Global Market Y-o-Y Growth Comparison by Application, 2026-2036
- Figure 8: Global Market Attractiveness Analysis by Application
- Figure 9: Global Market Value Share and BPS Analysis by End Use, 2026 and 2036
- Figure 10: Global Market Y-o-Y Growth Comparison by End Use, 2026-2036
- Figure 11: Global Market Attractiveness Analysis by End Use
- Figure 12: Global Market Value (USD Million) Share and BPS Analysis by Region, 2026 and 2036
- Figure 13: Global Market Y-o-Y Growth Comparison by Region, 2026-2036
- Figure 14: Global Market Attractiveness Analysis by Region
- Figure 15: North America Market Incremental Dollar Opportunity, 2026-2036
- Figure 16: Latin America Market Incremental Dollar Opportunity, 2026-2036
- Figure 17: Western Europe Market Incremental Dollar Opportunity, 2026-2036
- Figure 18: Eastern Europe Market Incremental Dollar Opportunity, 2026-2036
- Figure 19: East Asia Market Incremental Dollar Opportunity, 2026-2036
- Figure 20: South Asia and Pacific Market Incremental Dollar Opportunity, 2026-2036
- Figure 21: Middle East and Africa Market Incremental Dollar Opportunity, 2026-2036
- Figure 22: North America Market Value Share and BPS Analysis by Country, 2026 and 2036
- Figure 23: North America Market Value Share and BPS Analysis by Product Type, 2026 and 2036
- Figure 24: North America Market Y-o-Y Growth Comparison by Product Type, 2026-2036
- Figure 25: North America Market Attractiveness Analysis by Product Type
- Figure 26: North America Market Value Share and BPS Analysis by Application, 2026 and 2036
- Figure 27: North America Market Y-o-Y Growth Comparison by Application, 2026-2036
- Figure 28: North America Market Attractiveness Analysis by Application
- Figure 29: North America Market Value Share and BPS Analysis by End Use, 2026 and 2036
- Figure 30: North America Market Y-o-Y Growth Comparison by End Use, 2026-2036
- Figure 31: North America Market Attractiveness Analysis by End Use
- Figure 32: Latin America Market Value Share and BPS Analysis by Country, 2026 and 2036
- Figure 33: Latin America Market Value Share and BPS Analysis by Product Type, 2026 and 2036
- Figure 34: Latin America Market Y-o-Y Growth Comparison by Product Type, 2026-2036
- Figure 35: Latin America Market Attractiveness Analysis by Product Type
- Figure 36: Latin America Market Value Share and BPS Analysis by Application, 2026 and 2036
- Figure 37: Latin America Market Y-o-Y Growth Comparison by Application, 2026-2036
- Figure 38: Latin America Market Attractiveness Analysis by Application
- Figure 39: Latin America Market Value Share and BPS Analysis by End Use, 2026 and 2036
- Figure 40: Latin America Market Y-o-Y Growth Comparison by End Use, 2026-2036
- Figure 41: Latin America Market Attractiveness Analysis by End Use
- Figure 42: Western Europe Market Value Share and BPS Analysis by Country, 2026 and 2036
- Figure 43: Western Europe Market Value Share and BPS Analysis by Product Type, 2026 and 2036
- Figure 44: Western Europe Market Y-o-Y Growth Comparison by Product Type, 2026-2036
- Figure 45: Western Europe Market Attractiveness Analysis by Product Type
- Figure 46: Western Europe Market Value Share and BPS Analysis by Application, 2026 and 2036
- Figure 47: Western Europe Market Y-o-Y Growth Comparison by Application, 2026-2036
- Figure 48: Western Europe Market Attractiveness Analysis by Application
- Figure 49: Western Europe Market Value Share and BPS Analysis by End Use, 2026 and 2036
- Figure 50: Western Europe Market Y-o-Y Growth Comparison by End Use, 2026-2036
- Figure 51: Western Europe Market Attractiveness Analysis by End Use
- Figure 52: Eastern Europe Market Value Share and BPS Analysis by Country, 2026 and 2036
- Figure 53: Eastern Europe Market Value Share and BPS Analysis by Product Type, 2026 and 2036
- Figure 54: Eastern Europe Market Y-o-Y Growth Comparison by Product Type, 2026-2036
- Figure 55: Eastern Europe Market Attractiveness Analysis by Product Type
- Figure 56: Eastern Europe Market Value Share and BPS Analysis by Application, 2026 and 2036
- Figure 57: Eastern Europe Market Y-o-Y Growth Comparison by Application, 2026-2036
- Figure 58: Eastern Europe Market Attractiveness Analysis by Application
- Figure 59: Eastern Europe Market Value Share and BPS Analysis by End Use, 2026 and 2036
- Figure 60: Eastern Europe Market Y-o-Y Growth Comparison by End Use, 2026-2036
- Figure 61: Eastern Europe Market Attractiveness Analysis by End Use
- Figure 62: East Asia Market Value Share and BPS Analysis by Country, 2026 and 2036
- Figure 63: East Asia Market Value Share and BPS Analysis by Product Type, 2026 and 2036
- Figure 64: East Asia Market Y-o-Y Growth Comparison by Product Type, 2026-2036
- Figure 65: East Asia Market Attractiveness Analysis by Product Type
- Figure 66: East Asia Market Value Share and BPS Analysis by Application, 2026 and 2036
- Figure 67: East Asia Market Y-o-Y Growth Comparison by Application, 2026-2036
- Figure 68: East Asia Market Attractiveness Analysis by Application
- Figure 69: East Asia Market Value Share and BPS Analysis by End Use, 2026 and 2036
- Figure 70: East Asia Market Y-o-Y Growth Comparison by End Use, 2026-2036
- Figure 71: East Asia Market Attractiveness Analysis by End Use
- Figure 72: South Asia and Pacific Market Value Share and BPS Analysis by Country, 2026 and 2036
- Figure 73: South Asia and Pacific Market Value Share and BPS Analysis by Product Type, 2026 and 2036
- Figure 74: South Asia and Pacific Market Y-o-Y Growth Comparison by Product Type, 2026-2036
- Figure 75: South Asia and Pacific Market Attractiveness Analysis by Product Type
- Figure 76: South Asia and Pacific Market Value Share and BPS Analysis by Application, 2026 and 2036
- Figure 77: South Asia and Pacific Market Y-o-Y Growth Comparison by Application, 2026-2036
- Figure 78: South Asia and Pacific Market Attractiveness Analysis by Application
- Figure 79: South Asia and Pacific Market Value Share and BPS Analysis by End Use, 2026 and 2036
- Figure 80: South Asia and Pacific Market Y-o-Y Growth Comparison by End Use, 2026-2036
- Figure 81: South Asia and Pacific Market Attractiveness Analysis by End Use
- Figure 82: Middle East and Africa Market Value Share and BPS Analysis by Country, 2026 and 2036
- Figure 83: Middle East and Africa Market Value Share and BPS Analysis by Product Type, 2026 and 2036
- Figure 84: Middle East and Africa Market Y-o-Y Growth Comparison by Product Type, 2026-2036
- Figure 85: Middle East and Africa Market Attractiveness Analysis by Product Type
- Figure 86: Middle East and Africa Market Value Share and BPS Analysis by Application, 2026 and 2036
- Figure 87: Middle East and Africa Market Y-o-Y Growth Comparison by Application, 2026-2036
- Figure 88: Middle East and Africa Market Attractiveness Analysis by Application
- Figure 89: Middle East and Africa Market Value Share and BPS Analysis by End Use, 2026 and 2036
- Figure 90: Middle East and Africa Market Y-o-Y Growth Comparison by End Use, 2026-2036
- Figure 91: Middle East and Africa Market Attractiveness Analysis by End Use
- Figure 92: Global Market - Tier Structure Analysis
- Figure 93: Global Market - Company Share Analysis
Frequently Asked Questions
How large is the spray foam insulation market expected in 2026?
FMI places 2026 spray foam insulation sales at USD 2,327.7 million, up from USD 2,181.5 million in 2025. The spray foam insulation market is projected to reach USD 4,452.1 million by 2036.
What CAGR is projected for the spray foam insulation market through 2036?
A 6.7% CAGR is forecast for the spray foam insulation market from 2026 to 2036. Energy-saving retrofits, stricter codes and commercial roof work carry that growth.
Which product type holds a notable market share in 2026?
Product type sales are led by closed-cell spray foam, expected at 61.3% share in 2026. Open-cell spray foam follows at an estimated 38.7%.
Which application holds a notable market share in 2026?
The top application is wall insulation, likely to hold 42.2% share in 2026. Roofing and flooring follow at an estimated 24.6%.
Which country has a notable expansion outlook through 2036?
India has the highest rate in the FMI country table, a 7.5% CAGR. China follows at 7%.
Who are the key companies in the spray foam insulation market?
The profiled set is led by chemical system houses Huntsman, BASF and Dow, with Carlisle, Johns Manville and Saint-Gobain among building products groups. Sunvek, Leehwa Polytech, SprayIT Solutions and Installed Building Products complete the group.
Preview the report firsthand - request a free sample
Get SampleGet the brochure for pricing and purchase details.
Get PDF
