Colour Cosmetics Market Overview for 2024 to 2034

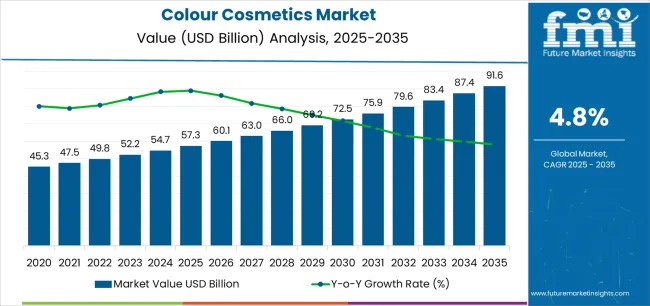
The colour cosmetics market is expected to grow at a CAGR of 4.8% during the projected period. The market value is projected to increase from US$ 54,772 million in 2024 to US$ 87,916 million by 2034.

Attributes Details
Colour Cosmetics Market Size, 2024 US$ 54,772 million
Projected Market Size, 2034 US$ 87,916 million
Value-based CAGR (2024 to 2034) 4.8%

Don't pay for what you don't need

Customize your report by selecting specific countries or regions and save 30%!

Colour Cosmetics Market Size, Analysis, and Insights

  • The growth of the fashion industry has contributed to the growth of the colour cosmetics market.
  • The fashion industry is constantly evolving, and new trends are emerging every season. Evolution resulted in the launch of new cosmetic products that cater to the changing needs of consumers.
  • As an increasing number of working women joining the workforce, the need for cosmetics catering to their needs is growing. Currently, women are looking for products that are long-lasting, easy to use, and provide a flawless finish, which increases the demand for colour cosmetics.
  • The rise of eCommerce platforms has made it easier for consumers to access a wide range of cosmetic products from the comfort of their homes.
  • The platforms lead to an increase in competition among cosmetic brands, which has resulted in the launch of new and innovative products at competitive prices.
  • The rise in disposable income across the globe has led to an increase in purchasing power, which has increased the demand for cosmetics.
  • The growing popularity of social media platforms leads to an increase in the awareness of beauty products, which has further fueled the demand for colour cosmetics.

Key Opportunities in the Colour Cosmetics Market

  • Organic products present an opportunity for manufacturers to invest in research and development of natural products. Consumers are becoming increasingly aware of the harmful chemicals used in cosmetics and are shifting toward organic and natural products.
  • E-commerce has revolutionized the way consumers shop for cosmetics. Manufacturers can leverage this trend by creating their own eCommerce platforms or by partnering with popular eCommerce platforms to reach a wider audience.
  • Consumers are looking for products that serve multiple purposes. Manufacturers can capitalize on this trend by creating products that offer a variety of benefits, such as moisturizing, sun protection, and anti-aging creams.
  • Increasing demand for personalized products is expected to create significant opportunities during the forecast period.
  • The growing trend toward men’s cosmetics is presenting an opportunity for manufacturers to create products specifically targeted towards men.
Sudip Saha
Sudip Saha

Principal Consultant

Talk to Analyst

Find your sweet spots for generating winning opportunities in this market.

Challenges in the Colour Cosmetics Market

  • Rapidly changing consumer preferences and trends are expected to hamper the market over the forecast period.
  • With consumers becoming more conscious about the ingredients used in their cosmetics, manufacturers need to ensure that their products are safe, effective, and meet high ethical standards.
  • Manufacturers need to keep the prices of their products competitive while maintaining high-quality standards, which can be difficult when production costs are increasing.
  • Brand loyalty is another challenge in the color cosmetics market. With so many options available, consumers can be fickle and easily swayed by new and trendy products.
  • Regulatory compliance is a significant challenge for manufacturers.
  • The color cosmetics market is heavily regulated, and manufacturers need to comply with various safety and quality standards. Maintaining safety and quality standards is a time-consuming and costly process, but it is crucial for ensuring the safety of consumers and building trust in the brand.

Comparative View of Adjacent Markets

In addition to the colour cosmetics market, a thorough analysis has been conducted on two other associated markets namely, the herbal beauty product market and the tinted cosmetics market.

The increasing awareness among consumers about the harmful effects of chemicals used in beauty products has led to a shift toward natural and herbal beauty products. The growing preference for natural and minimal makeup looks leads to the growth of the tinted cosmetics market.

Colour Cosmetics Market:

Attributes Colour Cosmetics Market
Value-based CAGR (2024 to 2034) 4.8%
Market Trends Growth of the fashion industry
Growth Opportunities Rising demand for multifunctional products

Herbal Beauty Products Market:

Attributes Herbal Beauty Products Market
Value-based CAGR (2024 to 2034) 6.1%
Market Trends Increasing preference for herbal ingredients serving as natural remedies for acne skin and hair-related problems.
Growth Opportunities Increased social media visibility through advertisements and various promotional activities conducted across social media sites like Instagram, YouTube, etc.

Tinted Cosmetics Market:

Attributes Tinted Cosmetics Market
Value-based CAGR (2024 to 2034) 4.3%
Market Trends Rising consumer spending on cosmetics across the world is a key factor expected to boost sales of tinted cosmetics during the forecast period.
Growth Opportunities Growing focus on getting a natural and makeup-free look coupled with rising consumer awareness about the benefits of tinted cosmetics.

Get the data you need at a Fraction of the cost

Personalize your report by choosing insights you need
and save 40%!

Category-wise Insights

The Natural and Organic Segment Dominates the Market by Product Type

Attributes Details
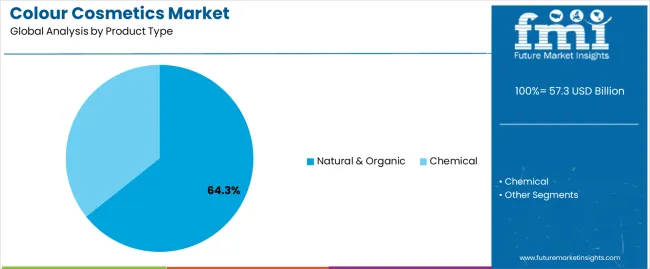
Top Product Type Natural and organic
Market share in 2024 64.3%
  • The increasing awareness and demand for clean and sustainable beauty products are driving the segment’s growth.
  • Consumers are becoming more conscious of the ingredients used in their cosmetics and are actively seeking products made from natural and organic ingredients that are free from harmful chemicals.
  • The trend towards natural and organic cosmetics is not limited to a particular region or market. This trend is gaining traction globally, with consumers in both developed and developing countries showing a growing preference for natural and organic products.
  • The growing popularity of eCommerce platforms drives the demand for natural and organic products, which makes it easier for consumers to access a wide variety of natural and organic cosmetics.

The eCommerce Segment Dominates the Market by Distribution Channel

Attributes Details
Top Distribution Channel E-commerce
Market CAGR in 2024 31.8%
  • The rise in internet penetration and smartphone usage has made it easier for customers to browse and purchase products online.
  • Changing consumer preferences. With an increasing focus on health and wellness, many consumers are looking for ways to incorporate exercise into their daily routines.
  • E-commerce platforms have made it easier for customers to compare prices and read reviews, which has resulted in increased popularity of e commerce platforms.

Country-wise insights

Countries CAGR through 2034
United States 3.7%
United Kingdom 4.1%
China 7.4%
Japan 5.5%
Australia 6.8%

Growing Trend of Social Media Fueling the Beauty Industry in the United States

  • The growing trend of social media and the beauty industry's influence on it has led to an increased awareness of beauty products among consumers in the United States.
  • The rising disposable income of consumers has enabled them to spend more on premium makeup brands.
  • The United States color cosmetics market is one of the largest and most mature markets globally.
  • The demand for color cosmetics is higher in urban areas than in rural areas in the United States. Consumers in cities are more aware of beauty trends and willing to spend more on premium products.
  • The market is also highly influenced by seasonal trends, with consumers purchasing products based on the latest fashion trends in the United States.

Strong Demand for Premium and Luxury Makeup Products in the United Kingdom

  • There is a strong demand for premium and luxury makeup products in the United Kingdom.
  • The increasing diversity of the population in the United Kingdom has led to a greater demand for a wider range of makeup shades that cater to different skin tones.
  • The rise of social media platforms and beauty influencers has led to a greater focus on appearance and beauty trends among consumers in the United Kingdom.
  • The growing diversity of the population in the UK has led to a greater demand for a wider range of makeup shades that cater to different skin tones.

Rise in Disposable Income of Chinese Consumers

  • There has been a significant rise in disposable income among Chinese consumers, which has led to an increase in purchasing power.
  • The rise of social media platforms has played a major role in promoting cosmetic products in China, especially among the younger generation.
  • Growing demand for premium and high-quality products in the Chinese market, with consumers willing to pay a premium for quality and efficacy. This trend is expected to continue in the coming years, with more consumers seeking out high-end products.

Long Tradition of Valuing Beauty and Skincare in Japan

  • The country has a long tradition of valuing beauty and skincare which leads to a high demand for cosmetics among Japanese consumers.
  • The growing trend of "beauty from within” such as “wabi-sabi”. This refers to the idea that beauty is not just about external appearance but also about overall health and wellness. Japanese consumers are increasingly interested in cosmetics that not only make them look good but also have health benefits such as anti-aging properties or UV protection.
  • The rise of social media and influencer marketing. Japanese consumers are highly active on social media platforms such as Instagram and YouTube, and they are influenced by beauty bloggers and influencers who promote the latest cosmetics products.

Growing Awareness among Consumers about the Importance of Personal Grooming in South Korea

  • The growing awareness among consumers about the importance of personal grooming and appearance. Australians are becoming more interested in looking good and feeling confident, and color cosmetics are an important part of this trend.
  • The cosmetics industry in Australia has been expanding rapidly, with new brands and products regularly entering the market. There is increased competition and innovation, which has further fueled the demand for color cosmetics.
  • The rise of social media has played a significant role in promoting the use of color cosmetics, as influencers and celebrities showcase their makeup looks and trends to millions of followers.

Competitive Landscape
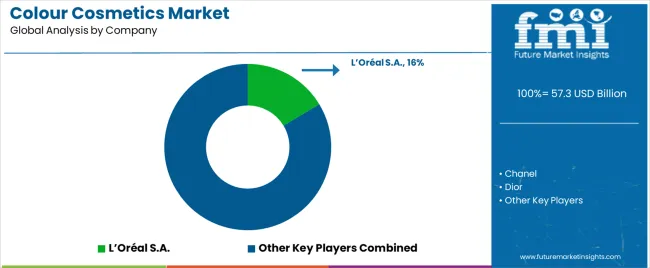
The market is constantly evolving, with new brands entering the market and established players introducing new products to stay ahead of the competition. Companies are competing on factors such as product quality, innovation, brand recognition, and pricing.

Additionally, the rise of e-commerce has made it easier for new players to enter the market and compete with established brands. Overall, the colour cosmetics market is highly competitive, with companies constantly striving to offer the best products and win over consumers.

Recent Developments

  • In 2022, Revlon opened a new brand location in Delhi, India, which offers an immersive and experiential shopping experience for customers. The store features the full range of Revlon color cosmetics, skincare, and personal care products, as well as select Revlon Professionals and Street Wear Products. In addition to its product offerings, the flagship store provides a range of hair and makeover services, including hair coloring with the Revlon Professional line, hair care, hair cutting, and hair styling, as well as party makeovers and basic grooming, all performed by expert professionals.

Key Market Players

  • Chanel
  • Dior
  • Givenchy
  • L'Oréal S.A.
  • Kroylan Professional Make-up
  • Lancôme
  • Mamaearth
  • TOM FORD S.A.
  • Plum
  • Coty Inc.
  • MAYBELLINE New York
  • Yves Saint Laurent
  • PAC Cosmetics
  • Revlon Group
  • NYX Professional Makeup
  • Shiseido Company
  • Sephora
  • Rimmel London
  • Laura Mercier
  • Julep Beauty

Key Coverage in the Colour Cosmetics Market Report

  • Beauty Industry Market Landscape
  • Makeup Products Strategies Assessment
  • Cosmetic Brands Sales Outlook
  • global forum of colour cosmetics Analysis
  • Cosmetic Products Pricing Scenario

Key Market Segments

By Product Type:

  • Chemical
  • Natural & Organic

By Prices:

  • Economic
  • Premium

By Product Category:

  • Nail Products
  • Facial Makeup
  • Eye Makeup
  • Lip Products
  • Hair Colour Products
  • Special Effects Products

By Distribution Channel:

  • Hypermarkets/Supermarkets
  • Convenience Stores
  • Specialty Stores
  • Direct Selling
  • e-Commerce

By Region:

  • North America
  • Latin America
  • East Asia
  • South Asia
  • Europe
  • Oceania
  • MEA

Frequently Asked Questions

How Big is the Colour Cosmetics Market in 2024?

The market is expected to be valued at US$ 54,772 million in 2024.

What is China’s Market Outlook?

The market in China is expected to progress at a CAGR of 7.4% over the forecast period.

Which Product Type Contributes More to the Colour Cosmetics Market?

Within the product type, the natural and organic segment is expected to hold 64.3% market share in 2024.

What is the United States Market Outlook?

The United States market is expected to rise at a 3.7% CAGR from 2024 to 2034.

What is the Projected Market Value by 2034?

The market is set to reach a valuation of around US$ 87,916 million by 2034.

What Was the Historical CAGR for the Global Market?

The demand for colour cosmetics increased at a 1.4% CAGR from 2019 to 2023.

Table of Content
1. Executive Summary

    1.1. Global Market Outlook

    1.2. Demand-side Trends

    1.3. Supply-side Trends

    1.4. Technology Roadmap Analysis

    1.5. Analysis and Recommendations

2. Market Overview

    2.1. Market Coverage / Taxonomy

    2.2. Market Definition / Scope / Limitations

3. Market Background

    3.1. Market Dynamics

        3.1.1. Drivers

        3.1.2. Restraints

        3.1.3. Opportunity

        3.1.4. Trends

    3.2. Scenario Forecast

        3.2.1. Demand in Optimistic Scenario

        3.2.2. Demand in Likely Scenario

        3.2.3. Demand in Conservative Scenario

    3.3. Opportunity Map Analysis

    3.4. Product Life Cycle Analysis

    3.5. Supply Chain Analysis

        3.5.1. Supply Side Participants and their Roles

            3.5.1.1. Producers

            3.5.1.2. Mid-Level Participants (Traders/ Agents/ Brokers)

            3.5.1.3. Wholesalers and Distributors

        3.5.2. Value Added and Value Created at Node in the Supply Chain

        3.5.3. List of Raw Material Suppliers

        3.5.4. List of Existing and Potential Buyer’s

    3.6. Investment Feasibility Matrix

    3.7. Value Chain Analysis

        3.7.1. Profit Margin Analysis

        3.7.2. Wholesalers and Distributors

        3.7.3. Retailers

    3.8. PESTLE and Porter’s Analysis

    3.9. Regulatory Landscape

        3.9.1. By Key Regions

        3.9.2. By Key Countries

    3.10. Regional Parent Market Outlook

    3.11. Production and Consumption Statistics

    3.12. Import and Export Statistics

4. Global Market Analysis 2019 to 2023 and Forecast, 2024 to 2034

    4.1. Historical Market Size Value (US$ Million) & Volume (Units) Analysis, 2019 to 2023

    4.2. Current and Future Market Size Value (US$ Million) & Volume (Units) Projections, 2024 to 2034

        4.2.1. Y-o-Y Growth Trend Analysis

        4.2.2. Absolute $ Opportunity Analysis

5. Global Market Analysis 2019 to 2023 and Forecast 2024 to 2034, By Product Type

    5.1. Introduction / Key Findings

    5.2. Historical Market Size Value (US$ Million) & Volume (Units) Analysis By Product Type, 2019 to 2023

    5.3. Current and Future Market Size Value (US$ Million) & Volume (Units) Analysis and Forecast By Product Type, 2024 to 2034

        5.3.1. Chemical

        5.3.2. Natural & Organic

    5.4. Y-o-Y Growth Trend Analysis By Product Type, 2019 to 2023

    5.5. Absolute $ Opportunity Analysis By Product Type, 2024 to 2034

6. Global Market Analysis 2019 to 2023 and Forecast 2024 to 2034, By Price Orientation

    6.1. Introduction / Key Findings

    6.2. Historical Market Size Value (US$ Million) & Volume (Units) Analysis By Price Orientation, 2019 to 2023

    6.3. Current and Future Market Size Value (US$ Million) & Volume (Units) Analysis and Forecast By Price Orientation, 2024 to 2034

        6.3.1. Economy

        6.3.2. Premium

    6.4. Y-o-Y Growth Trend Analysis By Price Orientation, 2019 to 2023

    6.5. Absolute $ Opportunity Analysis By Price Orientation, 2024 to 2034

7. Global Market Analysis 2019 to 2023 and Forecast 2024 to 2034, By Product Category

    7.1. Introduction / Key Findings

    7.2. Historical Market Size Value (US$ Million) & Volume (Units) Analysis By Product Category, 2019 to 2023

    7.3. Current and Future Market Size Value (US$ Million) & Volume (Units) Analysis and Forecast By Product Category, 2024 to 2034

        7.3.1. Nail Products

        7.3.2. Facial Makeup

        7.3.3. Eye Makeup

        7.3.4. Lip Products

        7.3.5. Hair Colour Products

        7.3.6. Special Effects Products

    7.4. Y-o-Y Growth Trend Analysis By Product Category, 2019 to 2023

    7.5. Absolute $ Opportunity Analysis By Product Category, 2024 to 2034

8. Global Market Analysis 2019 to 2023 and Forecast 2024 to 2034, By Distribution Channel

    8.1. Introduction / Key Findings

    8.2. Historical Market Size Value (US$ Million) & Volume (Units) Analysis By Distribution Channel, 2019 to 2023

    8.3. Current and Future Market Size Value (US$ Million) & Volume (Units) Analysis and Forecast By Distribution Channel, 2024 to 2034

        8.3.1. Hypermarkets/Supermarkets

        8.3.2. Convenience Stores

        8.3.3. Specialty Stores

        8.3.4. E-Commerce

    8.4. Y-o-Y Growth Trend Analysis By Distribution Channel, 2019 to 2023

    8.5. Absolute $ Opportunity Analysis By Distribution Channel, 2024 to 2034

9. Global Market Analysis 2019 to 2023 and Forecast 2024 to 2034, By Region

    9.1. Introduction

    9.2. Historical Market Size Value (US$ Million) & Volume (Units) Analysis By Region, 2019 to 2023

    9.3. Current Market Size Value (US$ Million) & Volume (Units) Analysis and Forecast By Region, 2024 to 2034

        9.3.1. North America

        9.3.2. Latin America

        9.3.3. Western Europe

        9.3.4. Eastern Europe

        9.3.5. South Asia and Pacific

        9.3.6. East Asia

        9.3.7. Middle East and Africa

    9.4. Market Attractiveness Analysis By Region

10. North America Market Analysis 2019 to 2023 and Forecast 2024 to 2034, By Country

    10.1. Historical Market Size Value (US$ Million) & Volume (Units) Trend Analysis By Market Taxonomy, 2019 to 2023

    10.2. Market Size Value (US$ Million) & Volume (Units) Forecast By Market Taxonomy, 2024 to 2034

        10.2.1. By Country

            10.2.1.1. USA

            10.2.1.2. Canada

        10.2.2. By Product Type

        10.2.3. By Price Orientation

        10.2.4. By Product Category

        10.2.5. By Distribution Channel

    10.3. Market Attractiveness Analysis

        10.3.1. By Country

        10.3.2. By Product Type

        10.3.3. By Price Orientation

        10.3.4. By Product Category

        10.3.5. By Distribution Channel

    10.4. Key Takeaways

11. Latin America Market Analysis 2019 to 2023 and Forecast 2024 to 2034, By Country

    11.1. Historical Market Size Value (US$ Million) & Volume (Units) Trend Analysis By Market Taxonomy, 2019 to 2023

    11.2. Market Size Value (US$ Million) & Volume (Units) Forecast By Market Taxonomy, 2024 to 2034

        11.2.1. By Country

            11.2.1.1. Brazil

            11.2.1.2. Mexico

            11.2.1.3. Rest of Latin America

        11.2.2. By Product Type

        11.2.3. By Price Orientation

        11.2.4. By Product Category

        11.2.5. By Distribution Channel

    11.3. Market Attractiveness Analysis

        11.3.1. By Country

        11.3.2. By Product Type

        11.3.3. By Price Orientation

        11.3.4. By Product Category

        11.3.5. By Distribution Channel

    11.4. Key Takeaways

12. Western Europe Market Analysis 2019 to 2023 and Forecast 2024 to 2034, By Country

    12.1. Historical Market Size Value (US$ Million) & Volume (Units) Trend Analysis By Market Taxonomy, 2019 to 2023

    12.2. Market Size Value (US$ Million) & Volume (Units) Forecast By Market Taxonomy, 2024 to 2034

        12.2.1. By Country

            12.2.1.1. Germany

            12.2.1.2. UK

            12.2.1.3. France

            12.2.1.4. Spain

            12.2.1.5. Italy

            12.2.1.6. Rest of Western Europe

        12.2.2. By Product Type

        12.2.3. By Price Orientation

        12.2.4. By Product Category

        12.2.5. By Distribution Channel

    12.3. Market Attractiveness Analysis

        12.3.1. By Country

        12.3.2. By Product Type

        12.3.3. By Price Orientation

        12.3.4. By Product Category

        12.3.5. By Distribution Channel

    12.4. Key Takeaways

13. Eastern Europe Market Analysis 2019 to 2023 and Forecast 2024 to 2034, By Country

    13.1. Historical Market Size Value (US$ Million) & Volume (Units) Trend Analysis By Market Taxonomy, 2019 to 2023

    13.2. Market Size Value (US$ Million) & Volume (Units) Forecast By Market Taxonomy, 2024 to 2034

        13.2.1. By Country

            13.2.1.1. Poland

            13.2.1.2. Russia

            13.2.1.3. Czech Republic

            13.2.1.4. Romania

            13.2.1.5. Rest of Eastern Europe

        13.2.2. By Product Type

        13.2.3. By Price Orientation

        13.2.4. By Product Category

        13.2.5. By Distribution Channel

    13.3. Market Attractiveness Analysis

        13.3.1. By Country

        13.3.2. By Product Type

        13.3.3. By Price Orientation

        13.3.4. By Product Category

        13.3.5. By Distribution Channel

    13.4. Key Takeaways

14. South Asia and Pacific Market Analysis 2019 to 2023 and Forecast 2024 to 2034, By Country

    14.1. Historical Market Size Value (US$ Million) & Volume (Units) Trend Analysis By Market Taxonomy, 2019 to 2023

    14.2. Market Size Value (US$ Million) & Volume (Units) Forecast By Market Taxonomy, 2024 to 2034

        14.2.1. By Country

            14.2.1.1. India

            14.2.1.2. Bangladesh

            14.2.1.3. Australia

            14.2.1.4. New Zealand

            14.2.1.5. Rest of South Asia and Pacific

        14.2.2. By Product Type

        14.2.3. By Price Orientation

        14.2.4. By Product Category

        14.2.5. By Distribution Channel

    14.3. Market Attractiveness Analysis

        14.3.1. By Country

        14.3.2. By Product Type

        14.3.3. By Price Orientation

        14.3.4. By Product Category

        14.3.5. By Distribution Channel

    14.4. Key Takeaways

15. East Asia Market Analysis 2019 to 2023 and Forecast 2024 to 2034, By Country

    15.1. Historical Market Size Value (US$ Million) & Volume (Units) Trend Analysis By Market Taxonomy, 2019 to 2023

    15.2. Market Size Value (US$ Million) & Volume (Units) Forecast By Market Taxonomy, 2024 to 2034

        15.2.1. By Country

            15.2.1.1. China

            15.2.1.2. Japan

            15.2.1.3. South Korea

        15.2.2. By Product Type

        15.2.3. By Price Orientation

        15.2.4. By Product Category

        15.2.5. By Distribution Channel

    15.3. Market Attractiveness Analysis

        15.3.1. By Country

        15.3.2. By Product Type

        15.3.3. By Price Orientation

        15.3.4. By Product Category

        15.3.5. By Distribution Channel

    15.4. Key Takeaways

16. Middle East and Africa Market Analysis 2019 to 2023 and Forecast 2024 to 2034, By Country

    16.1. Historical Market Size Value (US$ Million) & Volume (Units) Trend Analysis By Market Taxonomy, 2019 to 2023

    16.2. Market Size Value (US$ Million) & Volume (Units) Forecast By Market Taxonomy, 2024 to 2034

        16.2.1. By Country

            16.2.1.1. GCC Countries

            16.2.1.2. South Africa

            16.2.1.3. Israel

            16.2.1.4. Rest of MEA

        16.2.2. By Product Type

        16.2.3. By Price Orientation

        16.2.4. By Product Category

        16.2.5. By Distribution Channel

    16.3. Market Attractiveness Analysis

        16.3.1. By Country

        16.3.2. By Product Type

        16.3.3. By Price Orientation

        16.3.4. By Product Category

        16.3.5. By Distribution Channel

    16.4. Key Takeaways

17. Key Countries Market Analysis

    17.1. USA

        17.1.1. Pricing Analysis

        17.1.2. Market Share Analysis, 2023

            17.1.2.1. By Product Type

            17.1.2.2. By Price Orientation

            17.1.2.3. By Product Category

            17.1.2.4. By Distribution Channel

    17.2. Canada

        17.2.1. Pricing Analysis

        17.2.2. Market Share Analysis, 2023

            17.2.2.1. By Product Type

            17.2.2.2. By Price Orientation

            17.2.2.3. By Product Category

            17.2.2.4. By Distribution Channel

    17.3. Brazil

        17.3.1. Pricing Analysis

        17.3.2. Market Share Analysis, 2023

            17.3.2.1. By Product Type

            17.3.2.2. By Price Orientation

            17.3.2.3. By Product Category

            17.3.2.4. By Distribution Channel

    17.4. Mexico

        17.4.1. Pricing Analysis

        17.4.2. Market Share Analysis, 2023

            17.4.2.1. By Product Type

            17.4.2.2. By Price Orientation

            17.4.2.3. By Product Category

            17.4.2.4. By Distribution Channel

    17.5. Germany

        17.5.1. Pricing Analysis

        17.5.2. Market Share Analysis, 2023

            17.5.2.1. By Product Type

            17.5.2.2. By Price Orientation

            17.5.2.3. By Product Category

            17.5.2.4. By Distribution Channel

    17.6. UK

        17.6.1. Pricing Analysis

        17.6.2. Market Share Analysis, 2023

            17.6.2.1. By Product Type

            17.6.2.2. By Price Orientation

            17.6.2.3. By Product Category

            17.6.2.4. By Distribution Channel

    17.7. France

        17.7.1. Pricing Analysis

        17.7.2. Market Share Analysis, 2023

            17.7.2.1. By Product Type

            17.7.2.2. By Price Orientation

            17.7.2.3. By Product Category

            17.7.2.4. By Distribution Channel

    17.8. Spain

        17.8.1. Pricing Analysis

        17.8.2. Market Share Analysis, 2023

            17.8.2.1. By Product Type

            17.8.2.2. By Price Orientation

            17.8.2.3. By Product Category

            17.8.2.4. By Distribution Channel

    17.9. Italy

        17.9.1. Pricing Analysis

        17.9.2. Market Share Analysis, 2023

            17.9.2.1. By Product Type

            17.9.2.2. By Price Orientation

            17.9.2.3. By Product Category

            17.9.2.4. By Distribution Channel

    17.10. Poland

        17.10.1. Pricing Analysis

        17.10.2. Market Share Analysis, 2023

            17.10.2.1. By Product Type

            17.10.2.2. By Price Orientation

            17.10.2.3. By Product Category

            17.10.2.4. By Distribution Channel

    17.11. Russia

        17.11.1. Pricing Analysis

        17.11.2. Market Share Analysis, 2023

            17.11.2.1. By Product Type

            17.11.2.2. By Price Orientation

            17.11.2.3. By Product Category

            17.11.2.4. By Distribution Channel

    17.12. Czech Republic

        17.12.1. Pricing Analysis

        17.12.2. Market Share Analysis, 2023

            17.12.2.1. By Product Type

            17.12.2.2. By Price Orientation

            17.12.2.3. By Product Category

            17.12.2.4. By Distribution Channel

    17.13. Romania

        17.13.1. Pricing Analysis

        17.13.2. Market Share Analysis, 2023

            17.13.2.1. By Product Type

            17.13.2.2. By Price Orientation

            17.13.2.3. By Product Category

            17.13.2.4. By Distribution Channel

    17.14. India

        17.14.1. Pricing Analysis

        17.14.2. Market Share Analysis, 2023

            17.14.2.1. By Product Type

            17.14.2.2. By Price Orientation

            17.14.2.3. By Product Category

            17.14.2.4. By Distribution Channel

    17.15. Bangladesh

        17.15.1. Pricing Analysis

        17.15.2. Market Share Analysis, 2023

            17.15.2.1. By Product Type

            17.15.2.2. By Price Orientation

            17.15.2.3. By Product Category

            17.15.2.4. By Distribution Channel

    17.16. Australia

        17.16.1. Pricing Analysis

        17.16.2. Market Share Analysis, 2023

            17.16.2.1. By Product Type

            17.16.2.2. By Price Orientation

            17.16.2.3. By Product Category

            17.16.2.4. By Distribution Channel

    17.17. New Zealand

        17.17.1. Pricing Analysis

        17.17.2. Market Share Analysis, 2023

            17.17.2.1. By Product Type

            17.17.2.2. By Price Orientation

            17.17.2.3. By Product Category

            17.17.2.4. By Distribution Channel

    17.18. China

        17.18.1. Pricing Analysis

        17.18.2. Market Share Analysis, 2023

            17.18.2.1. By Product Type

            17.18.2.2. By Price Orientation

            17.18.2.3. By Product Category

            17.18.2.4. By Distribution Channel

    17.19. Japan

        17.19.1. Pricing Analysis

        17.19.2. Market Share Analysis, 2023

            17.19.2.1. By Product Type

            17.19.2.2. By Price Orientation

            17.19.2.3. By Product Category

            17.19.2.4. By Distribution Channel

    17.20. South Korea

        17.20.1. Pricing Analysis

        17.20.2. Market Share Analysis, 2023

            17.20.2.1. By Product Type

            17.20.2.2. By Price Orientation

            17.20.2.3. By Product Category

            17.20.2.4. By Distribution Channel

    17.21. GCC Countries

        17.21.1. Pricing Analysis

        17.21.2. Market Share Analysis, 2023

            17.21.2.1. By Product Type

            17.21.2.2. By Price Orientation

            17.21.2.3. By Product Category

            17.21.2.4. By Distribution Channel

    17.22. South Africa

        17.22.1. Pricing Analysis

        17.22.2. Market Share Analysis, 2023

            17.22.2.1. By Product Type

            17.22.2.2. By Price Orientation

            17.22.2.3. By Product Category

            17.22.2.4. By Distribution Channel

    17.23. Israel

        17.23.1. Pricing Analysis

        17.23.2. Market Share Analysis, 2023

            17.23.2.1. By Product Type

            17.23.2.2. By Price Orientation

            17.23.2.3. By Product Category

            17.23.2.4. By Distribution Channel

18. Market Structure Analysis

    18.1. Competition Dashboard

    18.2. Competition Benchmarking

    18.3. Market Share Analysis of Top Players

        18.3.1. By Regional

        18.3.2. By Product Type

        18.3.3. By Price Orientation

        18.3.4. By Product Category

        18.3.5. By Distribution Channel

19. Competition Analysis

    19.1. Competition Deep Dive

        19.1.1. PAC Cosmetics

            19.1.1.1. Overview

            19.1.1.2. Product Portfolio

            19.1.1.3. Profitability by Market Segments

            19.1.1.4. Sales Footprint

            19.1.1.5. Strategy Overview

                19.1.1.5.1. Marketing Strategy

                19.1.1.5.2. Product Strategy

                19.1.1.5.3. Channel Strategy

        19.1.2. NYX Professional Makeup

            19.1.2.1. Overview

            19.1.2.2. Product Portfolio

            19.1.2.3. Profitability by Market Segments

            19.1.2.4. Sales Footprint

            19.1.2.5. Strategy Overview

                19.1.2.5.1. Marketing Strategy

                19.1.2.5.2. Product Strategy

                19.1.2.5.3. Channel Strategy

        19.1.3. Givenchy

            19.1.3.1. Overview

            19.1.3.2. Product Portfolio

            19.1.3.3. Profitability by Market Segments

            19.1.3.4. Sales Footprint

            19.1.3.5. Strategy Overview

                19.1.3.5.1. Marketing Strategy

                19.1.3.5.2. Product Strategy

                19.1.3.5.3. Channel Strategy

        19.1.4. L'Oréal S.A.

            19.1.4.1. Overview

            19.1.4.2. Product Portfolio

            19.1.4.3. Profitability by Market Segments

            19.1.4.4. Sales Footprint

            19.1.4.5. Strategy Overview

                19.1.4.5.1. Marketing Strategy

                19.1.4.5.2. Product Strategy

                19.1.4.5.3. Channel Strategy

        19.1.5. Kroylan Professional Make-up

            19.1.5.1. Overview

            19.1.5.2. Product Portfolio

            19.1.5.3. Profitability by Market Segments

            19.1.5.4. Sales Footprint

            19.1.5.5. Strategy Overview

                19.1.5.5.1. Marketing Strategy

                19.1.5.5.2. Product Strategy

                19.1.5.5.3. Channel Strategy

        19.1.6. Lancôme

            19.1.6.1. Overview

            19.1.6.2. Product Portfolio

            19.1.6.3. Profitability by Market Segments

            19.1.6.4. Sales Footprint

            19.1.6.5. Strategy Overview

                19.1.6.5.1. Marketing Strategy

                19.1.6.5.2. Product Strategy

                19.1.6.5.3. Channel Strategy

        19.1.7. Mamaearth

            19.1.7.1. Overview

            19.1.7.2. Product Portfolio

            19.1.7.3. Profitability by Market Segments

            19.1.7.4. Sales Footprint

            19.1.7.5. Strategy Overview

                19.1.7.5.1. Marketing Strategy

                19.1.7.5.2. Product Strategy

                19.1.7.5.3. Channel Strategy

        19.1.8. TOM FORD S.A.

            19.1.8.1. Overview

            19.1.8.2. Product Portfolio

            19.1.8.3. Profitability by Market Segments

            19.1.8.4. Sales Footprint

            19.1.8.5. Strategy Overview

                19.1.8.5.1. Marketing Strategy

                19.1.8.5.2. Product Strategy

                19.1.8.5.3. Channel Strategy

        19.1.9. Revlon Group

            19.1.9.1. Overview

            19.1.9.2. Product Portfolio

            19.1.9.3. Profitability by Market Segments

            19.1.9.4. Sales Footprint

            19.1.9.5. Strategy Overview

                19.1.9.5.1. Marketing Strategy

                19.1.9.5.2. Product Strategy

                19.1.9.5.3. Channel Strategy

        19.1.10. Coty Inc.

            19.1.10.1. Overview

            19.1.10.2. Product Portfolio

            19.1.10.3. Profitability by Market Segments

            19.1.10.4. Sales Footprint

            19.1.10.5. Strategy Overview

                19.1.10.5.1. Marketing Strategy

                19.1.10.5.2. Product Strategy

                19.1.10.5.3. Channel Strategy

        19.1.11. MAYBELLINE New York

            19.1.11.1. Overview

            19.1.11.2. Product Portfolio

            19.1.11.3. Profitability by Market Segments

            19.1.11.4. Sales Footprint

            19.1.11.5. Strategy Overview

                19.1.11.5.1. Marketing Strategy

                19.1.11.5.2. Product Strategy

                19.1.11.5.3. Channel Strategy

20. Assumptions & Acronyms Used

21. Research Methodology
Recommendations

Consumer Product

Herbal Beauty Product Market

December 2021

REP-GB-567

February 2024

333 pages

Consumer Product

Tinted Cosmetics Market

December 2022

REP-GB-15883

300 pages

Explore Consumer Product Insights

View Reports