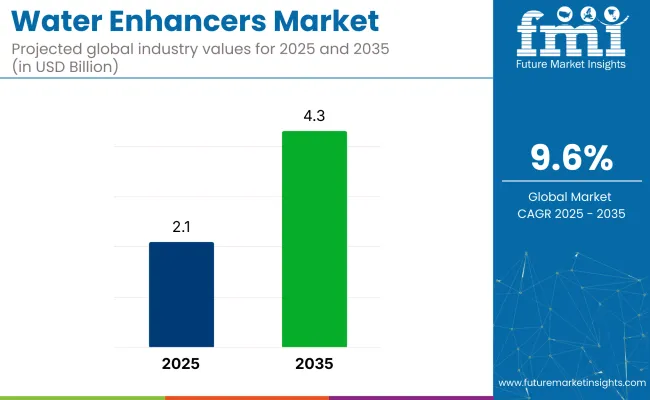
The demand for global Water Enhancers market is expected to be valued at USD 2.10 Billion in 2025, forecasted at a CAGR of 9.6% to have an estimated value of USD 4.30 Billion from 2025 to 2035. From 2020 to 2025 a CAGR of 8.5% was registered for the market.
Concentrated flavored formulations that are primarily enhanced with nutrients and useful ingredients are known as water enhancers. These are meant to be added a few drops at a time to plain water. These mixers give the water sweetness taste and nutrients. Water enhancer demand is expected to increase in the coming years due to growing awareness of the harmful health effects of drinking sugary and carbonated beverages.
Due to their growing use in a variety of market segments including energy drinks flavored water and sports drinks water enhancers are becoming a more widespread trend in retail. The rising popularity of convenient on-the-go drinks is driving up demand for water enhancers among consumers in the modern era.
The preparation required for other beverage mixes like powdered drinks and frozen concentrates is greatly reduced by enhancers. It is more convenient to carry and store water enhancer packs or bottles for extended periods of time. The market for water enhancers is growing due to advancements in packaging technologies and growing retail distribution.
Attributes | Description |
---|---|
Estimated Global Industry Size (2025E) | USD 2.10 Billion |
Projected Global Industry Value (2035F) | USD 4.30 Billion |
Value-based CAGR (2025 to 2035) | 9.6% |
The primary factor propelling the market expansion for water enhancers is the trend toward nutritious drinking and healthy hydration. Growing knowledge of the harmful effects of sugary soft drinks and carbonated beverages on one’s health is driving demand for nutrient-dense health-promoting beverages. Because they are portable water enhancers offer inexpensive on-the-go nutrition. The market expansion for water enhancers is also being driven by the rising demand for personalized beverages.
Demand for Non-Carbonated and Nutritional Drink is Driving the Market Growth
A major driver of the markets compounds annual growth rate (CAGR) is the growing demand for nutrient-dense water consumption because of its health benefits along with the growing popularity of eating a balanced diet. The enhancer makes water more nutrient-denser and palatable by adding vitamins minerals electrolytes and other beneficial ingredients.
Additionally, as people realize how important it is to lead healthy lives product adoption is rising in developed economies. Due to the variety superior taste and numerous health advantages consumers favor flavored products over non-flavored ones. Enhanced water consumers are those who lead busy lives work out hard and favor portable devices. They are easy to carry around because they come in portable packaging.
Awareness in Good Health Drives the Market Growth
The industry is expanding as a result of growing global health concerns that encourage the use of healthy beverage mix products like water enhancers. Additionally, the rising trend of athletes and celebrities consuming water that is nutrient-dense and energy-based is anticipated to present a number of growth prospects for the water enhancer market. Additionally, the introduction of functional water enhancers will support the growth of the industry.
Demand for External Nutrition Drives the Market Growth
Water enhancers fortified with vitamins and minerals are becoming more and more popular due to the growing preference for external vitamin supplements. Certain water enhancers contain prebiotic fibers like oligosaccharides, chicory root fiber, or inulin. Beneficial gut bacteria use prebiotics as fuel to increase their number and activity. Prebiotic fibers can help water enhancers maintain a healthy gut microbiome which is critical for immunological response digestion and general well-being.
During the period 2020 to 2024, the sales grew at a CAGR of 8.5%, and it is predicted to continue to grow at a CAGR of 9.6% during the forecast period of 2025 to 2035.
Water enhancer products are frequently preferred by consumers due to their portability and ease of use. By adding a small amount of the products, they can also transform ordinary drinking water into nutrient-rich water.
Customers prefer these products to hydrate themselves with fortified water because they avoid consuming processed and unhealthy beverages. They are enhanced with functional ingredients and nutrients and their use is growing all over the world. Furthermore, since they provide consumers with comparable types of supplements water enhancers take the place of functional beverages industry like energy and sports drinks.
Sports and fitness enthusiasts frequently use these products to hydrate with improved water which improves performance. Furthermore, water enhancers can be tailored to the tastes and preferences of customers which will increase their overall sales.
Tier 1 companies comprises industry leaders acquiring a 50% share in the global business market. These leaders are distinguished by their extensive product portfolio and high production capacity. These industry leaders stand out due to their broad geographic reach, in-depth knowledge of manufacturing and reconditioning across various formats and strong customer base. They offer a variety of services and manufacturing with the newest technology while adhering to legal requirements for the best quality.
Tier 2 companies comprises of mid-size players having a presence in some regions and highly influencing the local commerce and has a market share of 30%. These are distinguished by their robust global presence and solid business acumen. These industry participants may not have cutting-edge technology or a broad global reach but they do have good technology and guarantee regulatory compliance.
Tier 3 companies comprises mostly of small-scale businesses serving niche economies and serving at the local presence having a market share of 20%. Due to their notable focus on meeting local needs these businesses are categorized as belonging to the tier 3 share segment, they are minor players with a constrained geographic scope. As an unorganized ecosystem Tier 3 in this context refers to a sector that in contrast to its organized competitors, lacks extensive structure and formalization.
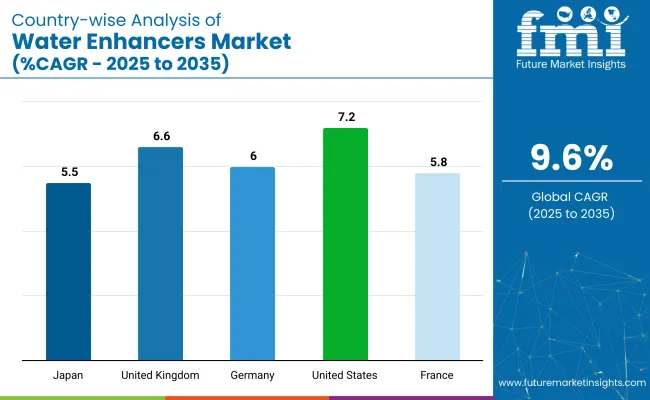
The following table shows the forecasted growth rates of the significant three geographies revenues. USA, UK and India come under the exhibit of high consumption, recording CAGRs of 7.2%, 6.6% and 5.4%, respectively, through 2035.
Countries | CAGR, 2025 to 2035 |
---|---|
United States | 7.2% |
UK | 6.6% |
India | 5.4% |
Due to daily consumption there is a high demand for water enhancers in the USA. Market growth is anticipated due to consumers growing adoption of healthy lifestyles and rising demand for nutrient-dense hydration-sustaining beverages. Additionally, the USA is expected to see a rise in demand for water enhancers due to the availability of various flavors and conveniently portable small-sized packs.
The primary market for water enhancers is millennials who rely on energy drinks and supplements to meet their nutritional needs. The need for water enhancers is predicted to increase in developing nations like India as people become more conscious of the value of maintaining good health. Some additional elements that would boost the market are product affordability and usability.
Consumer preference is predicted to shift toward low-sugar healthful beverages as obesity and diabetes rates rise in several European nations including the UK. This factor is likely to increase demand in the UK for water enhancers that contain vitamins and minerals. New product developments with varying flavors and pack sizes are also expected to have a positive impact on water enhancer sales in the UK.
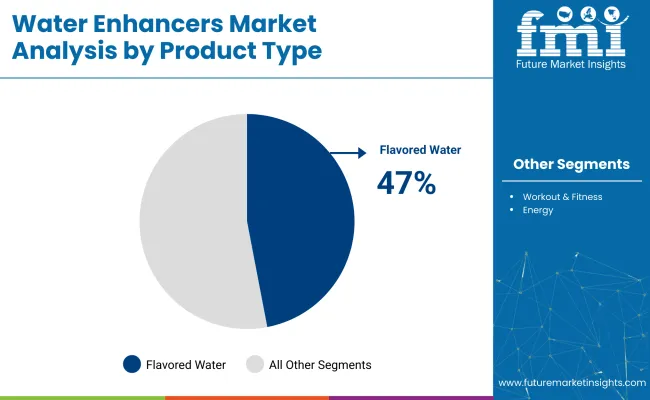
Segment | Flavored Water (Product Type) |
---|---|
Value Share (2025) | 47% |
In 2025 the flavored water enhancer segment accounted for the largest portion of the market and during the forecast period it is anticipated to grow at a profitable compound annual growth rate. Because these flavored water enhancers have a distinct and improved flavor as well as a number of health advantages consumers prefer them over others. A great alternative to a carbonated soft drink is flavored water enhancer. Increased attention to the final drinks flavor has also been linked to the commercial success of flavored water enhancers.
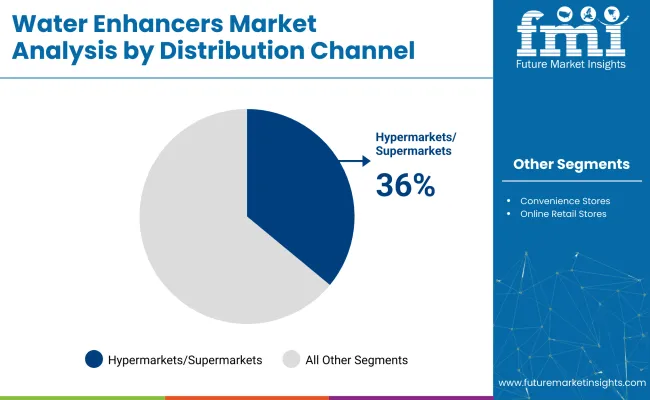
Segment | Hypermarkets/Supermarkets (Distribution Channel) |
---|---|
Value Share (2025) | 36% |
Convenience stores pharmacies online retail stores hypermarkets and supermarkets are among the distribution channels used to segment the water enhancer market. With 36% of market revenue the hypermarkets and supermarkets category led the global market. The availability and convenience of traditional offline retailers make them the preferred choice for buyers. Customers can purchase a variety of water enhancer products at affordable prices at supermarkets and hypermarkets giving them a one-stop shopping experience.
By introducing new products and purchasing businesses that enhance their product offerings major market players are trying to diversify their holdings. Additionally, major players in the global water enhancer market concentrate on digitalization and long-term product development.
To meet the increasing demand from customers around the world they introduce new flavors and product sizes. To reach more consumers major players in the water enhancer market are also expanding their distribution channels including convenience stores and internet retail platforms.
By product type, methods industry has been categorized into Workout & Fitness, Energy and Flavored
By distribution channel industry has been categorized into Pharmacies/Drug Stores, Convenience Store, Hypermarket/Supermarket and Online Retail Stores
Industry analysis has been carried out in key countries of North America; Europe, Middle East, Africa, ASEAN, South Asia, Asia, New Zealand and Australia
Table 1: Global Market Value (US$ Billion) Forecast by Region, 2017 to 2032
Table 2: Global Market Volume (MN. SQ. M.) Forecast by Region, 2017 to 2032
Table 3: Global Market Value (US$ Billion) Forecast by Active Ingredients, 2017 to 2032
Table 4: Global Market Volume (MN. SQ. M.) Forecast by Active Ingredients, 2017 to 2032
Table 5: Global Market Value (US$ Billion) Forecast by Sales Channel, 2017 to 2032
Table 6: Global Market Volume (MN. SQ. M.) Forecast by Sales Channel, 2017 to 2032
Table 7: North America Market Value (US$ Billion) Forecast by Country, 2017 to 2032
Table 8: North America Market Volume (MN. SQ. M.) Forecast by Country, 2017 to 2032
Table 9: North America Market Value (US$ Billion) Forecast by Active Ingredients, 2017 to 2032
Table 10: North America Market Volume (MN. SQ. M.) Forecast by Active Ingredients, 2017 to 2032
Table 11: North America Market Value (US$ Billion) Forecast by Sales Channel, 2017 to 2032
Table 12: North America Market Volume (MN. SQ. M.) Forecast by Sales Channel, 2017 to 2032
Table 13: Latin America Market Value (US$ Billion) Forecast by Country, 2017 to 2032
Table 14: Latin America Market Volume (MN. SQ. M.) Forecast by Country, 2017 to 2032
Table 15: Latin America Market Value (US$ Billion) Forecast by Active Ingredients, 2017 to 2032
Table 16: Latin America Market Volume (MN. SQ. M.) Forecast by Active Ingredients, 2017 to 2032
Table 17: Latin America Market Value (US$ Billion) Forecast by Sales Channel, 2017 to 2032
Table 18: Latin America Market Volume (MN. SQ. M.) Forecast by Sales Channel, 2017 to 2032
Table 19: Europe Market Value (US$ Billion) Forecast by Country, 2017 to 2032
Table 20: Europe Market Volume (MN. SQ. M.) Forecast by Country, 2017 to 2032
Table 21: Europe Market Value (US$ Billion) Forecast by Active Ingredients, 2017 to 2032
Table 22: Europe Market Volume (MN. SQ. M.) Forecast by Active Ingredients, 2017 to 2032
Table 23: Europe Market Value (US$ Billion) Forecast by Sales Channel, 2017 to 2032
Table 24: Europe Market Volume (MN. SQ. M.) Forecast by Sales Channel, 2017 to 2032
Table 25: East Asia Market Value (US$ Billion) Forecast by Country, 2017 to 2032
Table 26: East Asia Market Volume (MN. SQ. M.) Forecast by Country, 2017 to 2032
Table 27: East Asia Market Value (US$ Billion) Forecast by Active Ingredients, 2017 to 2032
Table 28: East Asia Market Volume (MN. SQ. M.) Forecast by Active Ingredients, 2017 to 2032
Table 29: East Asia Market Value (US$ Billion) Forecast by Sales Channel, 2017 to 2032
Table 30: East Asia Market Volume (MN. SQ. M.) Forecast by Sales Channel, 2017 to 2032
Table 31: South Asia Market Value (US$ Billion) Forecast by Country, 2017 to 2032
Table 32: South Asia Market Volume (MN. SQ. M.) Forecast by Country, 2017 to 2032
Table 33: South Asia Market Value (US$ Billion) Forecast by Active Ingredients, 2017 to 2032
Table 34: South Asia Market Volume (MN. SQ. M.) Forecast by Active Ingredients, 2017 to 2032
Table 35: South Asia Market Value (US$ Billion) Forecast by Sales Channel, 2017 to 2032
Table 36: South Asia Market Volume (MN. SQ. M.) Forecast by Sales Channel, 2017 to 2032
Table 37: Oceania Market Value (US$ Billion) Forecast by Country, 2017 to 2032
Table 38: Oceania Market Volume (MN. SQ. M.) Forecast by Country, 2017 to 2032
Table 39: Oceania Market Value (US$ Billion) Forecast by Active Ingredients, 2017 to 2032
Table 40: Oceania Market Volume (MN. SQ. M.) Forecast by Active Ingredients, 2017 to 2032
Table 41: Oceania Market Value (US$ Billion) Forecast by Sales Channel, 2017 to 2032
Table 42: Oceania Market Volume (MN. SQ. M.) Forecast by Sales Channel, 2017 to 2032
Table 43: Middle East and Africa Market Value (US$ Billion) Forecast by Country, 2017 to 2032
Table 44: Middle East and Africa Market Volume (MN. SQ. M.) Forecast by Country, 2017 to 2032
Table 45: Middle East and Africa Market Value (US$ Billion) Forecast by Active Ingredients, 2017 to 2032
Table 46: Middle East and Africa Market Volume (MN. SQ. M.) Forecast by Active Ingredients, 2017 to 2032
Table 47: Middle East and Africa Market Value (US$ Billion) Forecast by Sales Channel, 2017 to 2032
Table 48: Middle East and Africa Market Volume (MN. SQ. M.) Forecast by Sales Channel, 2017 to 2032
Figure 1: Global Market Value (US$ Billion) by Active Ingredients, 2022 to 2032
Figure 2: Global Market Value (US$ Billion) by Sales Channel, 2022 to 2032
Figure 3: Global Market Value (US$ Billion) by Region, 2022 to 2032
Figure 4: Global Market Value (US$ Billion) Analysis by Region, 2017 to 2032
Figure 5: Global Market Volume (MN. SQ. M.) Analysis by Region, 2017 to 2032
Figure 6: Global Market Value Share (%) and BPS Analysis by Region, 2022 to 2032
Figure 7: Global Market Y-o-Y Growth (%) Projections by Region, 2022 to 2032
Figure 8: Global Market Value (US$ Billion) Analysis by Active Ingredients, 2017 to 2032
Figure 9: Global Market Volume (MN. SQ. M.) Analysis by Active Ingredients, 2017 to 2032
Figure 10: Global Market Value Share (%) and BPS Analysis by Active Ingredients, 2022 to 2032
Figure 11: Global Market Y-o-Y Growth (%) Projections by Active Ingredients, 2022 to 2032
Figure 12: Global Market Value (US$ Billion) Analysis by Sales Channel, 2017 to 2032
Figure 13: Global Market Volume (MN. SQ. M.) Analysis by Sales Channel, 2017 to 2032
Figure 14: Global Market Value Share (%) and BPS Analysis by Sales Channel, 2022 to 2032
Figure 15: Global Market Y-o-Y Growth (%) Projections by Sales Channel, 2022 to 2032
Figure 16: Global Market Attractiveness by Active Ingredients, 2022 to 2032
Figure 17: Global Market Attractiveness by Sales Channel, 2022 to 2032
Figure 18: Global Market Attractiveness by Region, 2022 to 2032
Figure 19: North America Market Value (US$ Billion) by Active Ingredients, 2022 to 2032
Figure 20: North America Market Value (US$ Billion) by Sales Channel, 2022 to 2032
Figure 21: North America Market Value (US$ Billion) by Country, 2022 to 2032
Figure 22: North America Market Value (US$ Billion) Analysis by Country, 2017 to 2032
Figure 23: North America Market Volume (MN. SQ. M.) Analysis by Country, 2017 to 2032
Figure 24: North America Market Value Share (%) and BPS Analysis by Country, 2022 to 2032
Figure 25: North America Market Y-o-Y Growth (%) Projections by Country, 2022 to 2032
Figure 26: North America Market Value (US$ Billion) Analysis by Active Ingredients, 2017 to 2032
Figure 27: North America Market Volume (MN. SQ. M.) Analysis by Active Ingredients, 2017 to 2032
Figure 28: North America Market Value Share (%) and BPS Analysis by Active Ingredients, 2022 to 2032
Figure 29: North America Market Y-o-Y Growth (%) Projections by Active Ingredients, 2022 to 2032
Figure 30: North America Market Value (US$ Billion) Analysis by Sales Channel, 2017 to 2032
Figure 31: North America Market Volume (MN. SQ. M.) Analysis by Sales Channel, 2017 to 2032
Figure 32: North America Market Value Share (%) and BPS Analysis by Sales Channel, 2022 to 2032
Figure 33: North America Market Y-o-Y Growth (%) Projections by Sales Channel, 2022 to 2032
Figure 34: North America Market Attractiveness by Active Ingredients, 2022 to 2032
Figure 35: North America Market Attractiveness by Sales Channel, 2022 to 2032
Figure 36: North America Market Attractiveness by Country, 2022 to 2032
Figure 37: Latin America Market Value (US$ Billion) by Active Ingredients, 2022 to 2032
Figure 38: Latin America Market Value (US$ Billion) by Sales Channel, 2022 to 2032
Figure 39: Latin America Market Value (US$ Billion) by Country, 2022 to 2032
Figure 40: Latin America Market Value (US$ Billion) Analysis by Country, 2017 to 2032
Figure 41: Latin America Market Volume (MN. SQ. M.) Analysis by Country, 2017 to 2032
Figure 42: Latin America Market Value Share (%) and BPS Analysis by Country, 2022 to 2032
Figure 43: Latin America Market Y-o-Y Growth (%) Projections by Country, 2022 to 2032
Figure 44: Latin America Market Value (US$ Billion) Analysis by Active Ingredients, 2017 to 2032
Figure 45: Latin America Market Volume (MN. SQ. M.) Analysis by Active Ingredients, 2017 to 2032
Figure 46: Latin America Market Value Share (%) and BPS Analysis by Active Ingredients, 2022 to 2032
Figure 47: Latin America Market Y-o-Y Growth (%) Projections by Active Ingredients, 2022 to 2032
Figure 48: Latin America Market Value (US$ Billion) Analysis by Sales Channel, 2017 to 2032
Figure 49: Latin America Market Volume (MN. SQ. M.) Analysis by Sales Channel, 2017 to 2032
Figure 50: Latin America Market Value Share (%) and BPS Analysis by Sales Channel, 2022 to 2032
Figure 51: Latin America Market Y-o-Y Growth (%) Projections by Sales Channel, 2022 to 2032
Figure 52: Latin America Market Attractiveness by Active Ingredients, 2022 to 2032
Figure 53: Latin America Market Attractiveness by Sales Channel, 2022 to 2032
Figure 54: Latin America Market Attractiveness by Country, 2022 to 2032
Figure 55: Europe Market Value (US$ Billion) by Active Ingredients, 2022 to 2032
Figure 56: Europe Market Value (US$ Billion) by Sales Channel, 2022 to 2032
Figure 57: Europe Market Value (US$ Billion) by Country, 2022 to 2032
Figure 58: Europe Market Value (US$ Billion) Analysis by Country, 2017 to 2032
Figure 59: Europe Market Volume (MN. SQ. M.) Analysis by Country, 2017 to 2032
Figure 60: Europe Market Value Share (%) and BPS Analysis by Country, 2022 to 2032
Figure 61: Europe Market Y-o-Y Growth (%) Projections by Country, 2022 to 2032
Figure 62: Europe Market Value (US$ Billion) Analysis by Active Ingredients, 2017 to 2032
Figure 63: Europe Market Volume (MN. SQ. M.) Analysis by Active Ingredients, 2017 to 2032
Figure 64: Europe Market Value Share (%) and BPS Analysis by Active Ingredients, 2022 to 2032
Figure 65: Europe Market Y-o-Y Growth (%) Projections by Active Ingredients, 2022 to 2032
Figure 66: Europe Market Value (US$ Billion) Analysis by Sales Channel, 2017 to 2032
Figure 67: Europe Market Volume (MN. SQ. M.) Analysis by Sales Channel, 2017 to 2032
Figure 68: Europe Market Value Share (%) and BPS Analysis by Sales Channel, 2022 to 2032
Figure 69: Europe Market Y-o-Y Growth (%) Projections by Sales Channel, 2022 to 2032
Figure 70: Europe Market Attractiveness by Active Ingredients, 2022 to 2032
Figure 71: Europe Market Attractiveness by Sales Channel, 2022 to 2032
Figure 72: Europe Market Attractiveness by Country, 2022 to 2032
Figure 73: East Asia Market Value (US$ Billion) by Active Ingredients, 2022 to 2032
Figure 74: East Asia Market Value (US$ Billion) by Sales Channel, 2022 to 2032
Figure 75: East Asia Market Value (US$ Billion) by Country, 2022 to 2032
Figure 76: East Asia Market Value (US$ Billion) Analysis by Country, 2017 to 2032
Figure 77: East Asia Market Volume (MN. SQ. M.) Analysis by Country, 2017 to 2032
Figure 78: East Asia Market Value Share (%) and BPS Analysis by Country, 2022 to 2032
Figure 79: East Asia Market Y-o-Y Growth (%) Projections by Country, 2022 to 2032
Figure 80: East Asia Market Value (US$ Billion) Analysis by Active Ingredients, 2017 to 2032
Figure 81: East Asia Market Volume (MN. SQ. M.) Analysis by Active Ingredients, 2017 to 2032
Figure 82: East Asia Market Value Share (%) and BPS Analysis by Active Ingredients, 2022 to 2032
Figure 83: East Asia Market Y-o-Y Growth (%) Projections by Active Ingredients, 2022 to 2032
Figure 84: East Asia Market Value (US$ Billion) Analysis by Sales Channel, 2017 to 2032
Figure 85: East Asia Market Volume (MN. SQ. M.) Analysis by Sales Channel, 2017 to 2032
Figure 86: East Asia Market Value Share (%) and BPS Analysis by Sales Channel, 2022 to 2032
Figure 87: East Asia Market Y-o-Y Growth (%) Projections by Sales Channel, 2022 to 2032
Figure 88: East Asia Market Attractiveness by Active Ingredients, 2022 to 2032
Figure 89: East Asia Market Attractiveness by Sales Channel, 2022 to 2032
Figure 90: East Asia Market Attractiveness by Country, 2022 to 2032
Figure 91: South Asia Market Value (US$ Billion) by Active Ingredients, 2022 to 2032
Figure 92: South Asia Market Value (US$ Billion) by Sales Channel, 2022 to 2032
Figure 93: South Asia Market Value (US$ Billion) by Country, 2022 to 2032
Figure 94: South Asia Market Value (US$ Billion) Analysis by Country, 2017 to 2032
Figure 95: South Asia Market Volume (MN. SQ. M.) Analysis by Country, 2017 to 2032
Figure 96: South Asia Market Value Share (%) and BPS Analysis by Country, 2022 to 2032
Figure 97: South Asia Market Y-o-Y Growth (%) Projections by Country, 2022 to 2032
Figure 98: South Asia Market Value (US$ Billion) Analysis by Active Ingredients, 2017 to 2032
Figure 99: South Asia Market Volume (MN. SQ. M.) Analysis by Active Ingredients, 2017 to 2032
Figure 100: South Asia Market Value Share (%) and BPS Analysis by Active Ingredients, 2022 to 2032
Figure 101: South Asia Market Y-o-Y Growth (%) Projections by Active Ingredients, 2022 to 2032
Figure 102: South Asia Market Value (US$ Billion) Analysis by Sales Channel, 2017 to 2032
Figure 103: South Asia Market Volume (MN. SQ. M.) Analysis by Sales Channel, 2017 to 2032
Figure 104: South Asia Market Value Share (%) and BPS Analysis by Sales Channel, 2022 to 2032
Figure 105: South Asia Market Y-o-Y Growth (%) Projections by Sales Channel, 2022 to 2032
Figure 106: South Asia Market Attractiveness by Active Ingredients, 2022 to 2032
Figure 107: South Asia Market Attractiveness by Sales Channel, 2022 to 2032
Figure 108: South Asia Market Attractiveness by Country, 2022 to 2032
Figure 109: Oceania Market Value (US$ Billion) by Active Ingredients, 2022 to 2032
Figure 110: Oceania Market Value (US$ Billion) by Sales Channel, 2022 to 2032
Figure 111: Oceania Market Value (US$ Billion) by Country, 2022 to 2032
Figure 112: Oceania Market Value (US$ Billion) Analysis by Country, 2017 to 2032
Figure 113: Oceania Market Volume (MN. SQ. M.) Analysis by Country, 2017 to 2032
Figure 114: Oceania Market Value Share (%) and BPS Analysis by Country, 2022 to 2032
Figure 115: Oceania Market Y-o-Y Growth (%) Projections by Country, 2022 to 2032
Figure 116: Oceania Market Value (US$ Billion) Analysis by Active Ingredients, 2017 to 2032
Figure 117: Oceania Market Volume (MN. SQ. M.) Analysis by Active Ingredients, 2017 to 2032
Figure 118: Oceania Market Value Share (%) and BPS Analysis by Active Ingredients, 2022 to 2032
Figure 119: Oceania Market Y-o-Y Growth (%) Projections by Active Ingredients, 2022 to 2032
Figure 120: Oceania Market Value (US$ Billion) Analysis by Sales Channel, 2017 to 2032
Figure 121: Oceania Market Volume (MN. SQ. M.) Analysis by Sales Channel, 2017 to 2032
Figure 122: Oceania Market Value Share (%) and BPS Analysis by Sales Channel, 2022 to 2032
Figure 123: Oceania Market Y-o-Y Growth (%) Projections by Sales Channel, 2022 to 2032
Figure 124: Oceania Market Attractiveness by Active Ingredients, 2022 to 2032
Figure 125: Oceania Market Attractiveness by Sales Channel, 2022 to 2032
Figure 126: Oceania Market Attractiveness by Country, 2022 to 2032
Figure 127: Middle East and Africa Market Value (US$ Billion) by Active Ingredients, 2022 to 2032
Figure 128: Middle East and Africa Market Value (US$ Billion) by Sales Channel, 2022 to 2032
Figure 129: Middle East and Africa Market Value (US$ Billion) by Country, 2022 to 2032
Figure 130: Middle East and Africa Market Value (US$ Billion) Analysis by Country, 2017 to 2032
Figure 131: Middle East and Africa Market Volume (MN. SQ. M.) Analysis by Country, 2017 to 2032
Figure 132: Middle East and Africa Market Value Share (%) and BPS Analysis by Country, 2022 to 2032
Figure 133: Middle East and Africa Market Y-o-Y Growth (%) Projections by Country, 2022 to 2032
Figure 134: Middle East and Africa Market Value (US$ Billion) Analysis by Active Ingredients, 2017 to 2032
Figure 135: Middle East and Africa Market Volume (MN. SQ. M.) Analysis by Active Ingredients, 2017 to 2032
Figure 136: Middle East and Africa Market Value Share (%) and BPS Analysis by Active Ingredients, 2022 to 2032
Figure 137: Middle East and Africa Market Y-o-Y Growth (%) Projections by Active Ingredients, 2022 to 2032
Figure 138: Middle East and Africa Market Value (US$ Billion) Analysis by Sales Channel, 2017 to 2032
Figure 139: Middle East and Africa Market Volume (MN. SQ. M.) Analysis by Sales Channel, 2017 to 2032
Figure 140: Middle East and Africa Market Value Share (%) and BPS Analysis by Sales Channel, 2022 to 2032
Figure 141: Middle East and Africa Market Y-o-Y Growth (%) Projections by Sales Channel, 2022 to 2032
Figure 142: Middle East and Africa Market Attractiveness by Active Ingredients, 2022 to 2032
Figure 143: Middle East and Africa Market Attractiveness by Sales Channel, 2022 to 2032
Figure 144: Middle East and Africa Market Attractiveness by Country, 2022 to 2032
The market is expected to grow at a CAGR of 9.6% throughout the forecast period.
By 2035, the sales value is expected to be worth USD 4.30 Billion.
Rise in health awareness is increasing demand for Water Enhancers.
North America is expected to dominate the global consumption.
Some of the key players in manufacturing include Jelsert, Dyla LLC, Pharmavite LLC and more.
Explore Functional Beverages Insights
Thank you!
You will receive an email from our Business Development Manager. Please be sure to check your SPAM/JUNK folder too.