Water Softening Systems Market Snapshot (2023 to 2033)

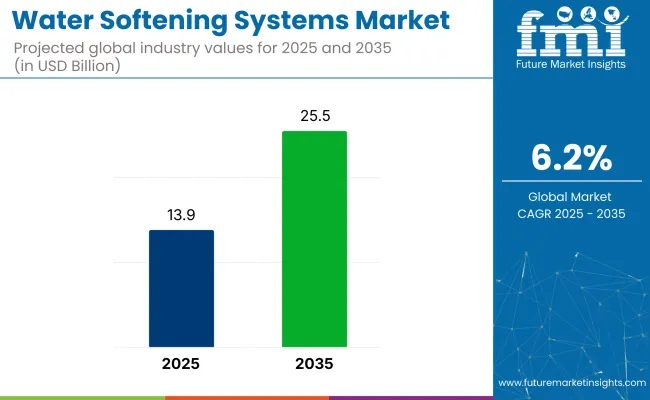
The global water softening systems market is anticipated at US$ 11.6 billion in 2022. Demand is likely to remain high for water softening systems during the assessment period. This is due to the increased technological advances and industrialization globally and garnering US$ 23.3 billion in 2033, recording a CAGR of 6.6% from 2023 to 2033. The market is likely to secure US$ 12.3 billion in 2023.

Data Points Key Statistics
Water Softening Systems Market Size Value in 2023 US$12.3 billion
Water Softening Systems Market Forecast Value in 2033 US$ 23.3 billion
Global Growth Rate 6.6% CAGR
Forecast Period 2023 to 2033

Don't pay for what you don't need

Customize your report by selecting specific countries or regions and save 30%!

Water Softening Systems Market Revenue Analysis from 2018 to 2022 Vs Market Outlook for 2023 to 2033

Historical CAGR (2018 to 2022) 4.6%
Forecasted CAGR (2023 to 2033) 6.6%

As per FMI’s analysis, demand for ultra-soft water softening systems visibly grew due to soaring concerns pertaining to water contamination across the globe. However, amid the COVID-19 outbreak, sales reduced to an extent, especially on account of restrictions imposed on movement, which halted product installation in various residential, commercial, and industrial spaces.

Growth is on the cards, with sales of salt-free water softening systems and an increasing shift towards electrification and automation of industrial filtration systems and water treatment equipment, emerging as key trends in the market.

Government initiatives in collaboration with water supply management authorities that are aimed to establish a reliable supply chain will foster sales in the water softening systems market. FMI forecasts water softening systems sales to grow at a 6.6% CAGR between 2023 and 2033, as against growth at 4.6% registered between 2018 and 2022.

What are the Key Factors that Drive the Water Softening Systems Market?

Increasing Installation of Water Softening Systems in Healthcare and Industrial Sector Set to Spur Demand

Water softening systems Market sales uptick is on the card owing implementation of government-sponsored initiatives such as the expansion of smart cities and clean water initiatives. Focus on the prevention of water contamination and ensuring the availability of clean, soft water for all will remain a chief growth driver.

Geographically, the United States, Canada, and the United Kingdom are considered to be key areas where water-related concerns are on the rise, which is encouraging market players to launch innovative and efficient water-softening systems to curb the problem.

The growth in application in healthcare, pharmaceuticals, food & beverage, and semiconductor industries is also driving demand for water-softening systems. Other countries such as India, China, and South Korea, which are witnessing growth in commercial and industrial sectors amid rapid urbanization, will emerge as attractive pockets for sale. Government-funded projects for public health, sanitization, and cleanliness are creating demand for water-softening systems, thereby propelling sales.

Efforts in Water Quality Education Impact Water Softening Systems Market Sales

Quality of water is interwoven with quality of life across the globe. Changes in quantity, quality, and natural cycles of water systems have consequential impacts on human life. As the population continues to grow, water contamination is becoming a global burden, stunting the global supply of clean water.

Human health suffers from direct impacts of contaminants in water such as chemical, biological (bacteria, viruses, protozoa, slime molds), radiological (decaying radioactive elements in soil and bedrock, seeping into water streams), and thermal (climatic changes such as excessive heat).

In terms of indirect impacts, water quality significantly affects the quality of food humans derive from ecosystems. For instance, the lack of clean water for irrigation may subsequently curtail food production in many regions. Seafood supply also depends on freshwater quality and contamination in fisheries and natural sources leads to a risk of extinction of certain species.

Improved water source provides direct access to water free of contamination and pollutants, which is becoming a need of the hour. Globally, the most prevalent water contamination-related problem is eutrophication, and access to phosphorous and nitrogen in water due to surface runoff, which is highlighting the need for water softening systems significantly.

Animal/livestock wastes and agricultural fertilizers are the main contributors to eutrophication, leading to the dense growth of plant life, creating chances for bacteria build-up, and depletion of wildlife due to lack of oxygen. Eutrophication also leads to algal bloom, resulting in fish kills, inedible shellfish, and blue algae, subsequently compromising the use of water for drinking, cleaning, and harvesting.

Yearly water quality checks are gaining more importance as the quality of water changes over time and water treatment systems installed several years ago might not be fit for the current situation. This will also create attractive opportunities for water-softening systems sales growth.

Water softening systems are often installed in households to effectively remove hard minerals such as calcium and magnesium. But in some households, high iron content is reported to be a big problem, especially in rural areas. As the quality of water differs based on location, innovations in water softening systems are essential to tackle such issues and get the desired results.

Nikhil Kaitwade
Nikhil Kaitwade

Principal Consultant

Talk to Analyst

Find your sweet spots for generating winning opportunities in this market.

What are the Restraints of the Water Softening System Market?

Low-Penetration of Water Softening Systems in Rural Areas Hampering Sales

In rural areas, consumers are comparatively less aware of the importance of water softener systems, purification, and filtering systems, which is a key factor restraining growth.

Rural consumers prefer purifying water via conventional processes such as boiling, cloth straining, chlorinating, slow sand filtration, and ceramic filters, which in turn reduces rural spending on water softening systems as compared to urban spending.

A significant rise in demand for water softening systems is being witnessed in emerging economies, owing to urbanization and water quality education, which are creating lucrative opportunities for global Water Softening Systems Market players.

Developing nations such as China, South Korea, Brazil, and India are investing heavily in water softening systems, thanks to cohesive efforts by organizations such as WHO and UNESCO that are trying to make clean water available in various developing locations.

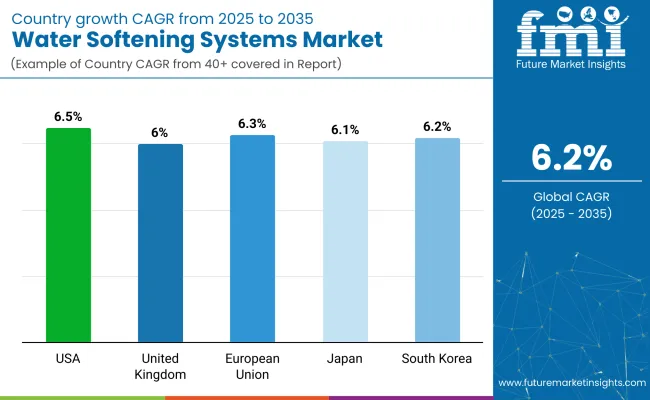
Country-wise Insights

Will the United States Maintain Lead in Water Softening Systems Market?

Increasing Technological Innovation to Drive the Market Growth in the United States

The United States proudly owns one of the safest water supply channels in the world. As per the Centres for Disease Control and prevention (CDC), 90% of Americans consume tap water supplied from community water systems, which is treated according to safe drinking water standards.

The drinking water quality varies based on location, depending upon the conditions of the water source and the treatment it receives, which must comply with the United States Environmental Protection Agency (EPA) standards and regulations. Many states have their own drinking water standards, and community water systems abide by rules set by the Safe Drinking Water Act (SDWA).

Even with the safest water supply channels, water contamination can still occur due to sewage releases, naturally occurring chemicals and minerals, land-use practices, manufacturing processes, and malfunctioning wastewater treatment systems. Such factors are pushing the need for water-softening system installations in the United States.

With increasing risks of contamination in drinking water that are mainly caused by improperly maintained distribution pipes in the country, consumers are getting more conscious regarding water softening systems and their ability to remove untreated chemicals in the water as it reaches their homes, propelling sales in the water softening systems market.

Health-related threats posed by contaminants present in drinking water are encouraging manufacturers to focus on product innovations and technological developments to keep disorders like gastrointestinal illness and neurological disorders at bay.

What is Causing Water Softening Systems Sales Uptick in the United Kingdom?

Strict Water Treatment Laws are Expected to Drive the Market Growth

Owing to stringent regulations implemented to maintain water quality standards in the United Kingdom, the sales outlook for water softening systems will showcase an upward trend during the assessment period. Even with the presence of high-quality water supply sources, residents in the United Kingdom are investing in a water-softening system to avoid any risk of contamination.

To comply with the regulations, water bodies need to meet a large number of standards related to pollutant concentration, the health of the sea population, and groundwater quality. These regulations are becoming the main areas of focus for market players, which is leading to enhanced product developments in water softening systems, thus driving sales in the market.

In the United Kingdom., tap water holds significant quantities of limescale, which damages water pipelines by getting deposited in taps and drains, leading to bacteria build-up which later contaminates freshwater as well as wastewater.

Leading players in the United Kingdom including Harvey Water Softeners Ltd. are rolling out highly effective products to curb this problem. For instance, Harvey Water Softener's product line includes HarveyArc, HVX, and Big Blue. These variants are suitable for different house sizes respectively and are equipped with advanced twin-cylinder systems that soften water round the clock.

How the Sales of Water Softening Systems Gain Traction in India?

Increasing Industrialization to Boost Market Sales in India

FMI's analysis projects a positive growth outlook for the water softening systems market in India, owing to rapid urbanization, industrialization, and population expansion in the country. With these developments, environmental problems such as water pollution have also become a growing concern.

Rising industrial and agricultural activities have deteriorated the quality and quantity of surface and groundwater in the country, thereby impairing the availability of safe and clean drinking water.

Various government and non-government organizations in India are striving to educate the masses about water quality and ensure an adequate supply of drinking water in remote locations. However, conscious efforts are hampered by lacking environmental sanitation, which has generated a tremendous need for avenues that fill the gap in the existing support structure.

To eliminate water contamination in households and commercial sectors, communities are largely investing in water purification and softening systems across schools, hospitals, corporate spaces, and community centers, thus propelling the Water Softening Systems Market growth.

Get the data you need at a Fraction of the cost

Personalize your report by choosing insights you need
and save 40%!

Category-wise Insights

Based on Application, Which Segment Accounts for the Highest Revenue in the Water Softening System Market?

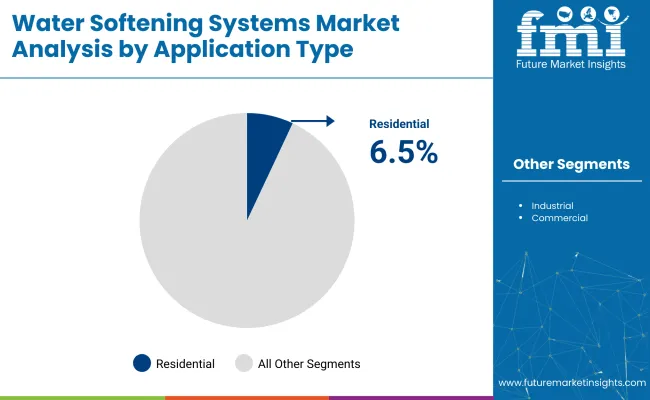
The Residential Sector Will Lead Water Softening Systems Applications

Owing to growing concerns regarding excessive mineral volumes in drinking water, the residential sector is anticipated to experience ascending applications of water softening systems throughout the assessment period. The segment is projected to account for a CAGR of 6.5% during the forecast period.

The prevalence of point-of-use (POU) water purifiers is acting as a challenge for water softening systems in the residential sector. However, gradually shifting concerns towards the importance of water softening systems will propel sales in the market.

Product innovations by leading players, with respect to sizes of houses and system designs (mono pipe, multi-tube, and twin-tube) depending on water hardness will allow consumers to purchase water softening systems as per their needs, adding to the convenience of buying and installation.

What is the Preferred Design for Water Softening Systems?

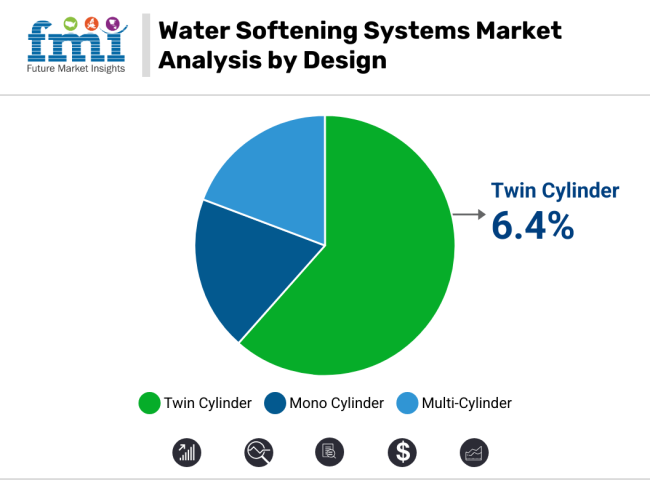
Twin-Cylinder Segment Accounts for Highest Market Share

Twin-cylinder water softening systems are being preferred widely over mono-cylinder water softeners, owing to their durability and efficacy. Mono-cylinder water softeners fail to function in high water hardness concentrations, while twin-cylinder systems deliver the required results effectively, gaining traction in developed regional markets. The segment is projected to account for a CAGR of 6.4% during the forecast period.

Which is the Top Selling Water Softening System Operation Type?

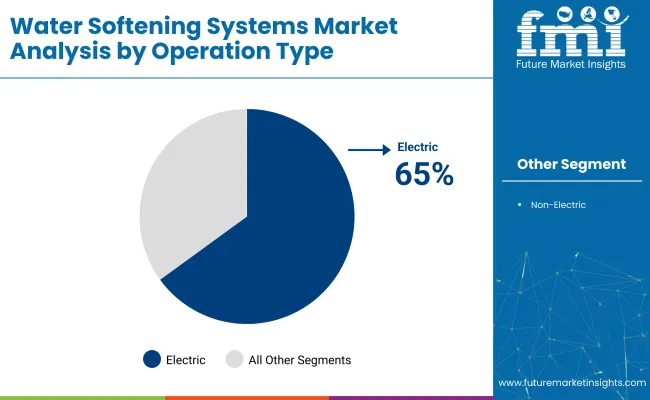
Electric Segment to Remain Prominent

Based on operations, water softening systems are either electric or non-electric. Over time the demand for better efficiency and improved operations is giving tailwinds to electric water softening systems sales.

FMI has projected the demand outlook in the United States, United Kingdom, and Canada to remain optimistic through the assessment period. On the flip side, sales of non-electric systems will continue rising as well especially as installation gains momentum across markets with unmet needs.

Competitive Landscape

As per FMI’s analysis, the global water softening systems market is dynamic in nature, with significant developments among leading players with regards to product innovations to improve the efficacy of water softening systems.

Companies operating in the market are focusing on educating the masses about water quality in order to promote sales and community well-being. Additionally, product innovations, strategic collaborations, and manufacturing facility expansions are among other strategies employed by manufacturers.

For instance:

  • In March 2021, Kinetico Incorporated, a leader in quality water systems, collaborated with Mike Holmes, a well-known professional builder, contractor, and television host to spread awareness regarding the importance and need for safer, better water in homes and commercial spaces.
  • In May 2021, Culligan International supported National Drinking Water Month to educate consumers about their products and how water quality plays a critical role in health and well-being.

Report Scope

Report Attribute Details
Growth Rate CAGR of 6.6% from 2023 to2033
Market Value in 2023 US$ billion
Market Value in 2033 US$ billion
Base Year for Estimation 2022
Historical Data 2018 to 2022
Forecast Period 2023 to 2033
Quantitative Units Revenue in US$ Billion and CAGR from 2023 to 2033
Report Coverage Revenue Forecast, Company Ranking, Competitive Landscape, Growth Factors, Trends, and Pricing Analysis
Segments Covered
  • Operation Type
  • Application Type
  • Design
  • Region
Regions Covered
  • North America
  • Latin America
  • Western Europe
  • Eastern Europe
  • South Asia and Pacific
  • East Asia
  • Middle East & Africa
Key Countries Profiled
  • United States
  • Canada
  • Brazil
  • Mexico
  • Germany
  • United Kingdom
  • France
  • Spain
  • Italy
  • Poland
  • Russia
  • Czech Republic
  • Romania
  • India
  • Bangladesh
  • Australia
  • New Zealand
  • China
  • Japan
  • South Korea
  • GCC Countries
  • South Africa
  • Israel
  • Rest of MEA
Key Companies Profiled
  • EcoWater Systems LLC
  • Culligan International Company
  • Kinetico Incorporated
  • Hydroflux
  • Envicare Technologies Pvt. Ltd.
  • Wychwood Water Systems Ltd.
  • Harvey Water Softeners Ltd.
  • Pelican Water Systems
  • BWT AG
  • Marlo Incorporated
  • Monarch Water Ltd.
  • Qingdao Haier Co., Ltd
  • Atlas Filtri
  • Watts Water Technologies Inc.
  • Feedwater Limited
Customization & Pricing Available upon Request

Water Softening Systems Market by Category

By Operation Type:

  • Electric
  • Non-Electric

By Application Type:

  • Residential
    • Salt-based
    • Salt-free
  • Industrial
  • Commercial

By Design:

  • Mono Cylinder
  • Twin Cylinder
  • Multi-Cylinder

By Region:

  • North America
  • Latin America
  • Western Europe
  • Eastern Europe
  • South Asia and Pacific
  • East Asia
  • Middle East & Africa

Frequently Asked Questions

How is the Forecasted Growth Trajectory for the Global Water Softening Systems Market?

The global sales of water softening systems is forecasted to rise at 6.6% CAGR through 2033.

What will be the Total Valuation of the Global Water Softening Systems Market by 2033?

The total valuation of the global market is expected to close up at US$ 23.3 billion by 2033.

Which is the Prominent Application Segment in the Global Water Softening Systems Market?

The residential sector consumes more and is projected to grow at 6.5% per year till 2033.

What is the Growth Outlook for the Twin-cylinder Water Softening Systems Market Segment?

Growing demand for such systems in hard water regions might drive this segment at 6.4% CAGR through 2033.

Which Region holds Higher Growth Potential for the Sales of Water Softening Systems?

Accelerating industrialization is poised to propel the market in India rapidly.

Table of Content
1. Executive Summary
    1.1. Global Market Outlook
    1.2. Demand-side Trends
    1.3. Supply-side Trends
    1.4. Technology Roadmap Analysis
    1.5. Analysis and Recommendations
2. Market Overview
    2.1. Market Coverage / Taxonomy
    2.2. Market Definition / Scope / Limitations
3. Market Background
    3.1. Market Dynamics
        3.1.1. Drivers
        3.1.2. Restraints
        3.1.3. Opportunity
        3.1.4. Trends
    3.2. Scenario Forecast
        3.2.1. Demand in Optimistic Scenario
        3.2.2. Demand in Likely Scenario
        3.2.3. Demand in Conservative Scenario
    3.3. Opportunity Map Analysis
    3.4. Product Life Cycle Analysis
    3.5. Supply Chain Analysis
        3.5.1. Supply Side Participants and their Roles
            3.5.1.1. Producers
            3.5.1.2. Mid-Level Participants (Traders/ Agents/ Brokers)
            3.5.1.3. Wholesalers and Distributors
        3.5.2. Value Added and Value Created at Node in the Supply Chain
        3.5.3. List of Raw Material Suppliers
        3.5.4. List of Existing and Potential Buyer’s
    3.6. Investment Feasibility Matrix
    3.7. Value Chain Analysis
        3.7.1. Profit Margin Analysis
        3.7.2. Wholesalers and Distributors
        3.7.3. Retailers
    3.8. PESTLE and Porter’s Analysis
    3.9. Regulatory Landscape
        3.9.1. By Key Regions
        3.9.2. By Key Countries
    3.10. Regional Parent Market Outlook
    3.11. Production and Consumption Statistics
    3.12. Import and Export Statistics
4. Global Market Analysis 2018 to 2022 and Forecast, 2023 to 2033
    4.1. Historical Market Size Value (US$ Million) & Volume (Units) Analysis, 2018 to 2022
    4.2. Current and Future Market Size Value (US$ Million) & Volume (Units) Projections, 2023 to 2033
        4.2.1. Y-o-Y Growth Trend Analysis
        4.2.2. Absolute $ Opportunity Analysis
5. Global Market Analysis 2018 to 2022 and Forecast 2023 to 2033, By Operation Type
    5.1. Introduction / Key Findings
    5.2. Historical Market Size Value (US$ Million) & Volume (Units) Analysis By Operation Type, 2018 to 2022
    5.3. Current and Future Market Size Value (US$ Million) & Volume (Units) Analysis and Forecast By Operation Type, 2023 to 2033
        5.3.1. Electric
        5.3.2. Non-Electric
    5.4. Y-o-Y Growth Trend Analysis By Operation Type, 2018 to 2022
    5.5. Absolute $ Opportunity Analysis By Operation Type, 2023 to 2033
6. Global Market Analysis 2018 to 2022 and Forecast 2023 to 2033, By Application Type
    6.1. Introduction / Key Findings
    6.2. Historical Market Size Value (US$ Million) & Volume (Units) Analysis By Application Type, 2018 to 2022
    6.3. Current and Future Market Size Value (US$ Million) & Volume (Units) Analysis and Forecast By Application Type, 2023 to 2033
        6.3.1. Residential
            6.3.1.1. Salt-based
            6.3.1.2. Salt-free
        6.3.2. Industrial
        6.3.3. Commercial
    6.4. Y-o-Y Growth Trend Analysis By Application Type, 2018 to 2022
    6.5. Absolute $ Opportunity Analysis By Application Type, 2023 to 2033
7. Global Market Analysis 2018 to 2022 and Forecast 2023 to 2033, By Design
    7.1. Introduction / Key Findings
    7.2. Historical Market Size Value (US$ Million) & Volume (Units) Analysis By Design, 2018 to 2022
    7.3. Current and Future Market Size Value (US$ Million) & Volume (Units) Analysis and Forecast By Design, 2023 to 2033
        7.3.1. Mono Cylinder
        7.3.2. Twin Cylinder
        7.3.3. Multi-Cylinder
    7.4. Y-o-Y Growth Trend Analysis By Design, 2018 to 2022
    7.5. Absolute $ Opportunity Analysis By Design, 2023 to 2033
8. Global Market Analysis 2018 to 2022 and Forecast 2023 to 2033, By Region
    8.1. Introduction
    8.2. Historical Market Size Value (US$ Million) & Volume (Units) Analysis By Region, 2018 to 2022
    8.3. Current Market Size Value (US$ Million) & Volume (Units) Analysis and Forecast By Region, 2023 to 2033
        8.3.1. North America
        8.3.2. Latin America
        8.3.3. Western Europe
        8.3.4. Eastern Europe
        8.3.5. South Asia and Pacific
        8.3.6. East Asia
        8.3.7. Middle East and Africa
    8.4. Market Attractiveness Analysis By Region
9. North America Market Analysis 2018 to 2022 and Forecast 2023 to 2033, By Country
    9.1. Historical Market Size Value (US$ Million) & Volume (Units) Trend Analysis By Market Taxonomy, 2018 to 2022
    9.2. Market Size Value (US$ Million) & Volume (Units) Forecast By Market Taxonomy, 2023 to 2033
        9.2.1. By Country
            9.2.1.1. USA
            9.2.1.2. Canada
        9.2.2. By Operation Type
        9.2.3. By Application Type
        9.2.4. By Design
    9.3. Market Attractiveness Analysis
        9.3.1. By Country
        9.3.2. By Operation Type
        9.3.3. By Application Type
        9.3.4. By Design
    9.4. Key Takeaways
10. Latin America Market Analysis 2018 to 2022 and Forecast 2023 to 2033, By Country
    10.1. Historical Market Size Value (US$ Million) & Volume (Units) Trend Analysis By Market Taxonomy, 2018 to 2022
    10.2. Market Size Value (US$ Million) & Volume (Units) Forecast By Market Taxonomy, 2023 to 2033
        10.2.1. By Country
            10.2.1.1. Brazil
            10.2.1.2. Mexico
            10.2.1.3. Rest of Latin America
        10.2.2. By Operation Type
        10.2.3. By Application Type
        10.2.4. By Design
    10.3. Market Attractiveness Analysis
        10.3.1. By Country
        10.3.2. By Operation Type
        10.3.3. By Application Type
        10.3.4. By Design
    10.4. Key Takeaways
11. Western Europe Market Analysis 2018 to 2022 and Forecast 2023 to 2033, By Country
    11.1. Historical Market Size Value (US$ Million) & Volume (Units) Trend Analysis By Market Taxonomy, 2018 to 2022
    11.2. Market Size Value (US$ Million) & Volume (Units) Forecast By Market Taxonomy, 2023 to 2033
        11.2.1. By Country
            11.2.1.1. Germany
            11.2.1.2. UK
            11.2.1.3. France
            11.2.1.4. Spain
            11.2.1.5. Italy
            11.2.1.6. Rest of Western Europe
        11.2.2. By Operation Type
        11.2.3. By Application Type
        11.2.4. By Design
    11.3. Market Attractiveness Analysis
        11.3.1. By Country
        11.3.2. By Operation Type
        11.3.3. By Application Type
        11.3.4. By Design
    11.4. Key Takeaways
12. Eastern Europe Market Analysis 2018 to 2022 and Forecast 2023 to 2033, By Country
    12.1. Historical Market Size Value (US$ Million) & Volume (Units) Trend Analysis By Market Taxonomy, 2018 to 2022
    12.2. Market Size Value (US$ Million) & Volume (Units) Forecast By Market Taxonomy, 2023 to 2033
        12.2.1. By Country
            12.2.1.1. Poland
            12.2.1.2. Russia
            12.2.1.3. Czech Republic
            12.2.1.4. Romania
            12.2.1.5. Rest of Eastern Europe
        12.2.2. By Operation Type
        12.2.3. By Application Type
        12.2.4. By Design
    12.3. Market Attractiveness Analysis
        12.3.1. By Country
        12.3.2. By Operation Type
        12.3.3. By Application Type
        12.3.4. By Design
    12.4. Key Takeaways
13. South Asia and Pacific Market Analysis 2018 to 2022 and Forecast 2023 to 2033, By Country
    13.1. Historical Market Size Value (US$ Million) & Volume (Units) Trend Analysis By Market Taxonomy, 2018 to 2022
    13.2. Market Size Value (US$ Million) & Volume (Units) Forecast By Market Taxonomy, 2023 to 2033
        13.2.1. By Country
            13.2.1.1. India
            13.2.1.2. Bangladesh
            13.2.1.3. Australia
            13.2.1.4. New Zealand
            13.2.1.5. Rest of South Asia and Pacific
        13.2.2. By Operation Type
        13.2.3. By Application Type
        13.2.4. By Design
    13.3. Market Attractiveness Analysis
        13.3.1. By Country
        13.3.2. By Operation Type
        13.3.3. By Application Type
        13.3.4. By Design
    13.4. Key Takeaways
14. East Asia Market Analysis 2018 to 2022 and Forecast 2023 to 2033, By Country
    14.1. Historical Market Size Value (US$ Million) & Volume (Units) Trend Analysis By Market Taxonomy, 2018 to 2022
    14.2. Market Size Value (US$ Million) & Volume (Units) Forecast By Market Taxonomy, 2023 to 2033
        14.2.1. By Country
            14.2.1.1. China
            14.2.1.2. Japan
            14.2.1.3. South Korea
        14.2.2. By Operation Type
        14.2.3. By Application Type
        14.2.4. By Design
    14.3. Market Attractiveness Analysis
        14.3.1. By Country
        14.3.2. By Operation Type
        14.3.3. By Application Type
        14.3.4. By Design
    14.4. Key Takeaways
15. Middle East and Africa Market Analysis 2018 to 2022 and Forecast 2023 to 2033, By Country
    15.1. Historical Market Size Value (US$ Million) & Volume (Units) Trend Analysis By Market Taxonomy, 2018 to 2022
    15.2. Market Size Value (US$ Million) & Volume (Units) Forecast By Market Taxonomy, 2023 to 2033
        15.2.1. By Country
            15.2.1.1. GCC Countries
            15.2.1.2. South Africa
            15.2.1.3. Israel
            15.2.1.4. Rest of MEA
        15.2.2. By Operation Type
        15.2.3. By Application Type
        15.2.4. By Design
    15.3. Market Attractiveness Analysis
        15.3.1. By Country
        15.3.2. By Operation Type
        15.3.3. By Application Type
        15.3.4. By Design
    15.4. Key Takeaways
16. Key Countries Market Analysis
    16.1. USA
        16.1.1. Pricing Analysis
        16.1.2. Market Share Analysis, 2022
            16.1.2.1. By Operation Type
            16.1.2.2. By Application Type
            16.1.2.3. By Design
    16.2. Canada
        16.2.1. Pricing Analysis
        16.2.2. Market Share Analysis, 2022
            16.2.2.1. By Operation Type
            16.2.2.2. By Application Type
            16.2.2.3. By Design
    16.3. Brazil
        16.3.1. Pricing Analysis
        16.3.2. Market Share Analysis, 2022
            16.3.2.1. By Operation Type
            16.3.2.2. By Application Type
            16.3.2.3. By Design
    16.4. Mexico
        16.4.1. Pricing Analysis
        16.4.2. Market Share Analysis, 2022
            16.4.2.1. By Operation Type
            16.4.2.2. By Application Type
            16.4.2.3. By Design
    16.5. Germany
        16.5.1. Pricing Analysis
        16.5.2. Market Share Analysis, 2022
            16.5.2.1. By Operation Type
            16.5.2.2. By Application Type
            16.5.2.3. By Design
    16.6. UK
        16.6.1. Pricing Analysis
        16.6.2. Market Share Analysis, 2022
            16.6.2.1. By Operation Type
            16.6.2.2. By Application Type
            16.6.2.3. By Design
    16.7. France
        16.7.1. Pricing Analysis
        16.7.2. Market Share Analysis, 2022
            16.7.2.1. By Operation Type
            16.7.2.2. By Application Type
            16.7.2.3. By Design
    16.8. Spain
        16.8.1. Pricing Analysis
        16.8.2. Market Share Analysis, 2022
            16.8.2.1. By Operation Type
            16.8.2.2. By Application Type
            16.8.2.3. By Design
    16.9. Italy
        16.9.1. Pricing Analysis
        16.9.2. Market Share Analysis, 2022
            16.9.2.1. By Operation Type
            16.9.2.2. By Application Type
            16.9.2.3. By Design
    16.10. Poland
        16.10.1. Pricing Analysis
        16.10.2. Market Share Analysis, 2022
            16.10.2.1. By Operation Type
            16.10.2.2. By Application Type
            16.10.2.3. By Design
    16.11. Russia
        16.11.1. Pricing Analysis
        16.11.2. Market Share Analysis, 2022
            16.11.2.1. By Operation Type
            16.11.2.2. By Application Type
            16.11.2.3. By Design
    16.12. Czech Republic
        16.12.1. Pricing Analysis
        16.12.2. Market Share Analysis, 2022
            16.12.2.1. By Operation Type
            16.12.2.2. By Application Type
            16.12.2.3. By Design
    16.13. Romania
        16.13.1. Pricing Analysis
        16.13.2. Market Share Analysis, 2022
            16.13.2.1. By Operation Type
            16.13.2.2. By Application Type
            16.13.2.3. By Design
    16.14. India
        16.14.1. Pricing Analysis
        16.14.2. Market Share Analysis, 2022
            16.14.2.1. By Operation Type
            16.14.2.2. By Application Type
            16.14.2.3. By Design
    16.15. Bangladesh
        16.15.1. Pricing Analysis
        16.15.2. Market Share Analysis, 2022
            16.15.2.1. By Operation Type
            16.15.2.2. By Application Type
            16.15.2.3. By Design
    16.16. Australia
        16.16.1. Pricing Analysis
        16.16.2. Market Share Analysis, 2022
            16.16.2.1. By Operation Type
            16.16.2.2. By Application Type
            16.16.2.3. By Design
    16.17. New Zealand
        16.17.1. Pricing Analysis
        16.17.2. Market Share Analysis, 2022
            16.17.2.1. By Operation Type
            16.17.2.2. By Application Type
            16.17.2.3. By Design
    16.18. China
        16.18.1. Pricing Analysis
        16.18.2. Market Share Analysis, 2022
            16.18.2.1. By Operation Type
            16.18.2.2. By Application Type
            16.18.2.3. By Design
    16.19. Japan
        16.19.1. Pricing Analysis
        16.19.2. Market Share Analysis, 2022
            16.19.2.1. By Operation Type
            16.19.2.2. By Application Type
            16.19.2.3. By Design
    16.20. South Korea
        16.20.1. Pricing Analysis
        16.20.2. Market Share Analysis, 2022
            16.20.2.1. By Operation Type
            16.20.2.2. By Application Type
            16.20.2.3. By Design
    16.21. GCC Countries
        16.21.1. Pricing Analysis
        16.21.2. Market Share Analysis, 2022
            16.21.2.1. By Operation Type
            16.21.2.2. By Application Type
            16.21.2.3. By Design
    16.22. South Africa
        16.22.1. Pricing Analysis
        16.22.2. Market Share Analysis, 2022
            16.22.2.1. By Operation Type
            16.22.2.2. By Application Type
            16.22.2.3. By Design
    16.23. Israel
        16.23.1. Pricing Analysis
        16.23.2. Market Share Analysis, 2022
            16.23.2.1. By Operation Type
            16.23.2.2. By Application Type
            16.23.2.3. By Design
17. Market Structure Analysis
    17.1. Competition Dashboard
    17.2. Competition Benchmarking
    17.3. Market Share Analysis of Top Players
        17.3.1. By Regional
        17.3.2. By Operation Type
        17.3.3. By Application Type
        17.3.4. By Design
18. Competition Analysis
    18.1. Competition Deep Dive
        18.1.1. EcoWater Systems LLC
            18.1.1.1. Overview
            18.1.1.2. Product Portfolio
            18.1.1.3. Profitability by Market Segments
            18.1.1.4. Sales Footprint
            18.1.1.5. Strategy Overview
                18.1.1.5.1. Marketing Strategy
                18.1.1.5.2. Product Strategy
                18.1.1.5.3. Channel Strategy
        18.1.2. Culligan International Company
            18.1.2.1. Overview
            18.1.2.2. Product Portfolio
            18.1.2.3. Profitability by Market Segments
            18.1.2.4. Sales Footprint
            18.1.2.5. Strategy Overview
                18.1.2.5.1. Marketing Strategy
                18.1.2.5.2. Product Strategy
                18.1.2.5.3. Channel Strategy
        18.1.3. Kinetico Incorporated
            18.1.3.1. Overview
            18.1.3.2. Product Portfolio
            18.1.3.3. Profitability by Market Segments
            18.1.3.4. Sales Footprint
            18.1.3.5. Strategy Overview
                18.1.3.5.1. Marketing Strategy
                18.1.3.5.2. Product Strategy
                18.1.3.5.3. Channel Strategy
        18.1.4. Hydroflux
            18.1.4.1. Overview
            18.1.4.2. Product Portfolio
            18.1.4.3. Profitability by Market Segments
            18.1.4.4. Sales Footprint
            18.1.4.5. Strategy Overview
                18.1.4.5.1. Marketing Strategy
                18.1.4.5.2. Product Strategy
                18.1.4.5.3. Channel Strategy
        18.1.5. Envicare Technologies Pvt. Ltd.
            18.1.5.1. Overview
            18.1.5.2. Product Portfolio
            18.1.5.3. Profitability by Market Segments
            18.1.5.4. Sales Footprint
            18.1.5.5. Strategy Overview
                18.1.5.5.1. Marketing Strategy
                18.1.5.5.2. Product Strategy
                18.1.5.5.3. Channel Strategy
        18.1.6. Wychwood Water Systems Ltd.
            18.1.6.1. Overview
            18.1.6.2. Product Portfolio
            18.1.6.3. Profitability by Market Segments
            18.1.6.4. Sales Footprint
            18.1.6.5. Strategy Overview
                18.1.6.5.1. Marketing Strategy
                18.1.6.5.2. Product Strategy
                18.1.6.5.3. Channel Strategy
        18.1.7. Harvey Water Softeners Ltd.
            18.1.7.1. Overview
            18.1.7.2. Product Portfolio
            18.1.7.3. Profitability by Market Segments
            18.1.7.4. Sales Footprint
            18.1.7.5. Strategy Overview
                18.1.7.5.1. Marketing Strategy
                18.1.7.5.2. Product Strategy
                18.1.7.5.3. Channel Strategy
        18.1.8. Pelican Water Systems
            18.1.8.1. Overview
            18.1.8.2. Product Portfolio
            18.1.8.3. Profitability by Market Segments
            18.1.8.4. Sales Footprint
            18.1.8.5. Strategy Overview
                18.1.8.5.1. Marketing Strategy
                18.1.8.5.2. Product Strategy
                18.1.8.5.3. Channel Strategy
        18.1.9. BWT AG
            18.1.9.1. Overview
            18.1.9.2. Product Portfolio
            18.1.9.3. Profitability by Market Segments
            18.1.9.4. Sales Footprint
            18.1.9.5. Strategy Overview
                18.1.9.5.1. Marketing Strategy
                18.1.9.5.2. Product Strategy
                18.1.9.5.3. Channel Strategy
        18.1.10. Marlo Incorporated
            18.1.10.1. Overview
            18.1.10.2. Product Portfolio
            18.1.10.3. Profitability by Market Segments
            18.1.10.4. Sales Footprint
            18.1.10.5. Strategy Overview
                18.1.10.5.1. Marketing Strategy
                18.1.10.5.2. Product Strategy
                18.1.10.5.3. Channel Strategy
        18.1.11. Monarch Water Ltd.
            18.1.11.1. Overview
            18.1.11.2. Product Portfolio
            18.1.11.3. Profitability by Market Segments
            18.1.11.4. Sales Footprint
            18.1.11.5. Strategy Overview
                18.1.11.5.1. Marketing Strategy
                18.1.11.5.2. Product Strategy
                18.1.11.5.3. Channel Strategy
        18.1.12. Qingdao Haier Co., Ltd
            18.1.12.1. Overview
            18.1.12.2. Product Portfolio
            18.1.12.3. Profitability by Market Segments
            18.1.12.4. Sales Footprint
            18.1.12.5. Strategy Overview
                18.1.12.5.1. Marketing Strategy
                18.1.12.5.2. Product Strategy
                18.1.12.5.3. Channel Strategy
        18.1.13. Atlas Filtri
            18.1.13.1. Overview
            18.1.13.2. Product Portfolio
            18.1.13.3. Profitability by Market Segments
            18.1.13.4. Sales Footprint
            18.1.13.5. Strategy Overview
                18.1.13.5.1. Marketing Strategy
                18.1.13.5.2. Product Strategy
                18.1.13.5.3. Channel Strategy
        18.1.14. Watts Water Technologies Inc.
            18.1.14.1. Overview
            18.1.14.2. Product Portfolio
            18.1.14.3. Profitability by Market Segments
            18.1.14.4. Sales Footprint
            18.1.14.5. Strategy Overview
                18.1.14.5.1. Marketing Strategy
                18.1.14.5.2. Product Strategy
                18.1.14.5.3. Channel Strategy
        18.1.15. Feedwater Limited
            18.1.15.1. Overview
            18.1.15.2. Product Portfolio
            18.1.15.3. Profitability by Market Segments
            18.1.15.4. Sales Footprint
            18.1.15.5. Strategy Overview
                18.1.15.5.1. Marketing Strategy
                18.1.15.5.2. Product Strategy
                18.1.15.5.3. Channel Strategy
19. Assumptions & Acronyms Used
20. Research Methodology
Recommendations

Industrial Automation

Water Treatment Market

February 2024

REP-GB-5332

342 pages

Industrial Automation

Water Desalination Equipment Market

October 2023

REP-GB-851

342 pages

Chemicals & Materials

Water-Borne Inks and Paints Market

October 2022

REP-GB-188

250 pages

Explore Industrial Automation Insights

View Reports
Future Market Insights

Water Softening Systems Market

Schedule a Call