Methodology

Brine Tank for Water Softener Market Forecast and Outlook 2025 to 2035

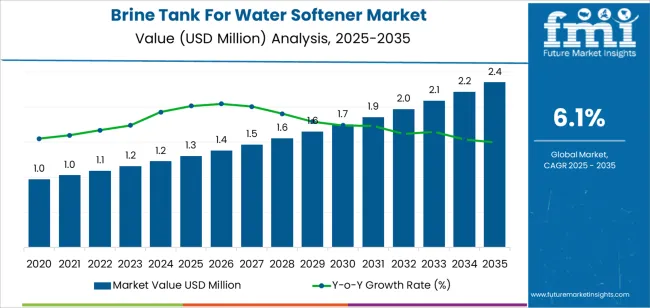
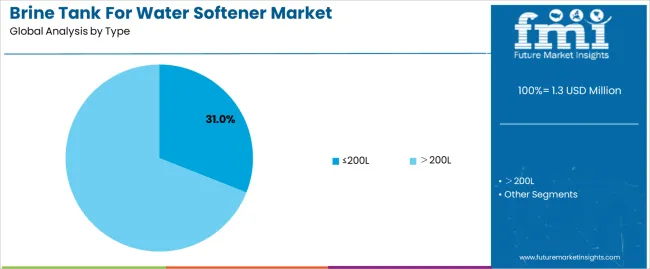
The brine tank market for water softeners is expected to expand from USD 1.3 million in 2025 to USD 2.3 million by 2035, at a CAGR of 6.1%, with the segment structure shaping most of the growth. By type, the ≤200L segment leads with approximately 31% share in 2025, driven by its alignment with residential units and compact commercial softeners that require predictable salt-dissolution behaviour and manageable footprints. These tanks support standardized regeneration cycles in household systems, restaurants, small offices and retrofit installations where space, service intervals and salt-handling efficiency determine product selection. The >200L segment grows faster as commercial kitchens, hotels, laundries and light-industrial facilities adopt higher-capacity softeners that rely on extended regeneration intervals and larger brine reserves. Thicker-wall HDPE construction, improved grid plates and stable brine-well geometry define performance advantages across both categories.

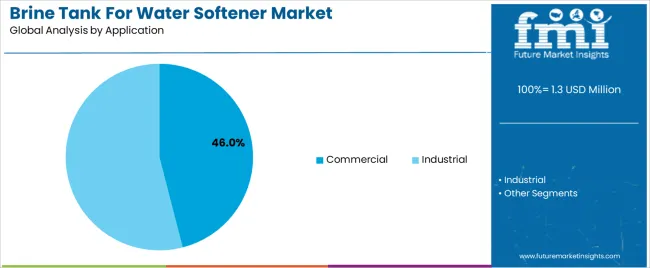
Application segmentation is dominated by the commercial segment at about 46% share, reflecting steady installation of softening systems in hospitality, food service, healthcare, office buildings and institutional facilities. These environments require consistent resin regeneration to prevent scale buildup in boilers, dishwashers, heat-exchange systems and plumbing lines, making brine-tank reliability central to operational continuity. Industrial applications form a smaller but intensive-usage tier, centred on process stability and larger daily withdrawal volumes in workshops, small manufacturing units and food processing sites. End-use behaviour reinforces segment momentum: residential demand accounts for the largest share of new installations, surpassing 55% of new systems by 2030, while commercial and light-industrial users anchor the higher-value, higher-capacity segment. As softening adoption broadens and replacement cycles increase, segment-led dynamics sustain market expansion through 2035.
Quick Stats for Brine Tank for Water Softener Market

  • Brine Tank for Water Softener Market Value (2025): USD 1.3 million
  • Brine Tank for Water Softener Market Forecast Value (2035): USD 2.3 million
  • Brine Tank for Water Softener Market Forecast CAGR (2025 to 2035): 6.1%
  • Leading Type in Brine Tank for Water Softener Market: ≤200L (≈31.0% share)
  • Key Growth Regions: China, India, North America, Europe, East Asia
  • Top Players in Brine Tank for Water Softener Market: Clack Corporation, Gilmore-Kramer Company, Pentair, M.I.P. NV, Applied Membranes Inc., Chemical Support Systems, Enduraplas, Snyder Industries, Performance Water Products, Hebei Cheng Da Hua Mo Technology, Canature Water Group, Nelsen Corp, Camion Systems

Brine Tank For Water Softener Market Market Value Analysis

Between 2030 and 2033, the market shifts into a moderate acceleration stage, where demand continues to climb but at a more measured pace as penetration levels increase in key regions. After 2033, the industry enters a deceleration pattern, with growth easing as installation rates stabilize and the market becomes more replacement-driven. Even with the slowing trajectory, ongoing residential construction, refurbishment activity, and incremental improvements in tank materials and production processes keep the market advancing through 2035.

What is the Growth Forecast for the Brine Tank for Water Softener Market through 2035?

Between 2025 and 2030, the Brine Tank for Water Softener Market expands from USD 1.3 million to approximately USD 1.7 million, positioning the industry within the Late Growth Stage of the maturity curve. Adoption is supported by rising residential and light-commercial water-treatment installations, with unit demand increasing from roughly USD 1.3 million to USD 1.7 million units as municipalities report higher hardness levels and end users seek consistent regeneration performance in ion-exchange systems. Procurement patterns reflect growing use of high-density polyethylene tanks, brine-well designs with improved salinity control, and float-valve assemblies designed for predictable refill cycles. By 2030, more than 55% of new installations will originate from residential users, while commercial adoption will be influenced by improved water-use efficiency and reduced service-call frequency.

From 2030 to 2035, the market grows from USD 1.7 million to USD 2.3 million, entering the Early Maturity Stage of the adoption lifecycle as growth increasingly follows replacement and upgrade cycles. Annual demand rises toward 2.2–2.3 million units as end users shift to tanks with higher structural integrity, optimized salt-dissolution performance, and improved compatibility with metered regeneration softeners. Industrial buyers expand modestly, focusing on brine systems supporting consistent regeneration volumes for small-scale manufacturing and foodservice operations. Technological enhancements include thicker-wall rotational-molded tanks, corrosion-resistant grid plates, and multi-stage safety overflow assemblies. Regional capacity additions in Asia-Pacific and Latin America contribute 10–12 % of global supply growth, while late adopters, primarily rural households and small businesses, accelerate their shift to automated softening systems, reinforcing stable long-term demand characteristics.

Brine Tank for Water Softener Market Key Takeaways

Metric Value
Market Value (2025) USD 1.3 million
Market Forecast Value (2035) USD 2.3 million
Forecast CAGR (2025 to 2035) 6.1%

Why Is the Brine Tank for Water Softener Market Growing Across Residential and Commercial Water Treatment Systems?

Demand for brine tanks is rising as households, commercial buildings, and light-industrial facilities adopt ion-exchange water softeners to address hardness caused by elevated calcium and magnesium levels. Brine tanks store and dissolve salt used to regenerate softener resin, making their structural reliability essential for system uptime. Manufacturers improve tank wall thickness, corrosion resistance, and valve compatibility to maintain stable brine saturation and prevent salt bridging. Growth in residential construction, coupled with greater awareness of scale-related appliance wear, continues to increase adoption in North America, Europe, and emerging urban markets. Facilities managers and installers favor modular tank designs that simplify cleaning and reduce leakage risk during long service cycles.

Market expansion is also supported by advances in automated regeneration and high-efficiency softening systems that require consistent brine quality. Commercial applications including hospitality, food service, and healthcare use larger brine tanks to maintain workflow continuity and meet operational water-quality standards. Producers refine polyethylene molding, lid safety features, and grid-plate configurations to enhance durability under varied temperature and humidity conditions. Expanded regional water-treatment regulations, particularly in areas facing mineral-rich groundwater, reinforce ongoing demand. Although transport costs and price sensitivity affect smaller buyers, improved tank longevity and reduced maintenance offset initial expense, ensuring steady deployment of brine tanks across global softening installations.

How Do Capacity Ranges and End-Use Requirements Shape Segmentation in the Brine Tank for Water Softener Market?

The brine tank for water softener market is segmented by type, application, and region. By type, the market is divided into tanks with capacities of ≤200L and those above 200L. Based on application, it is categorized into commercial and industrial uses. Regionally, the market is segmented into North America, Europe, East Asia, South Asia, Latin America, and the Middle East & Africa. These divisions reflect capacity selection, salt-dissolution patterns, and regional differences in commercial and industrial water-treatment adoption.
What Factors Support the Leading Position of ≤200L Brine Tanks in Market Demand?

Brine Tank For Water Softener Market Analysis By Type

The ≤200L segment accounts for approximately 31.0% of the global brine tank for water softener market in 2025, making it the leading type category. This segment’s position reflects its suitability for light-duty and medium-capacity systems used in small commercial facilities, foodservice operations, and residential-scale commercial environments. Tanks in this range offer manageable footprint requirements, predictable salt-dosing behavior, and compatibility with widely deployed compact water softener units. Their smaller capacity aligns with service intervals and regeneration cycles typical of moderate water-consumption settings.

Manufacturers design ≤200L tanks with reinforced polymer shells, corrosion-resistant fittings, and stable internal brine grids to maintain consistent salt saturation. Their installation flexibility supports retrofitting in constrained mechanical rooms found in office buildings, restaurants, and small retail establishments. Regions such as North America and Europe show strong adoption due to broad use of mid-range softening systems in commercial plumbing networks. Suppliers continue improving lid seals, internal brine-well geometry, and structural integrity to maintain performance under repeated regeneration cycles. The ≤200L category leads the market because it supports the operational needs of a wide base of users seeking stable brine supply, manageable maintenance routines, and space-efficient system integration.
Why Does the Commercial Sector Represent the Largest Application Share for Brine Tanks?

Brine Tank For Water Softener Market Analysis By Application

The commercial segment represents about 46.0% of the total brine tank for water softener market in 2025, making it the dominant application category. This position is tied to the widespread installation of water softening systems in hotels, restaurants, office buildings, laundries, and small institutional facilities where consistent water quality supports equipment longevity and routine operations. Commercial users depend on reliable softening to limit scale formation in boilers, dishwashers, heating systems, and plumbing networks, creating steady demand for brine tanks with predictable regeneration behavior.

Manufacturers supply tanks in capacity ranges aligned with daily usage cycles found in commercial settings, offering structural robustness and straightforward maintenance features. Growth in this segment is supported by expanding service industries across North America, Europe, and East Asia, where facilities focus on controlling maintenance costs linked to hard-water exposure. The commercial category also benefits from retrofitting activity in older buildings integrating compact water-treatment systems to meet updated operational standards. The segment maintains its leading position because commercial facilities generate continuous demand for softening systems with stable brine supply characteristics, moderate service intervals, and compatibility with widely used mid-capacity softener units.

What are the Key Trends, Drivers, and Restraints in the Brine Tank for Water Softener Market?

The brine tank for water softener market is expanding as residential, commercial and light-industrial users adopt ion-exchange softening systems to address hardness issues. Brine tanks enable regeneration cycles and stable salt storage, making them essential companions to softener units. Growth is supported by rising installation of household softeners, stricter water-quality expectations and increased use of commercial softening systems in hospitality and food service. Adoption is limited by cost sensitivity, variations in water hardness across regions and maintenance requirements tied to salt quality and tank hygiene. Manufacturers are refining tank materials, shapes and capacities to meet diverse installation needs.

How is rising demand for softened water influencing brine tank adoption?

Demand increases as households and commercial facilities seek consistent water quality for plumbing protection, appliance longevity and improved cleaning performance. Brine tanks support regeneration cycles that restore resin capacity, making them critical for systems exposed to frequent hardness loading. As water-treatment providers expand bundled softener offerings, brine tanks are increasingly being supplied with standardized fittings and compact footprints to suit modern utility spaces. Growth in restaurants, hotels and small industrial sites also reinforces demand where stable softening performance is required for equipment protection and service reliability.

What factors are restraining broader use of brine tanks in softening systems?

Adoption is limited by cost considerations in regions where hardness levels vary or where water-treatment remains optional. Some users avoid softening systems due to salt-handling requirements, periodic cleaning and tank maintenance. Space constraints in older buildings may deter installation of large brine tanks. Variability in salt quality can lead to bridging or sludge formation, reducing system reliability and causing additional servicing needs. These issues reduce uptake in cost-sensitive markets or among users seeking low-maintenance water-treatment alternatives.

What trends are shaping design and functionality in the brine tank market?

Trends include development of higher-durability polyethylene tanks, improved safety valves, and integrated salt-level monitoring to reduce manual checks. Manufacturers are offering slim profiles, modular components and colour-coded fittings to simplify installation and servicing. Interest is growing in tanks designed for low-salt or eco-efficient softening cycles as facilities aim to reduce salt consumption. Commercial users are adopting larger-capacity tanks to support extended operating periods between refills. As water-treatment systems become more compact and automated, brine tank designs continue to shift toward improved reliability, ease of use and space efficiency.
What is the Analysis of the Brine Tank for Water Softener Market by Key Country?

Brine Tank For Water Softener Market Cagr Analysis By Country

Country CAGR (%)
China 8.2%
India 7.6%
Germany 7.0%
Brazil 6.4%
USA 5.8%
UK 5.2%
Japan 4.6%

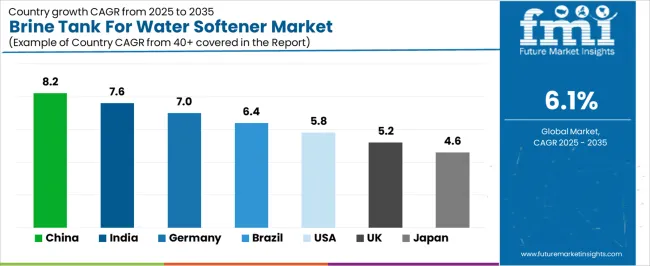
The Brine Tank for Water Softener Market is expanding steadily worldwide, with China leading at an 8.2% CAGR through 2035, supported by rising residential water treatment adoption, strong manufacturing capacity, and increasing urban hardness-level concerns. India follows at 7.6%, driven by rapid urbanization, growing awareness of water quality, and rising installations of household and commercial softening systems. Germany records a 7.0% CAGR, reflecting advanced engineering, premium material use, and demand from industrial water conditioning processes. Brazil grows at 6.4%, benefitting from expanding residential water filtration needs and infrastructure modernization. The USA, at 5.8%, remains a mature market emphasizing durable, efficient tank designs, while the UK (5.2%) and Japan (4.6%) focus on compact, efficient, and eco-smart brine tank solutions aligned with stringent water quality standards.

How Is Residential and Utility Demand Driving Market Growth in China?

China is projected to grow at a CAGR of 8.2% through 2035 in the brine tank market. Expansion of residential and commercial water-softening installations drive demand for larger and modular brine tanks. Manufacturers are improving corrosion-resistant liners, efficient salt-solution mixing, and compact space-saving designs for tight plant rooms. Utility and apartment retrofit projects are increasing procurement across urban regions. Regulatory focus on brine discharge handling and local disposal protocols influences system selection. Service contracts and operator training improve long-term maintenance and operational consistency. Market growth aligns with increased adoption of automated solution monitoring and refill alerts nationwide.

  • Metro expansion increases reliance on unified digital fare processing.
  • Mobile wallet adoption strengthens transaction flow across major transit systems.
  • Cloud settlement tools improve accuracy for high-volume fare clearing.
  • Interoperable cards enable seamless movement across multiple transport modes.

Why Is Urban Infrastructure and Hospitality Expansion Supporting India?

India is projected to grow at a CAGR of 7.6% through 2035 in the brine tank market. Rising household connections and hospitality sector expansion increase requirement for compact brine systems. Local manufacturers design low-maintenance valves, easy-refill access, and robust salt-retention features. Regional dealers supply modular tanks tailored to varied water hardness profiles. Government programs promoting potable water infrastructure indirectly support softening equipment procurement. Training for maintenance crews and affordable service plans boost system uptime. Integration of salt-efficiency controllers and timed regeneration cycles reduces operating costs for operators. Market expansion continues across tiered cities and industrial townships through 2035 projections nationally.
  • Metro network growth increases adoption of integrated digital fare platforms.
  • Mobile ticketing reliability improves efficiency across expanding commuter corridors.
  • Real-time clearing capabilities support consistent fare processing during peaks.
  • Interoperable ticketing systems enhance connectivity across diverse regional networks.

How Do Utility Standards and Industrial Needs Shape Germany?

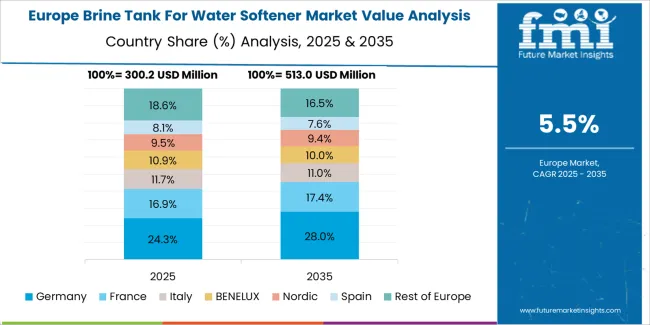
Brine Tank For Water Softener Market Europe Country Market Share Analysis, 2025 & 2035

Germany is projected to grow at a CAGR of 7.0% through 2035 in the brine tank market. Demand from municipal utilities and industrial laundries supports robust procurement of certified brine systems. Manufacturers emphasize certified materials, leak-proof fittings, and thermal-resistant housings. Integration with metering systems and telemetry improves refill scheduling and tracking. European compliance encourages improved brine containment and disposal procedures. Service contracts focus on preventive maintenance and documented performance records. Industrial laundries adopt high-capacity tanks with automated dosing to reduce interruptions. Engineering firms specify durable liners, nationwide documentation for secondary containment and salt handling training.

  • Contactless validation accuracy improves boarding efficiency across busy transit corridors.
  • Regional transport unions strengthen unified fare frameworks across multiple services.
  • Digital-ticketing expansion encourages consistent usage among frequent urban commuters.
  • Interoperable cards support seamless movement across growing regional networks.

Why Is Municipal Upgrading and Tourism Supporting Brazil?

Brazil is projected to grow at a CAGR of 6.4% through 2035 in the brine tank market. Expansion of municipal water-treatment projects and hotel developments increases installations of modular and large-volume tanks. Local makers adapt corrosion-resistant coatings and large-volume configurations for regional conditions. Regional suppliers partner with engineering firms to offer turnkey solutions and commissioning support. Refill logistics and salt sourcing remain operational priorities for utilities and service providers. Training programs for operators improve safe handling and storage practices. Demand peaks during seasonal droughts and heavy tourist periods in coastal cities, prompting regionally audited supplier warranties and maintenance documentation.
  • Bus fleet upgrades drive expansion of integrated digital fare systems.
  • Mobile-payment behavior increases consistent usage across dense urban routes.
  • Unified fare structures support smooth transfers across major transit lines.
  • Contactless reliability improves passenger movement across varied transportation modes.

How Are Replacement Cycles and Building Growth Affecting the United States?

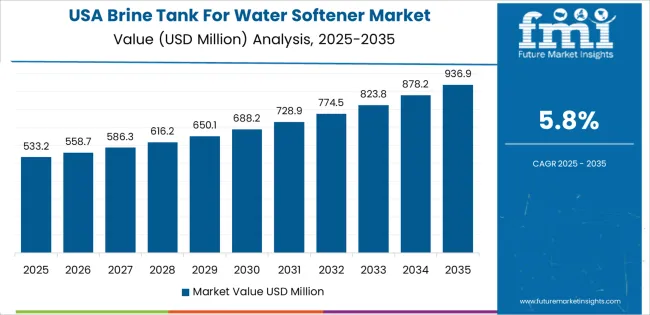
Brine Tank For Water Softener Market Country Value Analysis

USA is projected to grow at a CAGR of 5.8% through 2035 in the brine tank market. Replacement cycles for aging municipal softeners and new residential developments drive sales across public and private channels. Manufacturers prioritize certified materials, low-leak valve assemblies, and secondary containment for safety. Integration with home automation platforms and metering fosters consumer convenience and remote monitoring. Procurement emphasizes EPA-compliant discharge practices and local permit adherence. Contractors demand clear service agreements and quick refill logistics. State-level rebates and utility incentives influence homeowner purchase timing and model choices. Manufacturers provide extended warranties, certified installation partners, and maintenance training.

  • Account-based ticketing expands flexibility across major regional transit agencies.
  • Open-loop payments support broad interoperability across multiple transportation modes.
  • Modern validation tools improve boarding flow during peak commuter hours.
  • Infrastructure funding promotes rollout of unified digital fare platforms.

Why Are Council Procurement and Property Constraints Shaping UK Demand?

UK is projected to grow at a CAGR of 5.2% through 2035 in the brine tank market. Demand from rental properties and hospitality sectors supports compact tank installations in constrained locations. Manufacturers ensure compliance with water authority disposal rules and approvals. Service providers focus on documented maintenance, leak detection, and rapid response programmes. Local councils schedule periodic cartridge replacements and salt-resupply tenders under multi-year budgets. Compact basement installations and conservation-area constraints shape aesthetic and access-sensitive design choices. Manufacturers supply low-visual-impact housings and certified installers for sensitive sites. Procurement cycles align with council budgeting and seasonal demand for softened water.
  • Contactless fare systems improve commuter flow across varied transport routes.
  • Mobile wallets strengthen consistent usage across growing transit corridors.
  • Unified fare structures support seamless travel across nationwide transport links.
  • Real-time validation tools improve processing speed during peak hours.

How Is High-Density Urban Living Influencing Japan?

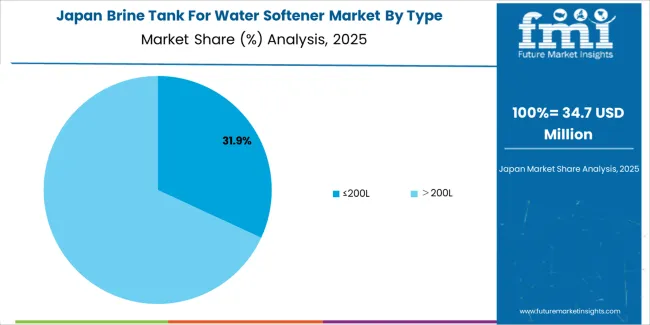
Brine Tank For Water Softener Market Japan Market Share Analysis By Type

Japan is projected to grow at a CAGR of 4.6% through 2035 in the brine tank market. Demand centers on dense urban apartments, commercial kitchens, and hotel installations requiring compact units. Manufacturers emphasize compact designs, seismic securing features, and corrosion protection for coastal and high-humidity sites. Service agreements for regular refill schedules improve reliability in high-rise settings. Integration with building management systems and metering improves operational control and traceability. Local installers provide certified fittings and documented maintenance records. Procurement often links to condominium association replacements, seasonal salt sourcing plans, and warranty coverage. Suppliers offer certified seismic anchoring, spare parts kits, and training.
  • IC-card responsiveness improves commuter flow across dense passenger networks.
  • Mobile payments widen digital access across major urban corridors.
  • Interoperable systems enhance reliability during transfers between connected lines.
  • Gate-processing speed improves throughput during daily peak travel periods.

How Competitive Is the Global Brine Tank for Water Softener Market and What Defines Its Strategic Landscape?

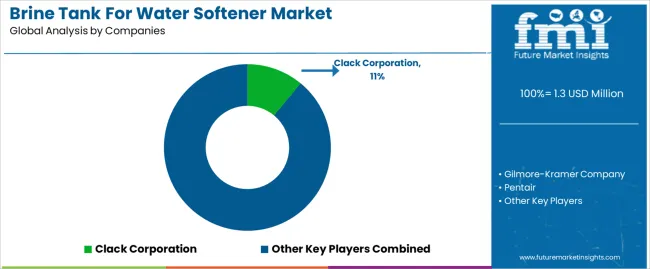
Brine Tank For Water Softener Market Analysis By Company

The global brine tank for water softener market is moderately fragmented, supported by manufacturers supplying molded tanks, brine wells, and accessories for residential, commercial, and industrial softening systems. Clack Corporation holds a strong position with standardized high-density polyethylene tanks designed for long service life and compatibility with a wide range of control valves. Gilmore-Kramer Company and Pentair maintain significant presence through durable molded products integrated into complete softening assemblies. M.I.P. NV and Applied Membranes Inc. contribute to mid-tier competition with corrosion-resistant tanks suited for municipal facilities and light industrial applications. Chemical Support Systems and Enduraplas broaden the market with specialty tanks engineered for chemical dosing environments where structural reliability and ease of maintenance are central requirements.

Snyder Industries and Performance Water Products strengthen North American supply through high-volume manufacturing and customizable brine tank configurations. Hebei ChengDa HuaMo Technology and Canature Water Group expand Asia’s production base with cost-efficient tanks designed for both OEM integration and aftermarket distribution. Nelsen Corp and Camion Systems enhance market diversity by offering tanks in multiple form factors, supporting varied installation constraints. Competition is shaped by material durability, salt-resistant construction, and compatibility with automated softener systems. Strategic differentiation depends on mold precision, lid and safety-float design, and standardized fitting options. Long-term competitiveness will rely on improved polymer formulations, reduced manufacturing waste, and alignment with growing demand for water-treatment solutions in residential and commercial sectors.

Brine Tank for Water Softener Market

  • Clack Corporation
  • Gilmore-Kramer Company
  • Pentair
  • M.I.P. NV
  • Applied Membranes Inc.
  • Chemical Support Systems
  • Enduraplas
  • Snyder Industries
  • Performance Water Products
  • Hebei ChengDa HuaMo Technology Co. Ltd.
  • Canature Water Group
  • Nelsen Corp
  • Camion Systems etc.

Report Scope for the Brine Tank for Water Softener Market

Items Values
Quantitative Units (2025) USD million
Type ≤200L, >200L
Application Commercial, Industrial
End User Residential, Commercial, Light Industrial
Regions Covered East Asia, Europe, North America, South Asia, Latin America, Middle East & Africa, Eastern Europe
Countries Covered China, India, Germany, Brazil, USA, UK, Japan, and 40+ additional countries
Key Companies Profiled Clack Corporation, Gilmore-Kramer Company, Pentair, M.I.P. NV, Applied Membranes Inc., Chemical Support Systems, Enduraplas, Snyder Industries, Performance Water Products, Hebei ChengDa HuaMo Technology Co. Ltd., Canature Water Group, Nelsen Corp, Camion Systems
Additional Attributes Dollar sales by type and application categories, regional adoption trends across North America, Europe, and East Asia, competitive landscape across molded tank manufacturers, material durability requirements (HDPE, corrosion-resistant liners), installation footprint characteristics, replacement-driven demand cycles, integration with commercial and residential softeners

Brine Tank for Water Softener Market Segmentation

Type:

  • ≤200L
  • >200L

Application:

  • Commercial
  • Industrial

Region:

  • East Asia
    • China
    • Japan
    • South Korea
    • Taiwan
    • Rest of East Asia
  • Europe
    • Germany
    • UK
    • France
    • Italy
    • Spain
    • Switzerland
    • Nordic
    • BENELUX
    • Rest of Europe
  • North America
    • USA
    • Canada
    • Mexico
  • South Asia
    • India
    • Pakistan
    • Bangladesh
    • Rest of South Asia
  • Latin America
    • Brazil
    • Argentina
    • Chile
    • Rest of Latin America
  • Middle East & Africa
    • Kingdom of Saudi Arabia
    • Other GCC Countries
    • Turkey
    • South Africa
    • Other African Union
    • Rest of Middle East & Africa
  • Eastern Europe
    • Russia
    • Poland
    • Czech Republic
    • Rest of Eastern Europe

Frequently Asked Questions

How big is the brine tank for water softener market in 2025?

The global brine tank for water softener market is estimated to be valued at USD 1.3 million in 2025.

What will be the size of brine tank for water softener market in 2035?

The market size for the brine tank for water softener market is projected to reach USD 2.4 million by 2035.

How much will be the brine tank for water softener market growth between 2025 and 2035?

The brine tank for water softener market is expected to grow at a 6.1% CAGR between 2025 and 2035.

What are the key product types in the brine tank for water softener market?

The key product types in brine tank for water softener market are ≤200l and >200l.

Which application segment to contribute significant share in the brine tank for water softener market in 2025?

In terms of application, commercial segment to command 46.0% share in the brine tank for water softener market in 2025.

Table of Content

  1. Executive Summary
    • Global Market Outlook
    • Demand to side Trends
    • Supply to side Trends
    • Technology Roadmap Analysis
    • Analysis and Recommendations
  2. Market Overview
    • Market Coverage / Taxonomy
    • Market Definition / Scope / Limitations
  3. Market Background
    • Market Dynamics
      • Drivers
      • Restraints
      • Opportunity
      • Trends
    • Scenario Forecast
      • Demand in Optimistic Scenario
      • Demand in Likely Scenario
      • Demand in Conservative Scenario
    • Opportunity Map Analysis
    • Product Life Cycle Analysis
    • Supply Chain Analysis
    • Investment Feasibility Matrix
    • Value Chain Analysis
    • PESTLE and Porter’s Analysis
    • Regulatory Landscape
    • Regional Parent Market Outlook
    • Production and Consumption Statistics
    • Import and Export Statistics
  4. Global Market Analysis 2020 to 2024 and Forecast, 2025 to 2035
    • Historical Market Size Value (USD Million) Analysis, 2020 to 2024
    • Current and Future Market Size Value (USD Million) Projections, 2025 to 2035
      • Y to o to Y Growth Trend Analysis
      • Absolute $ Opportunity Analysis
  5. Global Market Pricing Analysis 2020 to 2024 and Forecast 2025 to 2035
  6. Global Market Analysis 2020 to 2024 and Forecast 2025 to 2035, By Type
    • Introduction / Key Findings
    • Historical Market Size Value (USD Million) Analysis By Type , 2020 to 2024
    • Current and Future Market Size Value (USD Million) Analysis and Forecast By Type , 2025 to 2035
      • ≤200L
      • >200L
    • Y to o to Y Growth Trend Analysis By Type , 2020 to 2024
    • Absolute $ Opportunity Analysis By Type , 2025 to 2035
  7. Global Market Analysis 2020 to 2024 and Forecast 2025 to 2035, By Application
    • Introduction / Key Findings
    • Historical Market Size Value (USD Million) Analysis By Application, 2020 to 2024
    • Current and Future Market Size Value (USD Million) Analysis and Forecast By Application, 2025 to 2035
      • Commercial
      • Industrial
    • Y to o to Y Growth Trend Analysis By Application, 2020 to 2024
    • Absolute $ Opportunity Analysis By Application, 2025 to 2035
  8. Global Market Analysis 2020 to 2024 and Forecast 2025 to 2035, By Region
    • Introduction
    • Historical Market Size Value (USD Million) Analysis By Region, 2020 to 2024
    • Current Market Size Value (USD Million) Analysis and Forecast By Region, 2025 to 2035
      • North America
      • Latin America
      • Western Europe
      • Eastern Europe
      • East Asia
      • South Asia and Pacific
      • Middle East & Africa
    • Market Attractiveness Analysis By Region
  9. North America Market Analysis 2020 to 2024 and Forecast 2025 to 2035, By Country
    • Historical Market Size Value (USD Million) Trend Analysis By Market Taxonomy, 2020 to 2024
    • Market Size Value (USD Million) Forecast By Market Taxonomy, 2025 to 2035
      • By Country
        • USA
        • Canada
        • Mexico
      • By Type
      • By Application
    • Market Attractiveness Analysis
      • By Country
      • By Type
      • By Application
    • Key Takeaways
  10. Latin America Market Analysis 2020 to 2024 and Forecast 2025 to 2035, By Country
    • Historical Market Size Value (USD Million) Trend Analysis By Market Taxonomy, 2020 to 2024
    • Market Size Value (USD Million) Forecast By Market Taxonomy, 2025 to 2035
      • By Country
        • Brazil
        • Chile
        • Rest of Latin America
      • By Type
      • By Application
    • Market Attractiveness Analysis
      • By Country
      • By Type
      • By Application
    • Key Takeaways
  11. Western Europe Market Analysis 2020 to 2024 and Forecast 2025 to 2035, By Country
    • Historical Market Size Value (USD Million) Trend Analysis By Market Taxonomy, 2020 to 2024
    • Market Size Value (USD Million) Forecast By Market Taxonomy, 2025 to 2035
      • By Country
        • Germany
        • UK
        • Italy
        • Spain
        • France
        • Nordic
        • BENELUX
        • Rest of Western Europe
      • By Type
      • By Application
    • Market Attractiveness Analysis
      • By Country
      • By Type
      • By Application
    • Key Takeaways
  12. Eastern Europe Market Analysis 2020 to 2024 and Forecast 2025 to 2035, By Country
    • Historical Market Size Value (USD Million) Trend Analysis By Market Taxonomy, 2020 to 2024
    • Market Size Value (USD Million) Forecast By Market Taxonomy, 2025 to 2035
      • By Country
        • Russia
        • Poland
        • Hungary
        • Balkan & Baltic
        • Rest of Eastern Europe
      • By Type
      • By Application
    • Market Attractiveness Analysis
      • By Country
      • By Type
      • By Application
    • Key Takeaways
  13. East Asia Market Analysis 2020 to 2024 and Forecast 2025 to 2035, By Country
    • Historical Market Size Value (USD Million) Trend Analysis By Market Taxonomy, 2020 to 2024
    • Market Size Value (USD Million) Forecast By Market Taxonomy, 2025 to 2035
      • By Country
        • China
        • Japan
        • South Korea
      • By Type
      • By Application
    • Market Attractiveness Analysis
      • By Country
      • By Type
      • By Application
    • Key Takeaways
  14. South Asia and Pacific Market Analysis 2020 to 2024 and Forecast 2025 to 2035, By Country
    • Historical Market Size Value (USD Million) Trend Analysis By Market Taxonomy, 2020 to 2024
    • Market Size Value (USD Million) Forecast By Market Taxonomy, 2025 to 2035
      • By Country
        • India
        • ASEAN
        • Australia & New Zealand
        • Rest of South Asia and Pacific
      • By Type
      • By Application
    • Market Attractiveness Analysis
      • By Country
      • By Type
      • By Application
    • Key Takeaways
  15. Middle East & Africa Market Analysis 2020 to 2024 and Forecast 2025 to 2035, By Country
    • Historical Market Size Value (USD Million) Trend Analysis By Market Taxonomy, 2020 to 2024
    • Market Size Value (USD Million) Forecast By Market Taxonomy, 2025 to 2035
      • By Country
        • Kingdom of Saudi Arabia
        • Other GCC Countries
        • Turkiye
        • South Africa
        • Other African Union
        • Rest of Middle East & Africa
      • By Type
      • By Application
    • Market Attractiveness Analysis
      • By Country
      • By Type
      • By Application
    • Key Takeaways
  16. Key Countries Market Analysis
    • USA
      • Pricing Analysis
      • Market Share Analysis, 2024
        • By Type
        • By Application
    • Canada
      • Pricing Analysis
      • Market Share Analysis, 2024
        • By Type
        • By Application
    • Mexico
      • Pricing Analysis
      • Market Share Analysis, 2024
        • By Type
        • By Application
    • Brazil
      • Pricing Analysis
      • Market Share Analysis, 2024
        • By Type
        • By Application
    • Chile
      • Pricing Analysis
      • Market Share Analysis, 2024
        • By Type
        • By Application
    • Germany
      • Pricing Analysis
      • Market Share Analysis, 2024
        • By Type
        • By Application
    • UK
      • Pricing Analysis
      • Market Share Analysis, 2024
        • By Type
        • By Application
    • Italy
      • Pricing Analysis
      • Market Share Analysis, 2024
        • By Type
        • By Application
    • Spain
      • Pricing Analysis
      • Market Share Analysis, 2024
        • By Type
        • By Application
    • France
      • Pricing Analysis
      • Market Share Analysis, 2024
        • By Type
        • By Application
    • India
      • Pricing Analysis
      • Market Share Analysis, 2024
        • By Type
        • By Application
    • ASEAN
      • Pricing Analysis
      • Market Share Analysis, 2024
        • By Type
        • By Application
    • Australia & New Zealand
      • Pricing Analysis
      • Market Share Analysis, 2024
        • By Type
        • By Application
    • China
      • Pricing Analysis
      • Market Share Analysis, 2024
        • By Type
        • By Application
    • Japan
      • Pricing Analysis
      • Market Share Analysis, 2024
        • By Type
        • By Application
    • South Korea
      • Pricing Analysis
      • Market Share Analysis, 2024
        • By Type
        • By Application
    • Russia
      • Pricing Analysis
      • Market Share Analysis, 2024
        • By Type
        • By Application
    • Poland
      • Pricing Analysis
      • Market Share Analysis, 2024
        • By Type
        • By Application
    • Hungary
      • Pricing Analysis
      • Market Share Analysis, 2024
        • By Type
        • By Application
    • Kingdom of Saudi Arabia
      • Pricing Analysis
      • Market Share Analysis, 2024
        • By Type
        • By Application
    • Turkiye
      • Pricing Analysis
      • Market Share Analysis, 2024
        • By Type
        • By Application
    • South Africa
      • Pricing Analysis
      • Market Share Analysis, 2024
        • By Type
        • By Application
  17. Market Structure Analysis
    • Competition Dashboard
    • Competition Benchmarking
    • Market Share Analysis of Top Players
      • By Regional
      • By Type
      • By Application
  18. Competition Analysis
    • Competition Deep Dive
      • Clack Corporation
        • Overview
        • Product Portfolio
        • Profitability by Market Segments (Product/Age /Sales Channel/Region)
        • Sales Footprint
        • Strategy Overview
          • Marketing Strategy
          • Product Strategy
          • Channel Strategy
      • Gilmore-Kramer Company
      • Pentair
      • M.I.P. NV
      • Applied Membranes INC.
      • Chemical Support Systems
      • Enduraplas
      • Snyder Industries
      • Performance Water Products
      • Hebei ChengDa HuaMo Technology Co.Ltd.
      • Canature Water Group
      • Nelsen Corp
      • Camion Systems etc.
  19. Assumptions & Acronyms Used
  20. Research Methodology

List of Tables

  • Table 1: Global Market Value (USD Million) Forecast by Region, 2020 to 2035
  • Table 2: Global Market Value (USD Million) Forecast by Type , 2020 to 2035
  • Table 3: Global Market Value (USD Million) Forecast by Application, 2020 to 2035
  • Table 4: North America Market Value (USD Million) Forecast by Country, 2020 to 2035
  • Table 5: North America Market Value (USD Million) Forecast by Type , 2020 to 2035
  • Table 6: North America Market Value (USD Million) Forecast by Application, 2020 to 2035
  • Table 7: Latin America Market Value (USD Million) Forecast by Country, 2020 to 2035
  • Table 8: Latin America Market Value (USD Million) Forecast by Type , 2020 to 2035
  • Table 9: Latin America Market Value (USD Million) Forecast by Application, 2020 to 2035
  • Table 10: Western Europe Market Value (USD Million) Forecast by Country, 2020 to 2035
  • Table 11: Western Europe Market Value (USD Million) Forecast by Type , 2020 to 2035
  • Table 12: Western Europe Market Value (USD Million) Forecast by Application, 2020 to 2035
  • Table 13: Eastern Europe Market Value (USD Million) Forecast by Country, 2020 to 2035
  • Table 14: Eastern Europe Market Value (USD Million) Forecast by Type , 2020 to 2035
  • Table 15: Eastern Europe Market Value (USD Million) Forecast by Application, 2020 to 2035
  • Table 16: East Asia Market Value (USD Million) Forecast by Country, 2020 to 2035
  • Table 17: East Asia Market Value (USD Million) Forecast by Type , 2020 to 2035
  • Table 18: East Asia Market Value (USD Million) Forecast by Application, 2020 to 2035
  • Table 19: South Asia and Pacific Market Value (USD Million) Forecast by Country, 2020 to 2035
  • Table 20: South Asia and Pacific Market Value (USD Million) Forecast by Type , 2020 to 2035
  • Table 21: South Asia and Pacific Market Value (USD Million) Forecast by Application, 2020 to 2035
  • Table 22: Middle East & Africa Market Value (USD Million) Forecast by Country, 2020 to 2035
  • Table 23: Middle East & Africa Market Value (USD Million) Forecast by Type , 2020 to 2035
  • Table 24: Middle East & Africa Market Value (USD Million) Forecast by Application, 2020 to 2035

List of Figures

  • Figure 1: Global Market Pricing Analysis
  • Figure 2: Global Market Value (USD Million) Forecast 2020-2035
  • Figure 3: Global Market Value Share and BPS Analysis by Type , 2025 and 2035
  • Figure 4: Global Market Y-o-Y Growth Comparison by Type , 2025-2035
  • Figure 5: Global Market Attractiveness Analysis by Type
  • Figure 6: Global Market Value Share and BPS Analysis by Application, 2025 and 2035
  • Figure 7: Global Market Y-o-Y Growth Comparison by Application, 2025-2035
  • Figure 8: Global Market Attractiveness Analysis by Application
  • Figure 9: Global Market Value (USD Million) Share and BPS Analysis by Region, 2025 and 2035
  • Figure 10: Global Market Y-o-Y Growth Comparison by Region, 2025-2035
  • Figure 11: Global Market Attractiveness Analysis by Region
  • Figure 12: North America Market Incremental Dollar Opportunity, 2025-2035
  • Figure 13: Latin America Market Incremental Dollar Opportunity, 2025-2035
  • Figure 14: Western Europe Market Incremental Dollar Opportunity, 2025-2035
  • Figure 15: Eastern Europe Market Incremental Dollar Opportunity, 2025-2035
  • Figure 16: East Asia Market Incremental Dollar Opportunity, 2025-2035
  • Figure 17: South Asia and Pacific Market Incremental Dollar Opportunity, 2025-2035
  • Figure 18: Middle East & Africa Market Incremental Dollar Opportunity, 2025-2035
  • Figure 19: North America Market Value Share and BPS Analysis by Country, 2025 and 2035
  • Figure 20: North America Market Value Share and BPS Analysis by Type , 2025 and 2035
  • Figure 21: North America Market Y-o-Y Growth Comparison by Type , 2025-2035
  • Figure 22: North America Market Attractiveness Analysis by Type
  • Figure 23: North America Market Value Share and BPS Analysis by Application, 2025 and 2035
  • Figure 24: North America Market Y-o-Y Growth Comparison by Application, 2025-2035
  • Figure 25: North America Market Attractiveness Analysis by Application
  • Figure 26: Latin America Market Value Share and BPS Analysis by Country, 2025 and 2035
  • Figure 27: Latin America Market Value Share and BPS Analysis by Type , 2025 and 2035
  • Figure 28: Latin America Market Y-o-Y Growth Comparison by Type , 2025-2035
  • Figure 29: Latin America Market Attractiveness Analysis by Type
  • Figure 30: Latin America Market Value Share and BPS Analysis by Application, 2025 and 2035
  • Figure 31: Latin America Market Y-o-Y Growth Comparison by Application, 2025-2035
  • Figure 32: Latin America Market Attractiveness Analysis by Application
  • Figure 33: Western Europe Market Value Share and BPS Analysis by Country, 2025 and 2035
  • Figure 34: Western Europe Market Value Share and BPS Analysis by Type , 2025 and 2035
  • Figure 35: Western Europe Market Y-o-Y Growth Comparison by Type , 2025-2035
  • Figure 36: Western Europe Market Attractiveness Analysis by Type
  • Figure 37: Western Europe Market Value Share and BPS Analysis by Application, 2025 and 2035
  • Figure 38: Western Europe Market Y-o-Y Growth Comparison by Application, 2025-2035
  • Figure 39: Western Europe Market Attractiveness Analysis by Application
  • Figure 40: Eastern Europe Market Value Share and BPS Analysis by Country, 2025 and 2035
  • Figure 41: Eastern Europe Market Value Share and BPS Analysis by Type , 2025 and 2035
  • Figure 42: Eastern Europe Market Y-o-Y Growth Comparison by Type , 2025-2035
  • Figure 43: Eastern Europe Market Attractiveness Analysis by Type
  • Figure 44: Eastern Europe Market Value Share and BPS Analysis by Application, 2025 and 2035
  • Figure 45: Eastern Europe Market Y-o-Y Growth Comparison by Application, 2025-2035
  • Figure 46: Eastern Europe Market Attractiveness Analysis by Application
  • Figure 47: East Asia Market Value Share and BPS Analysis by Country, 2025 and 2035
  • Figure 48: East Asia Market Value Share and BPS Analysis by Type , 2025 and 2035
  • Figure 49: East Asia Market Y-o-Y Growth Comparison by Type , 2025-2035
  • Figure 50: East Asia Market Attractiveness Analysis by Type
  • Figure 51: East Asia Market Value Share and BPS Analysis by Application, 2025 and 2035
  • Figure 52: East Asia Market Y-o-Y Growth Comparison by Application, 2025-2035
  • Figure 53: East Asia Market Attractiveness Analysis by Application
  • Figure 54: South Asia and Pacific Market Value Share and BPS Analysis by Country, 2025 and 2035
  • Figure 55: South Asia and Pacific Market Value Share and BPS Analysis by Type , 2025 and 2035
  • Figure 56: South Asia and Pacific Market Y-o-Y Growth Comparison by Type , 2025-2035
  • Figure 57: South Asia and Pacific Market Attractiveness Analysis by Type
  • Figure 58: South Asia and Pacific Market Value Share and BPS Analysis by Application, 2025 and 2035
  • Figure 59: South Asia and Pacific Market Y-o-Y Growth Comparison by Application, 2025-2035
  • Figure 60: South Asia and Pacific Market Attractiveness Analysis by Application
  • Figure 61: Middle East & Africa Market Value Share and BPS Analysis by Country, 2025 and 2035
  • Figure 62: Middle East & Africa Market Value Share and BPS Analysis by Type , 2025 and 2035
  • Figure 63: Middle East & Africa Market Y-o-Y Growth Comparison by Type , 2025-2035
  • Figure 64: Middle East & Africa Market Attractiveness Analysis by Type
  • Figure 65: Middle East & Africa Market Value Share and BPS Analysis by Application, 2025 and 2035
  • Figure 66: Middle East & Africa Market Y-o-Y Growth Comparison by Application, 2025-2035
  • Figure 67: Middle East & Africa Market Attractiveness Analysis by Application
  • Figure 68: Global Market - Tier Structure Analysis
  • Figure 69: Global Market - Company Share Analysis
Dashboard
Dashboard
Dashboard
Dashboard
Dashboard
Dashboard

Our Research Products

Full Research Suite

The "Full Research Suite" delivers actionable market intel, deep dives on markets or technologies, so clients act faster, cut risk, and unlock growth.

Competitor Leaderboard Report

The Leaderboard benchmarks and ranks top vendors, classifying them as Established Leaders, Leading Challengers, or Disruptors & Challengers.

Future Leaders Index

Locates where complements amplify value and substitutes erode it, forecasting net impact by horizon

Market Data & Forecasts

We deliver granular, decision-grade intel: market sizing, 5-year forecasts, pricing, adoption, usage, revenue, and operational KPIs—plus competitor tracking, regulation, and value chains—across 60 countries broadly.

Market Focus Report

Spot the shifts before they hit your P&L. We track inflection points, adoption curves, pricing moves, and ecosystem plays to show where demand is heading, why it is changing, and what to do next across high-growth markets and disruptive tech

Survey Report

Real-time reads of user behavior. We track shifting priorities, perceptions of today’s and next-gen services, and provider experience, then pace how fast tech moves from trial to adoption, blending buyer, consumer, and channel inputs with social signals (#WhySwitch, #UX).

Bespoke Reports

Partner with our analyst team to build a custom report designed around your business priorities. From analysing market trends to assessing competitors or crafting bespoke datasets, we tailor insights to your needs.

Supplier Intelligence

Discovery & Profiling

Capacity & Footprint

Performance & Risk

Compliance & Governance

Commercial Readiness

Who Supplies Whom

Scorecards & Shortlists

Playbooks & Docs

Category Intelligence

Definition & Scope

Demand & Use Cases

Cost Drivers

Market Structure

Supply Chain Map

Trade & Policy

Operating Norms

Deliverables

Buyer Intelligence

Account Basics

Spend & Scope

Procurement Model

Vendor Requirements

Terms & Policies

Entry Strategy

Pain Points & Triggers

Outputs

Pricing Analysis

Benchmarks

Trends

Should-Cost

Indexation

Landed Cost

Commercial Terms

Deliverables

Brand Analysis

Positioning & Value Prop

Share & Presence

Customer Evidence

Go-to-Market

Digital & Reputation

Compliance & Trust

KPIs & Gaps

Outputs

Full Research Suite comprises of:

Market outlook & trends analysis

Market outlook & trends analysis

Interviews & case studies

Interviews & case studies

Strategic recommendations

Strategic recommendations

Vendor profiles & capabilities analysis

Vendor profiles & capabilities analysis

5-year forecasts

5-year forecasts

8 regions and 60+ country-level data splits

8 regions and 60+ country-level data splits

Market segment data splits

Market segment data splits

12 months of continuous data updates

12 months of continuous data updates

DELIVERED AS:

PDF EXCEL ONLINE

Full Research Suite


$5000

$7500

$10000

Buy Report Now
Similar Industry Reports

Similar Industry Reports

Brine Freezing Market

Brine Freezing Market Size and Share Forecast Outlook 2025 to 2035

Brined Vegetable Market

Brined Vegetable Market Analysis by Nature, Type, End-use, Distribution Channel and Region through 2035

Clear Brine Fluids Market

Clear Brine Fluids Market

Formate Brines Market

Formate Brines Market

Lithium Extraction From Brine Technology Market

Lithium Extraction From Brine Technology Market Size and Share Forecast Outlook 2025 to 2035

Tanker Truck Market
Tanker Truck Market

Tanker Truck Market Size and Share Forecast Outlook 2025 to 2035

Tank Insulation Market

Tank Insulation Market Growth – Trends & Forecast 2024-2034

LNG Tank Containers Market

LNG Tank Containers Market Size and Share Forecast Outlook 2025 to 2035

CNG Tanks Cylinders Market

CNG Tanks Cylinders Market Growth - Trends & Forecast 2025 to 2035

ISO Tank Container Market

ISO Tank Container Market Growth – Trends & Forecast 2024-2034

CIP Tank Market
CIP Tank Market

CIP Tank Market Growth – Trends & Forecast 2024-2034

Ink Tank Printer Market

Ink Tank Printer Market

Rail Tank Cars Market

Rail Tank Cars Market Size and Share Forecast Outlook 2025 to 2035

Milk Tank Cooling System Market

Milk Tank Cooling System Market Growth – Trends & Forecast 2025 to 2035

Fish Tank Water Additives Market

Fish Tank Water Additives Market Trends - Growth & Demand Forecast 2025 to 2035

Stock Tank Market
Stock Tank Market

Stock Tank Market Size and Share Forecast Outlook 2025 to 2035

Surge Tanks Market
Surge Tanks Market

Surge Tanks Market Growth - Trends & Forecast 2025 to 2035

Water Tanker Truck Market

Water Tanker Truck Market Size and Share Forecast Outlook 2025 to 2035

Shrink Tanks Market
Shrink Tanks Market

Shrink Tanks Market

Storage Tank Equipment Market

Storage Tank Equipment Market Size and Share Forecast Outlook 2025 to 2035

Future Market Insights

Brine Tank for Water Softener Market

Chat With MaRIA

Chat With

MaRIA

Hi There, I am MaRIA, Your Market Research Intelligence Assistant. How may I help you?