Water Vapor Permeability Analyzers Market Forecast and Outlook 2025 to 2035

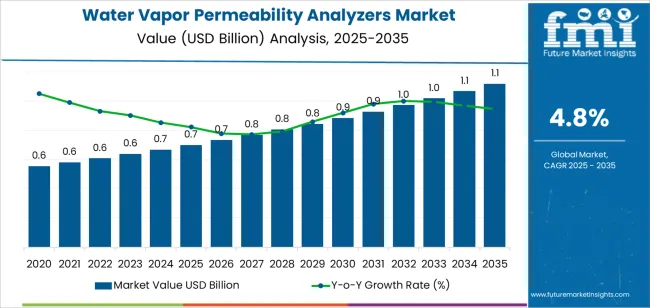
The global water vapor permeability analyzers market is expected to grow from USD 0.7 billion in 2025 to approximately USD 1.1 billion by 2035, recording an absolute increase of USD 0.4 billion over the forecast period. This translates into a total growth of 59.8%, with the market forecast to expand at a CAGR of 4.8% between 2025 and 2035.

The market size is expected to grow by nearly 1.60 times during the same period, supported by increasing global demand for barrier property testing equipment in pharmaceutical packaging operations, growing adoption of moisture transmission measurement technologies in food packaging quality control, and rising material performance standards driving specialized testing instrument procurement across various industrial barrier testing applications.

The market expansion reflects fundamental shifts in packaging material qualification requirements and product protection protocols. Food and beverage manufacturers are implementing comprehensive barrier testing programs to ensure consistent packaging performance across shelf-stable product operations, particularly for sensitive food items and premium beverage packaging serving retail distribution networks. Pharmaceutical companies require precise moisture permeability measurement systems to optimize blister packaging selection in drug product development and stability program validation. Textile manufacturers are investing in permeability testing technologies to support technical fabric characterization programs and performance textile development.

Quick Stats for Water Vapor Permeability Analyzers Market

Metric Value
Water Vapor Permeability Analyzers Market Value (2025) USD 0.7 billion
Water Vapor Permeability Analyzers Market Forecast Value (2035) USD 1.1 billion
Water Vapor Permeability Analyzers Market CAGR 4.8%
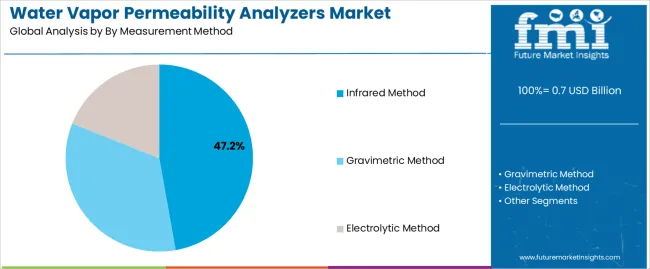
Leading Segment by Measurement Method (2025) Infrared Method (47.2%)
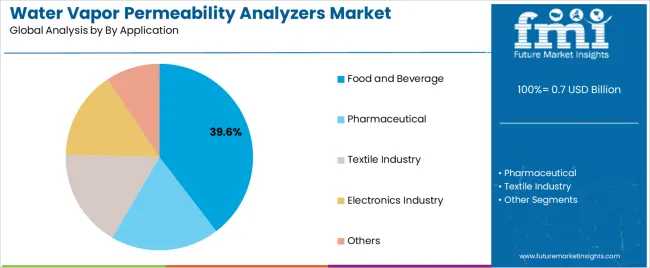
Leading Segment by Application (2025) Food and Beverage (39.6%)
Key Growth Regions Asia Pacific, Europe, and North America
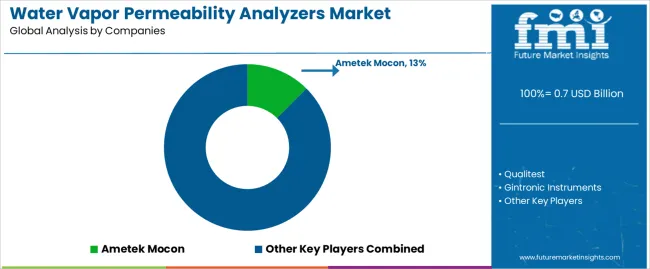
Top Companies by Market Share Ametek Mocon, Qualitest, Gintronic Instruments

Water Vapor Permeability Analyzers Market Market Value Analysis

Regional dynamics demonstrate concentrated growth in established manufacturing economies with mature packaging infrastructure and expanding pharmaceutical production sectors. Asian markets, led by China and India, are experiencing accelerated adoption driven by packaging material manufacturing expansion and pharmaceutical quality control enhancement programs. European markets maintain steady growth supported by stringent packaging performance standards and continuous testing methodology improvement initiatives in regulated industries. North American operations focus on pharmaceutical packaging validation and testing procedure standardization across quality control workflows.

Technology adoption patterns reflect the transition from manual cup method procedures to automated permeability analyzers capable of rapid testing cycles and enhanced measurement precision. Testing equipment manufacturers are developing integrated platforms that combine multiple measurement methodologies with digital data management systems, addressing manufacturer requirements for operational efficiency and regulatory compliance documentation. The market faces ongoing challenges related to measurement standardization across testing methods, equipment calibration maintenance requirements, and cost justification for small-scale packaging operations with limited testing volumes.

Water Vapor Permeability Analyzers Market Key Takeaways

Metric Value
Market Value (2025) USD 0.7 billion
Market Forecast Value (2035) USD 1.1 billion
Forecast CAGR (2025-2035) 4.8%

Why is the Water Vapor Permeability Analyzers Market Growing?

PACKAGING QUALITY STANDARDS REGULATORY COMPLIANCE TECHNOLOGICAL ADVANCEMENT
Product Shelf Life Requirements

Expanding packaging performance specifications and moisture barrier requirements driving demand for precise permeability testing equipment across food packaging and pharmaceutical container qualification programs.

Material Development Testing

Growing focus on advanced packaging material characterization and barrier property optimization creating demand for analytical instruments supporting research and quality control operations.

Quality Assurance Integration

Manufacturing quality systems and incoming material inspection protocols requiring validated testing equipment with comprehensive documentation capabilities.
Pharmaceutical Packaging Standards

Stringent regulatory requirements for pharmaceutical container closure systems favoring validated testing methodologies with proven measurement accuracy and traceability.

Food Safety Regulations

Food contact material standards and packaging performance verification mandates necessitating barrier property testing with documented measurement procedures.

International Standard Compliance

ISO and ASTM testing method specifications driving investment in standardized testing equipment with certified performance capabilities.
Automated Testing Systems

Development of automated measurement platforms reducing manual intervention and enabling high-throughput testing with enhanced reproducibility and operational efficiency.

Multi-Methodology Platforms

Integration of multiple testing methods in unified instruments supporting diverse material testing requirements and comparative measurement capabilities.

Digital Data Management

Laboratory information system connectivity and automated result documentation enabling enhanced compliance tracking and real-time quality monitoring.

Water Vapor Permeability Analyzers Market Segmentation

Category Segments Covered
By Measurement Method Infrared Method, Gravimetric Method, Electrolytic Method
By Application Food and Beverage, Pharmaceutical, Textile Industry, Electronics Industry, Others
By Region North America, Europe, Asia Pacific, Latin America, Middle East & Africa

Water Vapor Permeability Analyzers Market Analysis by Measurement Method

Water Vapor Permeability Analyzers Market Analysis By By Measurement Method

Segment 2025 to 2035 Outlook
Infrared Method Leader in 2025 with 47.2% market share projected to maintain dominance through 2035. Established measurement protocol with rapid testing cycles and minimal sample preparation requirements. Non-destructive testing capability providing real-time moisture transmission monitoring across diverse packaging materials. Momentum: steady growth driven by pharmaceutical packaging testing expansion and food industry quality control applications requiring fast turnaround results. Watchouts: higher equipment costs compared to traditional methods and calibration maintenance requirements affecting long-term operational expenses.
Gravimetric Method Traditional segment with 31.4% market share maintaining relevance through standardized testing protocols and regulatory acceptance. Proven measurement methodology with established correlation to product stability and extensive historical performance data. Adoption concentrated in pharmaceutical laboratories and material research facilities requiring validated reference methods. Momentum: moderate growth through regulatory compliance applications and research institution utilization. Watchouts: extended testing duration limiting throughput capacity and manual procedure complexity affecting operational efficiency in high-volume testing environments.
Electrolytic Method Specialized segment with 21.4% market share benefiting from ultra-low permeability measurement requirements and precision testing applications. Superior sensitivity for high-barrier materials and controlled atmosphere packaging requiring detection of minimal moisture transmission rates. Growing adoption in pharmaceutical packaging qualification and advanced barrier film development. Momentum: rising through pharmaceutical container testing and specialty packaging material characterization. Watchouts: limited material compatibility and specialized maintenance requirements affecting operational flexibility across diverse testing programs.

Water Vapor Permeability Analyzers Market Analysis by Application

Water Vapor Permeability Analyzers Market Analysis By By Application

Segment 2025 to 2035 Outlook
Food and Beverage Dominant segment at 39.6% market share in 2025 with established packaging quality control infrastructure and comprehensive barrier testing operations. Critical for flexible packaging qualification and shelf-stable product development requiring consistent moisture protection. Mature testing protocols with standardized procedures and material specification requirements. Momentum: steady growth driven by packaged food expansion and premium beverage packaging development. Watchouts: cost sensitivity in commodity food packaging and testing throughput requirements in high-volume manufacturing operations affecting equipment utilization patterns.
Pharmaceutical Expanding segment with 28.7% market share driven by blister packaging qualification and stability program validation requirements. Essential for primary packaging material selection and regulatory submission documentation requiring validated testing methodologies. Adoption concentrated in pharmaceutical companies and contract packaging organizations. Momentum: strong growth through pharmaceutical manufacturing expansion and regulatory compliance enhancement. Watchouts: stringent equipment qualification requirements and method validation complexity affecting procurement timelines and operational implementation in GMP environments.
Textile Industry Established segment at 16.3% share focused on technical fabric characterization and performance textile development requiring breathability assessment. Diverse applications across protective clothing, sportswear, and functional textiles requiring moisture vapor transmission measurement. Investment driven by technical textile innovation and performance standard development. Momentum: moderate growth through technical textile market expansion and athletic apparel development. Watchouts: testing procedure variation across textile categories and material thickness challenges affecting measurement standardization across diverse fabric constructions.
Electronics Industry Specialized segment with 9.8% market share serving electronic component packaging and display barrier film qualification. Premium applications requiring ultra-low permeability measurement and accelerated testing capabilities. High-precision requirements supporting investment in advanced testing technologies. Momentum: steady growth through flexible electronics development and OLED display production. Watchouts: extremely low permeability detection requirements and environmental control complexity necessitating specialized testing conditions and equipment capabilities.
Others Residual segment with 5.6% market share encompassing diverse applications including medical device packaging, agricultural film testing, and building material characterization. Small volume with specialized testing requirements and limited standardized procedures. Adoption concentrated in niche material applications and research facilities. Momentum: flat to modest growth with application-specific requirements. Watchouts: limited equipment optimization for specialized applications and small market size constraining manufacturer development investment.

DRIVERS

DRIVERS RESTRAINTS KEY TRENDS
Pharmaceutical Regulatory Requirements

Expanding pharmaceutical packaging validation and container closure system testing requirements driving investment in validated permeability measurement equipment for regulatory compliance.

Packaging Material Innovation

Growing development of advanced barrier materials and multilayer packaging structures creating demand for precise characterization equipment supporting material qualification programs.

Quality Control Standardization

Manufacturing quality system enhancement and incoming material testing protocols requiring standardized measurement equipment with documented performance capabilities.
High Equipment Costs

Significant capital investment requirements and maintenance expenses limiting adoption in small-scale packaging operations and research facilities with limited budgets.

Testing Duration Limitations

Extended measurement times for traditional methods affecting throughput capacity in high-volume quality control operations requiring rapid material qualification.

Method Standardization Challenges

Variations across different testing methodologies and correlation complexity affecting measurement comparability and material specification development.
Automated Sample Handling

Integration of robotic sample loading and automated testing sequences reducing manual intervention and enabling high-throughput laboratory operations.

Multi-Chamber Systems

Development of parallel testing configurations enabling simultaneous measurement of multiple samples improving laboratory productivity and operational efficiency.

Environmental Control Integration

Advanced temperature and humidity regulation systems ensuring precise testing conditions and enabling accelerated aging simulation in permeability assessment.

Analysis of Water Vapor Permeability Analyzers Market by Key Countries

Water Vapor Permeability Analyzers Market Cagr Analysis By Country

Country CAGR (2025-2035)
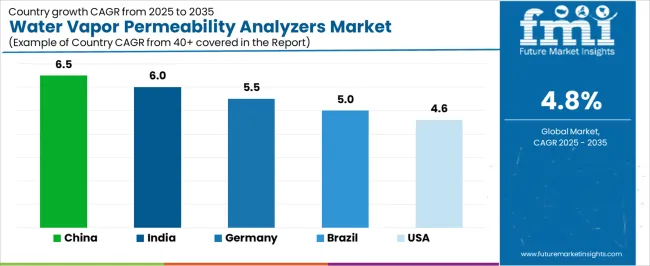
China 6.5%
India 6.0%
Germany 5.5%
Brazil 5.0%
United States 4.6%

China Leads Market Growth with Packaging Industry Expansion

Water Vapor Permeability Analyzers Market Country Value Analysis

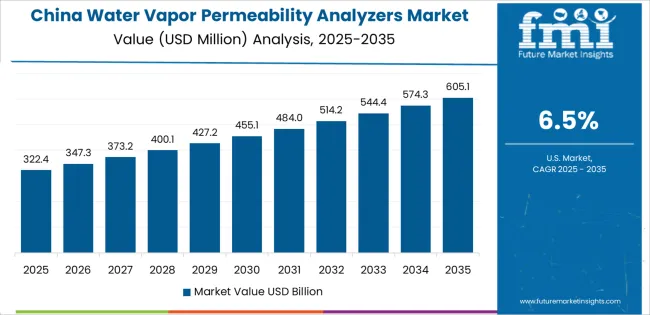
China is projected to exhibit strong growth with a market value of USD 231.1 million by 2035, driven by expanding pharmaceutical packaging manufacturing and comprehensive food packaging material production creating substantial opportunities for testing equipment suppliers across quality control operations, material research facilities, and packaging converter operations. The country's massive packaging industry infrastructure and expanding quality testing capabilities are creating significant demand for permeability testing systems supporting operational efficiency and product quality standards. Major pharmaceutical companies and packaging material manufacturers are establishing comprehensive testing laboratories to support large-scale production operations and meet growing domestic regulatory requirements.

  • Pharmaceutical packaging manufacturing expansion programs are supporting widespread adoption of permeability analyzers across container qualification operations, driving demand for testing systems with validated measurement capabilities in blister packaging assessment
  • Food packaging material production development and flexible packaging manufacturing programs are creating substantial opportunities for testing equipment suppliers requiring proven performance characteristics and cost-effective operational parameters
  • Technical textile manufacturing infrastructure development and barrier film production capacity expansion programs are facilitating permeability analyzer adoption throughout major industrial manufacturing regions

India Demonstrates Strong Growth Potential with Pharmaceutical Development

India is expanding to reach USD 223.3 million by 2035, supported by extensive pharmaceutical manufacturing capacity expansion and comprehensive packaging material production development creating steady demand for testing technologies across diverse industrial operations and quality control segments. The country's growing pharmaceutical contract manufacturing infrastructure and expanding packaging industry awareness are driving demand for permeability analyzers that provide consistent measurement performance while supporting cost-effective operational requirements. Equipment suppliers and manufacturers are investing in local service infrastructure to support growing testing requirements and technology adoption.

  • Pharmaceutical manufacturing expansion programs and generic drug production facility development initiatives are creating opportunities for testing technologies across diverse segments requiring validated performance and competitive operational costs
  • Food packaging industry programs and flexible packaging manufacturing capability enhancement initiatives are driving investments in permeability testing systems supporting quality requirements throughout major production facilities
  • Textile manufacturing development and technical fabric production capacity expansion programs are enhancing demand for specialized permeability analyzers throughout industrial operations

Germany Maintains Leadership with Testing Technology Excellence

Germany is projected to reach USD 35.6 million by 2035, supported by the country's leadership in pharmaceutical quality control and advanced packaging material development requiring sophisticated testing systems for barrier property characterization and material qualification applications. German manufacturers implement high-quality testing programs that support advanced measurement specifications, operational reliability, and comprehensive quality documentation. The market is characterized by focus on measurement precision, method validation standards, and compliance with stringent pharmaceutical and packaging industry regulations.

  • Pharmaceutical industry investments are prioritizing advanced testing technologies that demonstrate superior measurement accuracy and reproducibility while meeting German GMP standards and international regulatory requirements
  • Packaging material development excellence programs and barrier property optimization initiatives are driving adoption of permeability analyzers that support efficient testing workflows and quality assurance protocols
  • Technical textile advancement and functional material research programs are facilitating adoption of specialized testing capabilities throughout major research centers and manufacturing facilities

Brazil Expands Market with Pharmaceutical Manufacturing Growth

Brazil is growing to reach USD 34.5 million by 2035, driven by pharmaceutical manufacturing expansion and food packaging development creating constant opportunities for testing equipment suppliers serving both multinational pharmaceutical operations and domestic packaging material producers. The country's expanding pharmaceutical contract manufacturing sector and growing food processing capabilities are creating demand for testing technologies that support diverse barrier measurement requirements while maintaining performance standards. Manufacturers and quality control organizations are developing procurement strategies to support testing capability enhancement and regulatory compliance program implementation.

  • Pharmaceutical manufacturing programs and generic drug production expansion initiatives are facilitating permeability analyzer adoption capable of supporting container closure testing requirements and competitive performance specifications
  • Food packaging development and material qualification capability programs are enhancing demand for testing systems that support operational efficiency and quality reliability
  • Medical device packaging modernization and barrier material development programs are creating opportunities for advanced permeability testing technologies across Brazilian manufacturing facilities

United States Focuses on Pharmaceutical Packaging Validation

The United States is projected to reach USD 60.2 million by 2035, expanding at a CAGR of 4.6%, driven by pharmaceutical packaging validation and food packaging quality control supporting comprehensive testing programs and advanced measurement capabilities. The country's extensive pharmaceutical manufacturing infrastructure and established packaging industry capabilities are creating demand for permeability analyzers that support operational efficiency and regulatory compliance standards. Testing equipment manufacturers and suppliers are maintaining comprehensive validation support capabilities to serve diverse quality control requirements.

  • Pharmaceutical manufacturing advancement and packaging qualification enhancement initiatives are supporting demand for testing technologies that meet contemporary regulatory performance and validation standards
  • Food packaging sector development and barrier property verification programs are creating opportunities for specialized testing systems that provide comprehensive moisture transmission measurement capabilities
  • Technical textile manufacturing and electronic component packaging programs are facilitating adoption of advanced permeability analyzer platforms throughout major quality control laboratories

What is the market split by country in Europe?

The water vapor permeability analyzers market in Europe is projected to grow from USD 162.2 million in 2025 to USD 259.4 million by 2035, registering a CAGR of 4.8% over the forecast period. Germany is expected to maintain its leadership position with a 34.2% market share in 2025, declining slightly to 33.6% by 2035, supported by its advanced pharmaceutical manufacturing infrastructure and comprehensive packaging material testing facilities concentrated in North Rhine-Westphalia and Bavaria regions.

The United Kingdom follows with a 23.8% share in 2025, projected to reach 24.3% by 2035, driven by comprehensive pharmaceutical quality control operations and packaging material research facilities. France holds a 18.6% share in 2025, expected to maintain 18.4% by 2035 with food packaging and pharmaceutical testing applications. Italy commands a 13.9% share, while Spain accounts for 6.7% in 2025. The Rest of Europe region is anticipated to gain momentum, expanding its collective share from 2.8% to 3.4% by 2035, attributed to increasing permeability testing adoption in Nordic countries and emerging Eastern European pharmaceutical manufacturing operations implementing quality control standardization programs.

Precision Standards Define Japanese Quality Control Operations

Water Vapor Permeability Analyzers Market Japan Market Share Analysis By By Measurement Method

Japanese water vapor permeability analyzers operations reflect the country's exacting pharmaceutical quality standards and comprehensive packaging material testing protocols. Major pharmaceutical companies including Takeda and Daiichi Sankyo require rigorous equipment qualification procedures that exceed international standards, driving demand for permeability testing systems with validated measurement specifications. Organizations maintain comprehensive testing protocols and equipment calibration procedures supporting consistent quality control across pharmaceutical manufacturing operations.

The packaging material development sector demonstrates particular strength in applying advanced permeability testing to barrier film innovation, with companies implementing sophisticated measurement operations for high-barrier material characterization. Regulatory oversight through the Pharmaceuticals and Medical Devices Agency emphasizes comprehensive method validation and testing documentation that favors established equipment manufacturers with proven permeability measurement technologies.
Advanced Manufacturing Drives South Korean Adoption

Water Vapor Permeability Analyzers Market South Korea Market Share Analysis By By Application

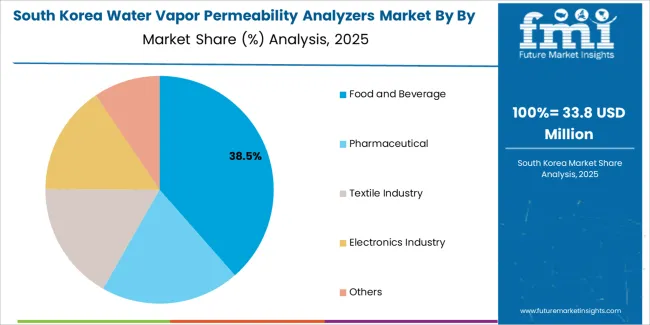
South Korean water vapor permeability analyzers operations reflect the country's pharmaceutical manufacturing development and comprehensive packaging material production capabilities. Major pharmaceutical companies including Celltrion and Samsung Biologics implement sophisticated testing procurement strategies supporting both drug product packaging qualification and quality control operations targeting international regulatory standards. Organizations are investing in advanced permeability analyzer systems to enhance operational efficiency while meeting global pharmaceutical and packaging specifications.

The electronics packaging sector drives demand for ultra-low permeability testing systems capable of supporting OLED display barrier film qualification and flexible electronics packaging development. Korean manufacturers prioritize equipment suppliers with comprehensive technical support capabilities and established calibration service systems supporting consistent measurement performance across high-precision quality control operations.

What defines the competitive landscape of the water vapor permeability analyzers market?

Market dynamics favor established testing equipment manufacturers with proven permeability measurement expertise and comprehensive pharmaceutical industry relationships supporting packaging qualification and quality control operations. Value concentration occurs around validated testing systems capable of delivering precise measurement accuracy with regulatory acceptance, creating barriers for new entrants lacking pharmaceutical certification credentials and method validation documentation. Several competitive archetypes dominate market positioning: global analytical instrument companies leveraging broad testing equipment portfolios and established pharmaceutical relationships across packaging and material testing segments; specialized permeability analyzer manufacturers offering focused measurement solutions with advanced performance characteristics in barrier property testing; regional testing equipment suppliers providing localized technical support and cost-competitive solutions for emerging market quality control operations; and innovative measurement technology developers creating next-generation testing platforms with enhanced automation capabilities.

Switching costs remain elevated due to equipment qualification requirements, method validation procedures, and established testing protocols that favor incumbent suppliers in conservative pharmaceutical industries. Technology transitions toward automated testing systems and multi-methodology platforms create opportunities for suppliers offering operational efficiency advantages and testing throughput benefits, while pharmaceutical regulatory requirements and method validation complexity slow adoption in risk-averse quality control environments. Consolidation pressure increases as larger analytical instrument companies acquire specialized permeability testing manufacturers to expand material characterization capabilities and strengthen pharmaceutical industry market positions.

Strategic positioning requires comprehensive method validation support and proven measurement accuracy across diverse packaging materials, particularly for pharmaceutical container closure testing and high-barrier material qualification programs. Technical support capabilities and application expertise services become critical differentiation factors as laboratories prioritize measurement reliability and regulatory compliance in critical quality control operations. Market share stability depends on maintaining pharmaceutical industry acceptance and regulatory method recognition while adapting permeability testing technologies to emerging automation requirements and high-throughput testing demands without disrupting established quality control workflows or requiring extensive revalidation investments.
Key Players in the Water Vapor Permeability Analyzers Market

Water Vapor Permeability Analyzers Market Analysis By Company

  • Ametek Mocon
  • Qualitest
  • Gintronic Instruments
  • TESTEX
  • TOYOSEIKI
  • Techlab Systems
  • Testron Group
  • Industrial Physics (Systech)
  • Poretech
  • Hexa Plast
  • IDM Instruments
  • Jinan Labthink Instruments
  • Paratronix Instruments
  • Jinan Saicheng Electronic Technology
  • Shandong Drick Instruments
  • Hefei Fanyuan Instrument
  • Guangzhou Biaoji Packaging Equipment
  • GESTER International
  • Guangzhou Labstone
  • Jinan Pubtester Instruments
  • Guangzhou Shounuo Scientific Instrument
  • Shandong Qktester
  • Jinan SYSTESTER Instruments
  • Suzhou Atomic Instruments

Scope of the Report

Items Values
Quantitative Units USD 0.7 billion
Measurement Method Infrared Method, Gravimetric Method, Electrolytic Method
Application Food and Beverage, Pharmaceutical, Textile Industry, Electronics Industry, Others
Regions Covered North America, Latin America, Europe, Asia Pacific, Middle East & Africa
Country Covered United States, Germany, China, India, Brazil, and other 40+ countries
Key Companies Profiled Ametek Mocon, Qualitest, Gintronic Instruments, TESTEX, TOYOSEIKI, Techlab Systems, Testron Group, Industrial Physics (Systech), Poretech, Hexa Plast, IDM Instruments, Jinan Labthink Instruments, Paratronix Instruments, Jinan Saicheng Electronic Technology, Shandong Drick Instruments, Hefei Fanyuan Instrument, Guangzhou Biaoji Packaging Equipment, GESTER International, Guangzhou Labstone, Jinan Pubtester Instruments, Guangzhou Shounuo Scientific Instrument, Shandong Qktester, Jinan SYSTESTER Instruments, Suzhou Atomic Instruments
Additional Attributes Dollar sales by measurement method and application, regional demand across NA, EU, APAC, competitive landscape, pharmaceutical quality control adoption patterns, packaging material testing integration, and measurement methodology optimization initiatives driving barrier property characterization, operational efficiency, and regulatory compliance standards

Water Vapor Permeability Analyzers Market Segmentation

By Measurement Method

  • Infrared Method
  • Gravimetric Method
  • Electrolytic Method

By Application

  • Food and Beverage
  • Pharmaceutical
  • Textile Industry
  • Electronics Industry
  • Others

By Region

  • North America
  • Europe
  • Asia Pacific
  • Latin America
  • Middle East & Africa

Frequently Asked Questions

How big is the water vapor permeability analyzers market in 2025?

The global water vapor permeability analyzers market is estimated to be valued at USD 0.7 billion in 2025.

What will be the size of water vapor permeability analyzers market in 2035?

The market size for the water vapor permeability analyzers market is projected to reach USD 1.1 billion by 2035.

How much will be the water vapor permeability analyzers market growth between 2025 and 2035?

The water vapor permeability analyzers market is expected to grow at a 4.8% CAGR between 2025 and 2035.

What are the key product types in the water vapor permeability analyzers market?

The key product types in water vapor permeability analyzers market are infrared method, gravimetric method and electrolytic method.

Which by application segment to contribute significant share in the water vapor permeability analyzers market in 2025?

In terms of by application, food and beverage segment to command 39.6% share in the water vapor permeability analyzers market in 2025.

Table of Content

  1. Executive Summary
    • Global Market Outlook
    • Demand to side Trends
    • Supply to side Trends
    • Technology Roadmap Analysis
    • Analysis and Recommendations
  2. Market Overview
    • Market Coverage / Taxonomy
    • Market Definition / Scope / Limitations
  3. Market Background
    • Market Dynamics
      • Drivers
      • Restraints
      • Opportunity
      • Trends
    • Scenario Forecast
      • Demand in Optimistic Scenario
      • Demand in Likely Scenario
      • Demand in Conservative Scenario
    • Opportunity Map Analysis
    • Product Life Cycle Analysis
    • Supply Chain Analysis
    • Investment Feasibility Matrix
    • Value Chain Analysis
    • PESTLE and Porter’s Analysis
    • Regulatory Landscape
    • Regional Parent Market Outlook
    • Production and Consumption Statistics
    • Import and Export Statistics
  4. Global Market Analysis 2020 to 2024 and Forecast, 2025 to 2035
    • Historical Market Size Value (USD Million) Analysis, 2020 to 2024
    • Current and Future Market Size Value (USD Million) Projections, 2025 to 2035
      • Y to o to Y Growth Trend Analysis
      • Absolute $ Opportunity Analysis
  5. Global Market Pricing Analysis 2020 to 2024 and Forecast 2025 to 2035
  6. Global Market Analysis 2020 to 2024 and Forecast 2025 to 2035, By By Measurement Method
    • Introduction / Key Findings
    • Historical Market Size Value (USD Million) Analysis By By Measurement Method , 2020 to 2024
    • Current and Future Market Size Value (USD Million) Analysis and Forecast By By Measurement Method , 2025 to 2035
      • Infrared Method
      • Gravimetric Method
      • Electrolytic Method
    • Y to o to Y Growth Trend Analysis By By Measurement Method , 2020 to 2024
    • Absolute $ Opportunity Analysis By By Measurement Method , 2025 to 2035
  7. Global Market Analysis 2020 to 2024 and Forecast 2025 to 2035, By By Application
    • Introduction / Key Findings
    • Historical Market Size Value (USD Million) Analysis By By Application, 2020 to 2024
    • Current and Future Market Size Value (USD Million) Analysis and Forecast By By Application, 2025 to 2035
      • Food and Beverage
      • Pharmaceutical
      • Textile Industry
      • Electronics Industry
      • Others
    • Y to o to Y Growth Trend Analysis By By Application, 2020 to 2024
    • Absolute $ Opportunity Analysis By By Application, 2025 to 2035
  8. Global Market Analysis 2020 to 2024 and Forecast 2025 to 2035, By Region
    • Introduction
    • Historical Market Size Value (USD Million) Analysis By Region, 2020 to 2024
    • Current Market Size Value (USD Million) Analysis and Forecast By Region, 2025 to 2035
      • North America
      • Latin America
      • Western Europe
      • Eastern Europe
      • East Asia
      • South Asia and Pacific
      • Middle East & Africa
    • Market Attractiveness Analysis By Region
  9. North America Market Analysis 2020 to 2024 and Forecast 2025 to 2035, By Country
    • Historical Market Size Value (USD Million) Trend Analysis By Market Taxonomy, 2020 to 2024
    • Market Size Value (USD Million) Forecast By Market Taxonomy, 2025 to 2035
      • By Country
        • USA
        • Canada
        • Mexico
      • By By Measurement Method
      • By By Application
    • Market Attractiveness Analysis
      • By Country
      • By By Measurement Method
      • By By Application
    • Key Takeaways
  10. Latin America Market Analysis 2020 to 2024 and Forecast 2025 to 2035, By Country
    • Historical Market Size Value (USD Million) Trend Analysis By Market Taxonomy, 2020 to 2024
    • Market Size Value (USD Million) Forecast By Market Taxonomy, 2025 to 2035
      • By Country
        • Brazil
        • Chile
        • Rest of Latin America
      • By By Measurement Method
      • By By Application
    • Market Attractiveness Analysis
      • By Country
      • By By Measurement Method
      • By By Application
    • Key Takeaways
  11. Western Europe Market Analysis 2020 to 2024 and Forecast 2025 to 2035, By Country
    • Historical Market Size Value (USD Million) Trend Analysis By Market Taxonomy, 2020 to 2024
    • Market Size Value (USD Million) Forecast By Market Taxonomy, 2025 to 2035
      • By Country
        • Germany
        • UK
        • Italy
        • Spain
        • France
        • Nordic
        • BENELUX
        • Rest of Western Europe
      • By By Measurement Method
      • By By Application
    • Market Attractiveness Analysis
      • By Country
      • By By Measurement Method
      • By By Application
    • Key Takeaways
  12. Eastern Europe Market Analysis 2020 to 2024 and Forecast 2025 to 2035, By Country
    • Historical Market Size Value (USD Million) Trend Analysis By Market Taxonomy, 2020 to 2024
    • Market Size Value (USD Million) Forecast By Market Taxonomy, 2025 to 2035
      • By Country
        • Russia
        • Poland
        • Hungary
        • Balkan & Baltic
        • Rest of Eastern Europe
      • By By Measurement Method
      • By By Application
    • Market Attractiveness Analysis
      • By Country
      • By By Measurement Method
      • By By Application
    • Key Takeaways
  13. East Asia Market Analysis 2020 to 2024 and Forecast 2025 to 2035, By Country
    • Historical Market Size Value (USD Million) Trend Analysis By Market Taxonomy, 2020 to 2024
    • Market Size Value (USD Million) Forecast By Market Taxonomy, 2025 to 2035
      • By Country
        • China
        • Japan
        • South Korea
      • By By Measurement Method
      • By By Application
    • Market Attractiveness Analysis
      • By Country
      • By By Measurement Method
      • By By Application
    • Key Takeaways
  14. South Asia and Pacific Market Analysis 2020 to 2024 and Forecast 2025 to 2035, By Country
    • Historical Market Size Value (USD Million) Trend Analysis By Market Taxonomy, 2020 to 2024
    • Market Size Value (USD Million) Forecast By Market Taxonomy, 2025 to 2035
      • By Country
        • India
        • ASEAN
        • Australia & New Zealand
        • Rest of South Asia and Pacific
      • By By Measurement Method
      • By By Application
    • Market Attractiveness Analysis
      • By Country
      • By By Measurement Method
      • By By Application
    • Key Takeaways
  15. Middle East & Africa Market Analysis 2020 to 2024 and Forecast 2025 to 2035, By Country
    • Historical Market Size Value (USD Million) Trend Analysis By Market Taxonomy, 2020 to 2024
    • Market Size Value (USD Million) Forecast By Market Taxonomy, 2025 to 2035
      • By Country
        • Kingdom of Saudi Arabia
        • Other GCC Countries
        • Turkiye
        • South Africa
        • Other African Union
        • Rest of Middle East & Africa
      • By By Measurement Method
      • By By Application
    • Market Attractiveness Analysis
      • By Country
      • By By Measurement Method
      • By By Application
    • Key Takeaways
  16. Key Countries Market Analysis
    • USA
      • Pricing Analysis
      • Market Share Analysis, 2024
        • By By Measurement Method
        • By By Application
    • Canada
      • Pricing Analysis
      • Market Share Analysis, 2024
        • By By Measurement Method
        • By By Application
    • Mexico
      • Pricing Analysis
      • Market Share Analysis, 2024
        • By By Measurement Method
        • By By Application
    • Brazil
      • Pricing Analysis
      • Market Share Analysis, 2024
        • By By Measurement Method
        • By By Application
    • Chile
      • Pricing Analysis
      • Market Share Analysis, 2024
        • By By Measurement Method
        • By By Application
    • Germany
      • Pricing Analysis
      • Market Share Analysis, 2024
        • By By Measurement Method
        • By By Application
    • UK
      • Pricing Analysis
      • Market Share Analysis, 2024
        • By By Measurement Method
        • By By Application
    • Italy
      • Pricing Analysis
      • Market Share Analysis, 2024
        • By By Measurement Method
        • By By Application
    • Spain
      • Pricing Analysis
      • Market Share Analysis, 2024
        • By By Measurement Method
        • By By Application
    • France
      • Pricing Analysis
      • Market Share Analysis, 2024
        • By By Measurement Method
        • By By Application
    • India
      • Pricing Analysis
      • Market Share Analysis, 2024
        • By By Measurement Method
        • By By Application
    • ASEAN
      • Pricing Analysis
      • Market Share Analysis, 2024
        • By By Measurement Method
        • By By Application
    • Australia & New Zealand
      • Pricing Analysis
      • Market Share Analysis, 2024
        • By By Measurement Method
        • By By Application
    • China
      • Pricing Analysis
      • Market Share Analysis, 2024
        • By By Measurement Method
        • By By Application
    • Japan
      • Pricing Analysis
      • Market Share Analysis, 2024
        • By By Measurement Method
        • By By Application
    • South Korea
      • Pricing Analysis
      • Market Share Analysis, 2024
        • By By Measurement Method
        • By By Application
    • Russia
      • Pricing Analysis
      • Market Share Analysis, 2024
        • By By Measurement Method
        • By By Application
    • Poland
      • Pricing Analysis
      • Market Share Analysis, 2024
        • By By Measurement Method
        • By By Application
    • Hungary
      • Pricing Analysis
      • Market Share Analysis, 2024
        • By By Measurement Method
        • By By Application
    • Kingdom of Saudi Arabia
      • Pricing Analysis
      • Market Share Analysis, 2024
        • By By Measurement Method
        • By By Application
    • Turkiye
      • Pricing Analysis
      • Market Share Analysis, 2024
        • By By Measurement Method
        • By By Application
    • South Africa
      • Pricing Analysis
      • Market Share Analysis, 2024
        • By By Measurement Method
        • By By Application
  17. Market Structure Analysis
    • Competition Dashboard
    • Competition Benchmarking
    • Market Share Analysis of Top Players
      • By Regional
      • By By Measurement Method
      • By By Application
  18. Competition Analysis
    • Competition Deep Dive
      • Ametek Mocon
        • Overview
        • Product Portfolio
        • Profitability by Market Segments (Product/Age /Sales Channel/Region)
        • Sales Footprint
        • Strategy Overview
          • Marketing Strategy
          • Product Strategy
          • Channel Strategy
      • Qualitest
      • Gintronic Instruments
      • TESTEX
      • TOYOSEIKI
      • Techlab Systems
      • Testron Group
      • Industrial Physics (Systech)
      • Poretech
      • Hexa Plast
      • IDM Instruments
      • Jinan Labthink Instruments
      • Paratronix Instruments
      • Jinan Saicheng Electronic Technology
      • Shandong Drick Instruments
      • Hefei Fanyuan Instrument
      • Guangzhou Biaoji Packaging Equipment
      • GESTER International
      • Guangzhou Labstone
      • Jinan Pubtester Instruments
  19. Assumptions & Acronyms Used
  20. Research Methodology

List of Tables

  • Table 1: Global Market Value (USD Million) Forecast by Region, 2020 to 2035
  • Table 2: Global Market Value (USD Million) Forecast by By Measurement Method , 2020 to 2035
  • Table 3: Global Market Value (USD Million) Forecast by By Application, 2020 to 2035
  • Table 4: North America Market Value (USD Million) Forecast by Country, 2020 to 2035
  • Table 5: North America Market Value (USD Million) Forecast by By Measurement Method , 2020 to 2035
  • Table 6: North America Market Value (USD Million) Forecast by By Application, 2020 to 2035
  • Table 7: Latin America Market Value (USD Million) Forecast by Country, 2020 to 2035
  • Table 8: Latin America Market Value (USD Million) Forecast by By Measurement Method , 2020 to 2035
  • Table 9: Latin America Market Value (USD Million) Forecast by By Application, 2020 to 2035
  • Table 10: Western Europe Market Value (USD Million) Forecast by Country, 2020 to 2035
  • Table 11: Western Europe Market Value (USD Million) Forecast by By Measurement Method , 2020 to 2035
  • Table 12: Western Europe Market Value (USD Million) Forecast by By Application, 2020 to 2035
  • Table 13: Eastern Europe Market Value (USD Million) Forecast by Country, 2020 to 2035
  • Table 14: Eastern Europe Market Value (USD Million) Forecast by By Measurement Method , 2020 to 2035
  • Table 15: Eastern Europe Market Value (USD Million) Forecast by By Application, 2020 to 2035
  • Table 16: East Asia Market Value (USD Million) Forecast by Country, 2020 to 2035
  • Table 17: East Asia Market Value (USD Million) Forecast by By Measurement Method , 2020 to 2035
  • Table 18: East Asia Market Value (USD Million) Forecast by By Application, 2020 to 2035
  • Table 19: South Asia and Pacific Market Value (USD Million) Forecast by Country, 2020 to 2035
  • Table 20: South Asia and Pacific Market Value (USD Million) Forecast by By Measurement Method , 2020 to 2035
  • Table 21: South Asia and Pacific Market Value (USD Million) Forecast by By Application, 2020 to 2035
  • Table 22: Middle East & Africa Market Value (USD Million) Forecast by Country, 2020 to 2035
  • Table 23: Middle East & Africa Market Value (USD Million) Forecast by By Measurement Method , 2020 to 2035
  • Table 24: Middle East & Africa Market Value (USD Million) Forecast by By Application, 2020 to 2035

List of Figures

  • Figure 1: Global Market Pricing Analysis
  • Figure 2: Global Market Value (USD Million) Forecast 2020-2035
  • Figure 3: Global Market Value Share and BPS Analysis by By Measurement Method , 2025 and 2035
  • Figure 4: Global Market Y to o to Y Growth Comparison by By Measurement Method , 2025-2035
  • Figure 5: Global Market Attractiveness Analysis by By Measurement Method
  • Figure 6: Global Market Value Share and BPS Analysis by By Application, 2025 and 2035
  • Figure 7: Global Market Y to o to Y Growth Comparison by By Application, 2025-2035
  • Figure 8: Global Market Attractiveness Analysis by By Application
  • Figure 9: Global Market Value (USD Million) Share and BPS Analysis by Region, 2025 and 2035
  • Figure 10: Global Market Y to o to Y Growth Comparison by Region, 2025-2035
  • Figure 11: Global Market Attractiveness Analysis by Region
  • Figure 12: North America Market Incremental Dollar Opportunity, 2025-2035
  • Figure 13: Latin America Market Incremental Dollar Opportunity, 2025-2035
  • Figure 14: Western Europe Market Incremental Dollar Opportunity, 2025-2035
  • Figure 15: Eastern Europe Market Incremental Dollar Opportunity, 2025-2035
  • Figure 16: East Asia Market Incremental Dollar Opportunity, 2025-2035
  • Figure 17: South Asia and Pacific Market Incremental Dollar Opportunity, 2025-2035
  • Figure 18: Middle East & Africa Market Incremental Dollar Opportunity, 2025-2035
  • Figure 19: North America Market Value Share and BPS Analysis by Country, 2025 and 2035
  • Figure 20: North America Market Value Share and BPS Analysis by By Measurement Method , 2025 and 2035
  • Figure 21: North America Market Y to o to Y Growth Comparison by By Measurement Method , 2025-2035
  • Figure 22: North America Market Attractiveness Analysis by By Measurement Method
  • Figure 23: North America Market Value Share and BPS Analysis by By Application, 2025 and 2035
  • Figure 24: North America Market Y to o to Y Growth Comparison by By Application, 2025-2035
  • Figure 25: North America Market Attractiveness Analysis by By Application
  • Figure 26: Latin America Market Value Share and BPS Analysis by Country, 2025 and 2035
  • Figure 27: Latin America Market Value Share and BPS Analysis by By Measurement Method , 2025 and 2035
  • Figure 28: Latin America Market Y to o to Y Growth Comparison by By Measurement Method , 2025-2035
  • Figure 29: Latin America Market Attractiveness Analysis by By Measurement Method
  • Figure 30: Latin America Market Value Share and BPS Analysis by By Application, 2025 and 2035
  • Figure 31: Latin America Market Y to o to Y Growth Comparison by By Application, 2025-2035
  • Figure 32: Latin America Market Attractiveness Analysis by By Application
  • Figure 33: Western Europe Market Value Share and BPS Analysis by Country, 2025 and 2035
  • Figure 34: Western Europe Market Value Share and BPS Analysis by By Measurement Method , 2025 and 2035
  • Figure 35: Western Europe Market Y to o to Y Growth Comparison by By Measurement Method , 2025-2035
  • Figure 36: Western Europe Market Attractiveness Analysis by By Measurement Method
  • Figure 37: Western Europe Market Value Share and BPS Analysis by By Application, 2025 and 2035
  • Figure 38: Western Europe Market Y to o to Y Growth Comparison by By Application, 2025-2035
  • Figure 39: Western Europe Market Attractiveness Analysis by By Application
  • Figure 40: Eastern Europe Market Value Share and BPS Analysis by Country, 2025 and 2035
  • Figure 41: Eastern Europe Market Value Share and BPS Analysis by By Measurement Method , 2025 and 2035
  • Figure 42: Eastern Europe Market Y to o to Y Growth Comparison by By Measurement Method , 2025-2035
  • Figure 43: Eastern Europe Market Attractiveness Analysis by By Measurement Method
  • Figure 44: Eastern Europe Market Value Share and BPS Analysis by By Application, 2025 and 2035
  • Figure 45: Eastern Europe Market Y to o to Y Growth Comparison by By Application, 2025-2035
  • Figure 46: Eastern Europe Market Attractiveness Analysis by By Application
  • Figure 47: East Asia Market Value Share and BPS Analysis by Country, 2025 and 2035
  • Figure 48: East Asia Market Value Share and BPS Analysis by By Measurement Method , 2025 and 2035
  • Figure 49: East Asia Market Y to o to Y Growth Comparison by By Measurement Method , 2025-2035
  • Figure 50: East Asia Market Attractiveness Analysis by By Measurement Method
  • Figure 51: East Asia Market Value Share and BPS Analysis by By Application, 2025 and 2035
  • Figure 52: East Asia Market Y to o to Y Growth Comparison by By Application, 2025-2035
  • Figure 53: East Asia Market Attractiveness Analysis by By Application
  • Figure 54: South Asia and Pacific Market Value Share and BPS Analysis by Country, 2025 and 2035
  • Figure 55: South Asia and Pacific Market Value Share and BPS Analysis by By Measurement Method , 2025 and 2035
  • Figure 56: South Asia and Pacific Market Y to o to Y Growth Comparison by By Measurement Method , 2025-2035
  • Figure 57: South Asia and Pacific Market Attractiveness Analysis by By Measurement Method
  • Figure 58: South Asia and Pacific Market Value Share and BPS Analysis by By Application, 2025 and 2035
  • Figure 59: South Asia and Pacific Market Y to o to Y Growth Comparison by By Application, 2025-2035
  • Figure 60: South Asia and Pacific Market Attractiveness Analysis by By Application
  • Figure 61: Middle East & Africa Market Value Share and BPS Analysis by Country, 2025 and 2035
  • Figure 62: Middle East & Africa Market Value Share and BPS Analysis by By Measurement Method , 2025 and 2035
  • Figure 63: Middle East & Africa Market Y to o to Y Growth Comparison by By Measurement Method , 2025-2035
  • Figure 64: Middle East & Africa Market Attractiveness Analysis by By Measurement Method
  • Figure 65: Middle East & Africa Market Value Share and BPS Analysis by By Application, 2025 and 2035
  • Figure 66: Middle East & Africa Market Y to o to Y Growth Comparison by By Application, 2025-2035
  • Figure 67: Middle East & Africa Market Attractiveness Analysis by By Application
  • Figure 68: Global Market - Tier Structure Analysis
  • Figure 69: Global Market - Company Share Analysis
Dashboard
Dashboard
Dashboard
Dashboard
Dashboard
Dashboard

Full Research Suite comprises of:

Market outlook & trends analysis

Market outlook & trends analysis

Interviews & case studies

Interviews & case studies

Strategic recommendations

Strategic recommendations

Vendor profiles & capabilities analysis

Vendor profiles & capabilities analysis

5-year forecasts

5-year forecasts

8 regions and 60+ country-level data splits

8 regions and 60+ country-level data splits

Market segment data splits

Market segment data splits

12 months of continuous data updates

12 months of continuous data updates

DELIVERED AS:

PDF EXCEL ONLINE

Full Research Suite


$5000

$7500

$10000

Buy Report Now
Similar Industry Reports

Similar Industry Reports

Water and Waste Water Treatment Chemical Market

Water and Waste Water Treatment Chemical Market Size and Share Forecast Outlook 2025 to 2035

Water-cooled Walk-in Temperature & Humidity Chamber Market

Water-cooled Walk-in Temperature & Humidity Chamber Market Size and Share Forecast Outlook 2025 to 2035

Waterless Bathing Solution Market

Waterless Bathing Solution Market Size and Share Forecast Outlook 2025 to 2035

Water Treatment System Market

Water Treatment System Market Size and Share Forecast Outlook 2025 to 2035

Waterborne UV Curable Resin Market

Waterborne UV Curable Resin Market Size and Share Forecast Outlook 2025 to 2035

Water Treatment Chemical Market

Water Treatment Chemical Market Size and Share Forecast Outlook 2025 to 2035

Water Adventure Tourism Market

Water Adventure Tourism Market Forecast and Outlook 2025 to 2035

Water Packaging Market

Water Packaging Market Forecast and Outlook 2025 to 2035

Water Soluble Bag Market

Water Soluble Bag Market Size and Share Forecast Outlook 2025 to 2035

Water Leak Sensors Market

Water Leak Sensors Market Size and Share Forecast Outlook 2025 to 2035

Water-soluble Packaging Market

Water-soluble Packaging Market Size and Share Forecast Outlook 2025 to 2035

Water Leak Detection System for Server Rooms and Data Centers Market

Water Leak Detection System for Server Rooms and Data Centers Market Size and Share Forecast Outlook 2025 to 2035

Water and Wastewater Treatment Equipment Market

Water and Wastewater Treatment Equipment Market Size and Share Forecast Outlook 2025 to 2035

Water Treatment Market

Water Treatment Market Size and Share Forecast Outlook 2025 to 2035

Water Underfloor Heating Thermostat Market

Water Underfloor Heating Thermostat Market Size and Share Forecast Outlook 2025 to 2035

Water Activity Meter Market

Water Activity Meter Market Size and Share Forecast Outlook 2025 to 2035

Water Leakage Tester Market

Water Leakage Tester Market Size and Share Forecast Outlook 2025 to 2035

Waterstops Market
Waterstops Market

Waterstops Market Size and Share Forecast Outlook 2025 to 2035

Water-miscible Metalworking Oil Market

Water-miscible Metalworking Oil Market Size and Share Forecast Outlook 2025 to 2035

Waterborne Polyurethane Dispersions Market

Waterborne Polyurethane Dispersions Market Size and Share Forecast Outlook 2025 to 2035

Future Market Insights

Water Vapor Permeability Analyzers Market

Chat With MaRIA

Chat With

MaRIA

Hi There, I am MaRIA, Your Market Research Intelligence Assistant. How may I help you?