Instant Payments Market
Market Insights on Instant Payments covering sales outlook, demand forecast & up-to-date key trends
Instant Payments Market by Type, Application & Region - Forecast 2022 - 2032
Instant Payments Market Outlook (2022-2032)
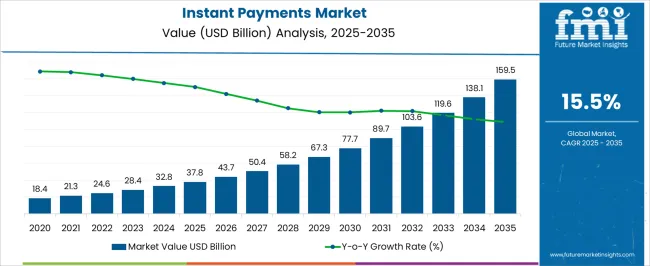
[322 Pages Report] The Instant payments market is expected to strengthen its hold in the global market at a strong CAGR of 18.1% between 2022 and 2032.
The market is valued at US$ 24 bn in 2022 and is likely to reach US$ 126.4 Bn by 2032. Previously, the market was booming at a much higher CAGR of 31.7% (2016-2021), resulting in market size of US$ 18.3 Bn in 2021.
“High penetration of smartphones, fast internet and cloud-based solutions that enhanced the payment experience in multiple industries like BFSI, Retail, Manufacturing and Healthcare etc. are fueling the sales of instant payment market.”
The government is investing huge capital in instant payments, smoothening the payment process for the end users. Financial institutes and research and development programs have helped the sector in upgrading and accelerating the growth of the instant payment market.
Attributes |
Details |
Instant payments Market CAGR (2022-2032) |
18.1% |
Instant payments Market Value (2022) |
US$ 24 Bn |
Instant payments Market Value (2032) |
US 126.4 Bn |
Let us know your requirement to get
100% FREE customization
What is the COVID-19 Impact on the Instant Payments Market?
Covid-19 has impacted multiple global markets by rearranging the supply chains because of the market restrictions and logistics bans introduced by governments around the world. However, some markets benefited through the course of the pandemic. Covid-19 has helped in the growth of the instant payment market as it has expanded the competition and adoption of contactless payments.
Covid-19 has speeded up the transformation process, including the shift from a cash economy to a cashless economy. E-commerce and digital payment platforms during the peak of covid-19 have also expanded their space into virus-affected regions. This is a factor behind the excessive growth of the market, with an extremely high CAGR of 31.7% between 2015 and 2021. Another factor behind the high adoption of instant payment options is the rapid digitization of multiple corporations, industries, and retail outlets, fueling the sales of the instant payment market.
The covid-19 has also triggered the need for better payment options as companies follow work-from-home procedures, fueling the sales of instant payment tools. Some of these tools are Dwolla, Authorize.net, 2Checkout, etc.
What are the Key Drivers and Restraints for Growth of the Instant Payments Market?
“The digitization, government initiatives and rapid adoption of real-time payment platforms in almost every industry such as retail, e-commerce, healthcare, education and FMCG has fueled the growth of instant payment market.”
Shift to cashless and contactless payments, high capital investment by governments, and the spreading of awareness about alternative payment methods are the driving factors for the growth of the instant payment market. Through the advent of coronavirus, the need for instant payment solutions has increased.
New players are coming into the market with lucrative schemes. Countries like India and China have started shifting towards a cashless economy. Steps like demonetization and enhanced online cash transfer platforms have pushed people to use instant payment gateways and tools, fueling the sales of the instant payment market.
High penetration of 4G/5G internet and smartphones has made payments easier and faster. Along with that, the adoption of cloud-based payment solutions that are developed through various financial institutes and their integration with research and development programs are also pushing enterprises to adopt these platforms.
The incorporation of cutting-edge technology like artificial intelligence and machine learning integrating with these platforms provides an enhanced customer experience. For instance, AI helps these platforms in verifying multiple QR codes and helps when the payment is stuck. AI also works as the first line of support that troubleshoots when there is an error.
Machine learning helps these platforms by introducing new advanced payment methods to ease and smoothen cash transfers.
The future growth prospects look lucrative for the instant payment market due to the rollout of 5G networks in multiple developed and developing countries. This will further make the payment processes faster and easy. Another factor that drives the market’s growth is big tech and consulting giants using online payment options to transfer huge amounts.
For instance, JP Morgan Chase & Co. has introduced the request to pay that enables their multiple clients to send payment requests to over 57 Mn retail clients just through their app and website.
Digitization has also risen with the advent of covid-19 as it barred corporates from functioning physically. For instance, Japan initiated the Cashless Japan program to aware its citizen about cashless and contactless payments.
The major restraint that challenges the market is slow internet speed in certain regions, lack of awareness, and an incompetent workforce that needs to get trained for multiple payment operations. This restricts the instant payment market slightly.
Find your sweet spots for generating winning opportunities in this market.
Talk to AnalystComparative View of Adjacent Instant Payments Market ;
Instant payments Market:
Attributes |
Instant payments Market |
CAGR (2022-2032) |
18.1% |
Market Value (2026) |
US$ 46.69 Bn |
Growth Factor |
The growing need for quick and smooth transfer of money from corporates fuels the growth of instant payment market. |
Opportunity |
The market creates opportunities for the industries to ease the payment processes and focus on the core competencies. ; |
Key Trends |
Integration of AI and Machine learning along with introduction of platforms that work well in low network bandwidth |
Online Payment Market:
Attributes |
Online Payment Market |
CAGR (2022-2032) |
8.2% |
Market Value (2026) |
US$ 15,300 Bn |
Growth Factor |
Rising government initiatives to aware citizens about the benefits of contactless payments through online payment methods. |
Opportunity |
Market is providing opportunities to retail industry through mobile payments at outlets like Dominos, Starbucks etc. |
Key Trends |
Increased use of AI technology in the online payment platforms to determine patterns and support the end user with troubleshooting. |
Digital Payment market
Attributes |
Digital Payment market |
CAGR (2022-2032) |
5.9% |
Market Value (2026) |
US$ 19000 Bn |
Growth Factor |
Matured customer/end suer behaviour, ensured transactional security and government initiatives are driving the growth of digital payment market. |
Opportunity |
Digital payment market creates opportunities for developing countries for liquidising the capital flow and enhance their economy. |
Key Trends |
Use of M-walletsa and QR codes to recieve and send money that is attached with their banks are in the market trend. |
The instant payment market is in its growing stage and is frequently adding new components to it. For instance, the use of these platforms while transferring amounts is now in trend as it is a safe and faster way to transfer money. Also, its application in online purchases, along with new approaches helping in the adoption of instant payment platforms, are booming the market.
The advent of AI and machine learning, along with the concept of blockchain, is likely to push the market trend while integrating it with virtual reality and metaverse for quick and smart payments.
Another trend in the market is the environmental concerns and no paper policies that push the sales of instant payment systems that also provide the digital receipt and saves the use of paper. All these trends help the instant payment market thrive and expand its roots in new market spaces.
What is the Segmentation Outlook for the Instant Payments Market?
The instant payments market is categorized by Type and Application. These categories are further divided into small segments that expand their channels in multiple market spaces. These segments perform differently in multiple markets as they have a strong hold in multiple regions.
According to payment type category, there are two segments; Free and Charge while the application category is segmented into P2B, B2B, B2C, C2C and O2O..

A unified Market Research Subscription Platform, built for today's disparate research needs.
Which Segment is likely to Lead the Instant Payments Market by Type?
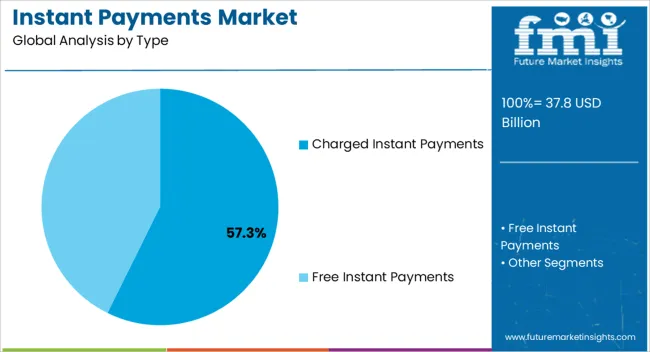
By platform type, the FMI study finds that the charge type of platform has the highest sales potential through 2032. The adoption of software systems is likely to grow at a CAGR of 17.9% during the forecast period. Consumer demand for charge systems is attributed to their characteristics like an easy-to-use interface, more services and verticals, and better customer support and security.
In the future, sales of Charge based instant payments systems are estimated to grow excessively in order to provide better end-user experience, security, and faster payments. This pushes the sales of instant payments systems in the new regions.
Which Segment is likely to Lead the Instant Payments Market by Application?
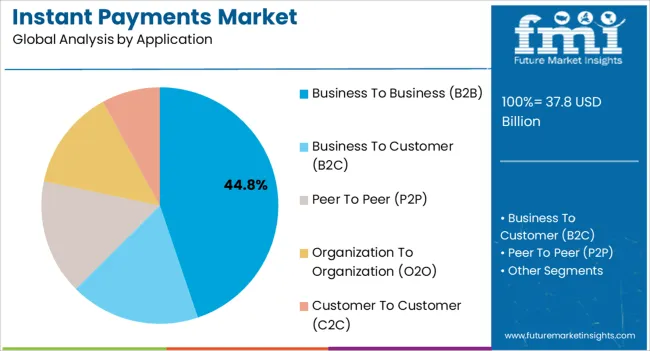
By application, Peer-to-peer money transfer is the biggest segment in the instant payments market and is expected to hold the largest portion in the forecast period. The segment is thriving at a strong CAGR of 17.4% between 2022 and 2032. The factors behind the growth of this segment are its high consumption of it in small and medium enterprises and by the general public.
Peer-to-peer transfer is used in transferring money from one’s bank account to other people like family, friends, or at any retail outlet. This helps the market expand its distribution channel because of its general use if it in P2P transfers, fueling the sales of instant payment platforms.
What is the Regional Analysis for the Instant Payments Market?
The Instant payments market is divided into regions; North America, Latin America, Asia Pacific, Middle East and Africa (MEA), and Europe. The biggest and the highest growing market is the United States, thriving at a CAGR of 17.8% between 2022-2032.
The region is expected to hold a market revenue of US$ 44.7 Bn by the end of 2032. The US holds the biggest forecasted revenue share due to the huge investments through government and private sectors for the transformation of the payment processes, demand for faster payment platforms, and increased online transactions in the region.
China region grows at the second-highest growth rate and will hold US$ 8.8 Bn by the end of 2032 as it thrives on a strong CAGR of 17.5% between 2022-and 2032. Japan also grows along with China a forecasted value of US$ 7.2 Bn (2032) at a CAGR of 16.4% between 2022-2032, while the United Kingdom (UK) has a revenue of US$ 5.3 Bn (2032) at a CAGR of 17.0%.
Regions |
CAGR (2022-2032) |
United States |
17.8% |
United Kingdom |
17.0% |
China |
17.5% |
Japan |
16.4% |
South Korea |
15.4% |
- United States hold the biggest portion in the instant payments market.
- US is the highest growing market in the making the North American region the highest growing region, China and Japan also grow at a stronger CAGR in the forecast period (2022-2032).
- Rising demand for cashless and contactless payments in multiple industries and advent of new cutting-edge technologies like AI and ML integrating with the payment platforms in North American and Asian nations like US, Canada, China and Japan are pushing the demand for instant payments platforms in the regions
How is the Competition in the Instant Payments Market?
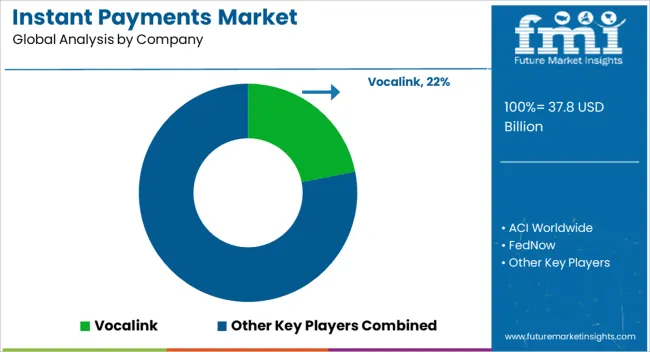
The competitive landscape of Instant payments is diversified and makes the market more exclusive for new players. Vendors are trying to make their platform more flexible for the latest technological advancements while working on faster transfers. The vendor companies also focus on mergers and collaborations to expand their distribution channels in new regions.
Recent Developments in the Instant Payments Market
- VocaLink
- SWIFT
- Danske Bank
- Paytm
- OCBC
Key Players
- Vocalink has revised their services such as instant money transfer, self-transfer and other B2B, B2C, P2P operations, fueling the sales of instant payment platforms.
- Paytm has introduced its latest options for multiple settlements like batch settlement, same-day settlements, on-demand settlements and real-time settlements, fueling the sales of instant payments platforms.
Key Segments:
By Type
- Charge
- Free
By Application
- B2B
- B2C
- P2P
- O2O
- C2C
By Region
- North America
- Latin America
- Middle East and Africa
- Europe
- Asia Pacific
Frequently Asked Questions
The Instant payments market is set to grow at a CAGR of 18.1%.
United States is the biggest region in Instant payments market with a forecasted value of US$ 10.5 Bn.
Charge segment is the leading segment in the instant payments market by type.
The instant payments market is set to reach US$ 126.4 Bn. Which Region has the Highest Growth Potential? North America has the highest growth potential in the Instant payments market, where the US has the highest CAGR of 17.8% in the forecast period (2022-2032).
Table of Content
1. Executive Summary
1.1. Global Market Outlook
1.2. Summary of Statistics
1.3. Key Market Characteristics & Attributes
1.4. Fact.MR Analysis and Recommendations
2. Market Overview
2.1. Market Coverage / Taxonomy
2.2. Market Definition / Scope / Limitations
3. Market Risks and Trends Assessment
3.1. Risk Assessment
3.1.1. COVID-19 Crisis and Impact on Instant Payments Demand
3.1.2. COVID-19 Impact Benchmark with Previous Crisis
3.1.3. Impact on Market Value (US$ Mn)
3.1.4. Assessment by Key Countries
3.1.5. Assessment by Key Market Segments
3.1.6. Action Points and Recommendation for Suppliers
3.2. Key Trends Impacting the Market
3.3. Formulation and Product Development Trends
4. Market Background and Foundation Data Points
4.1. Global Instant Payments Markets (US$ Mn)
4.2. Instant Payments Markets Opportunity Assessment (US$ Mn)
4.2.1. Total Available Market
4.2.2. Serviceable Addressable Market
4.2.3. Serviceable Obtainable Market
4.3. Market Scenario Forecast
4.3.1. Demand in optimistic Scenario
4.3.2. Demand in Likely Scenario
4.3.3. Demand in Conservative Scenario
4.4. Investment Feasibility Analysis
4.4.1. Investment in Established Markets
4.4.1.1. In Short Term
4.4.1.2. In Long Term
4.4.2. Investment in Emerging Markets
4.4.2.1. In Short Term
4.4.2.2. In Long Term
4.5. Forecast Factors - Relevance & Impact
4.5.1. Top Companies Historical Growth
4.5.2. Global Instant Payments Markets Growth
4.5.3. Instant Payments Adoption Rate, By Country
4.6. Market Dynamics
4.6.1. Market Driving Factors and Impact Assessment
4.6.2. Prominent Market Challenges and Impact Assessment
4.6.3. Instant Payments Markets Opportunities
4.6.4. Prominent Trends in the Global Market & Their Impact Assessment
5. Key Success Factors
5.1. Manufacturers’ Focus on Low Penetration High Growth Markets
5.2. Banking on with Segments High Incremental Opportunity
5.3. Peer Benchmarking
6. Global Instant Payments Markets Demand Analysis 2015-2021 and Forecast, 2022-2032
6.1. Historical Market Analysis, 2015-2021
6.2. Current and Future Market Projections, 2022-2032
6.3. Y-o-Y Growth Trend Analysis
7. Global Instant Payments Markets Value Analysis 2015-2021 and Forecast, 2022-2032
7.1. Historical Market Value (US$ Mn) Analysis, 2015-2021
7.2. Current and Future Market Value (US$ Mn) Projections, 2022-2032
7.2.1. Y-o-Y Growth Trend Analysis
7.2.2. Absolute $ Opportunity Analysis
8. Global Instant Payments Markets Analysis 2015-2021 and Forecast 2022-2032, By Type
8.1. Introduction / Key Findings
8.2. Historical Market Size (US$ Mn) Analysis By Type, 2015-2021
8.3. Current and Future Market Size (US$ Mn) Analysis and Forecast By Type, 2022-2032
8.3.1. Charge
8.3.2. Free
8.4. Market Attractiveness Analysis By Type
9. Global Instant Payments Markets Analysis 2015-2021 and Forecast 2022-2032, By Application
9.1. Introduction / Key Findings
9.2. Historical Market Size (US$ Mn) Analysis By Application, 2015-2021
9.3. Current and Future Market Size (US$ Mn) Analysis and Forecast By Application, 2022-2032
9.3.1. P2P
9.3.2. B2C
9.3.3. C2C
9.3.4. B2B
9.3.5. O2O
9.4. Market Attractiveness Analysis By Application
10. Global Instant Payments Markets Analysis 2015-2021 and Forecast 2022-2032, By Region
10.1. Introduction
10.2. Historical Market Size (US$ Mn) Analysis By Region, 2015-2021
10.3. Current Market Size (US$ Mn) & Analysis and Forecast By Region, 2022-2032
10.3.1. North America
10.3.2. Latin America
10.3.3. Europe
10.3.4. Asia Pacific
10.3.5. Middle East and Africa (MEA)
10.4. Market Attractiveness Analysis By Region
11. North America Instant Payments Markets Analysis 2015-2021 and Forecast 2022-2032
11.1. Introduction
11.2. Pricing Analysis
11.3. Historical Market Value (US$ Mn) Trend Analysis By Market Taxonomy, 2015-2021
11.4. Market Value (US$ Mn) & Forecast By Market Taxonomy, 2022-2032
11.4.1. By Country
11.4.1.1. U.S.
11.4.1.2. Canada
11.4.1.3. Rest of North America
11.4.2. By Type
11.4.3. By Application
11.5. Market Attractiveness Analysis
11.5.1. By Country
11.5.2. By Type
11.5.3. By Application
12. Latin America Instant Payments Markets Analysis 2015-2021 and Forecast 2022-2032
12.1. Introduction
12.2. Pricing Analysis
12.3. Historical Market Value (US$ Mn) Trend Analysis By Market Taxonomy, 2015-2021
12.4. Market Value (US$ Mn) & Forecast By Market Taxonomy, 2022-2032
12.4.1. By Country
12.4.1.1. Brazil
12.4.1.2. Mexico
12.4.1.3. Rest of Latin America
12.4.2. By Type
12.4.3. By Application
12.5. Market Attractiveness Analysis
12.5.1. By Country
12.5.2. By Type
12.5.3. By Application
13. Europe Instant Payments Markets Analysis 2015-2021 and Forecast 2022-2032
13.1. Introduction
13.2. Pricing Analysis
13.3. Historical Market Value (US$ Mn) Trend Analysis By Market Taxonomy, 2015-2021
13.4. Market Value (US$ Mn) & Forecast By Market Taxonomy, 2022-2032
13.4.1. By Country
13.4.1.1. Germany
13.4.1.2. France
13.4.1.3. U.K.
13.4.1.4. Italy
13.4.1.5. Benelux
13.4.1.6. Nordic Countries
13.4.1.7. Rest of Europe
13.4.2. By Type
13.4.3. By Application
13.5. Market Attractiveness Analysis
13.5.1. By Country
13.5.2. By Type
13.5.3. By Application
14. Asia Pacific Instant Payments Markets Analysis 2015-2021 and Forecast 2022-2032
14.1. Introduction
14.2. Pricing Analysis
14.3. Historical Market Value (US$ Mn) Trend Analysis By Market Taxonomy, 2015-2021
14.4. Market Value (US$ Mn) & Forecast By Market Taxonomy, 2022-2032
14.4.1. By Country
14.4.1.1. China
14.4.1.2. Japan
14.4.1.3. South Korea
14.4.1.4. Rest of Asia Pacific
14.4.2. By Type
14.4.3. By Application
14.5. Market Attractiveness Analysis
14.5.1. By Country
14.5.2. By Type
14.5.3. By Application
15. Middle East and Africa Instant Payments Markets Analysis 2015-2021 and Forecast 2022-2032
15.1. Introduction
15.2. Pricing Analysis
15.3. Historical Market Value (US$ Mn) Trend Analysis By Market Taxonomy, 2015-2021
15.4. Market Value (US$ Mn) & Forecast By Market Taxonomy, 2022-2032
15.4.1. By Country
15.4.1.1. GCC Countries
15.4.1.2. South Africa
15.4.1.3. Turkey
15.4.1.4. Rest of Middle East and Africa
15.4.2. By Type
15.4.3. By Application
15.5. Market Attractiveness Analysis
15.5.1. By Country
15.5.2. By Type
15.5.3. By Application
16. Key Countries Instant Payments Markets Analysis 2015-2021 and Forecast 2022-2032
16.1. Introduction
16.1.1. Market Value Proportion Analysis, By Key Countries
16.1.2. Global Vs. Country Growth Comparison
16.2. US Instant Payments Markets Analysis
16.2.1. Value Proportion Analysis by Market Taxonomy
16.2.2. Value & Analysis and Forecast by Market Taxonomy, 2015-2032
16.2.2.1. By Type
16.2.2.2. By Application
16.3. Canada Instant Payments Markets Analysis
16.3.1. Value Proportion Analysis by Market Taxonomy
16.3.2. Value & Analysis and Forecast by Market Taxonomy, 2015-2032
16.3.2.1. By Type
16.3.2.2. By Application
16.4. Mexico Instant Payments Markets Analysis
16.4.1. Value Proportion Analysis by Market Taxonomy
16.4.2. Value & Analysis and Forecast by Market Taxonomy, 2015-2032
16.4.2.1. By Type
16.4.2.2. By Application
16.5. Brazil Instant Payments Markets Analysis
16.5.1. Value Proportion Analysis by Market Taxonomy
16.5.2. Value & Analysis and Forecast by Market Taxonomy, 2015-2032
16.5.2.1. By Type
16.5.2.2. By Application
16.6. Germany Instant Payments Markets Analysis
16.6.1. Value Proportion Analysis by Market Taxonomy
16.6.2. Value & Analysis and Forecast by Market Taxonomy, 2015-2032
16.6.2.1. By Type
16.6.2.2. By Application
16.7. France Instant Payments Markets Analysis
16.7.1. Value Proportion Analysis by Market Taxonomy
16.7.2. Value & Analysis and Forecast by Market Taxonomy, 2015-2032
16.7.2.1. By Type
16.7.2.2. By Application
16.8. Italy Instant Payments Markets Analysis
16.8.1. Value Proportion Analysis by Market Taxonomy
16.8.2. Value & Analysis and Forecast by Market Taxonomy, 2015-2032
16.8.2.1. By Type
16.8.2.2. By Application
16.9. BENELUX Instant Payments Markets Analysis
16.9.1. Value Proportion Analysis by Market Taxonomy
16.9.2. Value & Analysis and Forecast by Market Taxonomy, 2015-2032
16.9.2.1. By Type
16.9.2.2. By Application
16.10. UK Instant Payments Markets Analysis
16.10.1. Value Proportion Analysis by Market Taxonomy
16.10.2. Value & Analysis and Forecast by Market Taxonomy, 2015-2032
16.10.2.1. By Type
16.10.2.2. By Application
16.11. Nordic Countries Instant Payments Markets Analysis
16.11.1. Value Proportion Analysis by Market Taxonomy
16.11.2. Value & Analysis and Forecast by Market Taxonomy, 2015-2032
16.11.2.1. By Type
16.11.2.2. By Application
16.12. China Instant Payments Markets Analysis
16.12.1. Value Proportion Analysis by Market Taxonomy
16.12.2. Value & Analysis and Forecast by Market Taxonomy, 2015-2032
16.12.2.1. By Type
16.12.2.2. By Application
16.13. Japan Instant Payments Markets Analysis
16.13.1. Value Proportion Analysis by Market Taxonomy
16.13.2. Value & Analysis and Forecast by Market Taxonomy, 2015-2032
16.13.2.1. By Type
16.13.2.2. By Application
16.14. South Korea Instant Payments Markets Analysis
16.14.1. Value Proportion Analysis by Market Taxonomy
16.14.2. Value & Analysis and Forecast by Market Taxonomy, 2015-2032
16.14.2.1. By Type
16.14.2.2. By Application
16.15. GCC Countries Instant Payments Markets Analysis
16.15.1. Value Proportion Analysis by Market Taxonomy
16.15.2. Value & Analysis and Forecast by Market Taxonomy, 2015-2032
16.15.2.1. By Type
16.15.2.2. By Application
16.16. South Africa Instant Payments Markets Analysis
16.16.1. Value Proportion Analysis by Market Taxonomy
16.16.2. Value & Analysis and Forecast by Market Taxonomy, 2015-2032
16.16.2.1. By Type
16.16.2.2. By Application
16.17. Turkey Instant Payments Markets Analysis
16.17.1. Value Proportion Analysis by Market Taxonomy
16.17.2. Value & Analysis and Forecast by Market Taxonomy, 2015-2032
16.17.2.1. By Type
16.17.2.2. By Application
16.17.3. Competition Landscape and Player Concentration in the Country
17. Market Structure Analysis
17.1. Market Analysis by Tier of Companies
17.2. Market Concentration
17.3. Market Share Analysis of Top Players
17.4. Market Presence Analysis
17.4.1. By Regional footprint of Players
17.4.2. Product footprint by Players
18. Competition Analysis
18.1. Competition Dashboard
18.2. Competition Benchmarking
18.3. Competition Deep Dive
18.3.1. Vocalink
18.3.1.1. Overview
18.3.1.2. Product Portfolio
18.3.1.3. Sales Footprint
18.3.1.4. Strategy Overview
18.3.2. SWIFT
18.3.2.1. Overview
18.3.2.2. Product Portfolio
18.3.2.3. Sales Footprint
18.3.2.4. Strategy Overview
18.3.3. Danske Bank
18.3.3.1. Overview
18.3.3.2. Product Portfolio
18.3.3.3. Sales Footprint
18.3.3.4. Strategy Overview
18.3.4. Paytm
18.3.4.1. Overview
18.3.4.2. Product Portfolio
18.3.4.3. Sales Footprint
18.3.4.4. Strategy Overview
18.3.5. OCBC
18.3.5.1. Overview
18.3.5.2. Product Portfolio
18.3.5.3. Sales Footprint
18.3.5.4. Strategy Overview
18.3.6. Barclays
18.3.6.1. Overview
18.3.6.2. Product Portfolio
18.3.6.3. Sales Footprint
18.3.6.4. Strategy Overview
18.3.7. Apple
18.3.7.1. Overview
18.3.7.2. Product Portfolio
18.3.7.3. Sales Footprint
18.3.7.4. Strategy Overview
18.3.8. BPAY
18.3.8.1. Overview
18.3.8.2. Product Portfolio
18.3.8.3. Sales Footprint
18.3.8.4. Strategy Overview
18.3.9. Ripple
18.3.9.1. Overview
18.3.9.2. Product Portfolio
18.3.9.3. Sales Footprint
18.3.9.4. Strategy Overview
18.3.10. PayPal
18.3.10.1. Overview
18.3.10.2. Product Portfolio
18.3.10.3. Sales Footprint
18.3.10.4. Strategy Overview
19. Assumptions and Acronyms Used
20. Research Methodology
Let us know your requirement to get
100% FREE customization
List of Tables
Table 1: Global Instant Payments Markets Value (US$ Mn), By Type, 2015 – 2021
Table 2: Global Instant Payments Markets Value (US$ Mn), By Type, 2022 – 2032
Table 3: Global Instant Payments Markets Value (US$ Mn), By Application, 2015 – 2021
Table 4: Global Instant Payments Markets Value (US$ Mn), By Application, 2022 – 2032
Table 5: Global Instant Payments Markets, By Region, 2015 – 2021
Table 6: Global Instant Payments Markets, By Region, 2022 – 2032
Table 7: North America Instant Payments Markets Value (US$ Mn), By Type, 2015 – 2021
Table 8: North America Instant Payments Markets Value (US$ Mn), By Type, 2022 – 2032
Table 9: North America Instant Payments Markets Value (US$ Mn), By Application, 2015 – 2021
Table 10: North America Instant Payments Markets Value (US$ Mn), By Application, 2022 – 2032
Table 11: North America Instant Payments Markets, By Country, 2015 – 2021
Table 12: North America Instant Payments Markets, By Country, 2022 – 2032
Table 13: Latin America Instant Payments Markets Value (US$ Mn), By Type, 2015 – 2021
Table 14: Latin America Instant Payments Markets Value (US$ Mn), By Type, 2022 – 2032
Table 15: Latin America Instant Payments Markets Value (US$ Mn), By Application, 2015 – 2021
Table 16: Latin America Instant Payments Markets Value (US$ Mn), By Application, 2022 – 2032
Table 17: Latin America Instant Payments Markets, By Country, 2015 – 2021
Table 18: Latin America Instant Payments Markets, By Country, 2022 – 2032
Table 19: Europe Instant Payments Markets Value (US$ Mn), By Type, 2015 – 2021
Table 20: Europe Instant Payments Markets Value (US$ Mn), By Type, 2022 – 2032
Table 21: Europe Instant Payments Markets Value (US$ Mn), By Application, 2015 – 2021
Table 22: Europe Instant Payments Markets Value (US$ Mn), By Application, 2022 – 2032
Table 23: Europe Instant Payments Markets, By Country, 2015 – 2021
Table 24: Europe Instant Payments Markets, By Country, 2022 – 2032
Table 25: Asia Pacific Instant Payments Markets Value (US$ Mn), By Type, 2015 – 2021
Table 26: Asia Pacific Instant Payments Markets Value (US$ Mn), By Type, 2022 – 2032
Table 27: Asia Pacific Instant Payments Markets Value (US$ Mn), By Application, 2015 – 2021
Table 28: Asia Pacific Instant Payments Markets Value (US$ Mn), By Application, 2022 – 2032
Table 29: Asia Pacific Instant Payments Markets, By Country, 2015 – 2021
Table 30: Asia Pacific Instant Payments Markets, By Country, 2022 – 2032
Table 31: MEA Instant Payments Markets Value (US$ Mn), By Type, 2015 – 2021
Table 32: MEA Instant Payments Markets Value (US$ Mn), By Type, 2022 – 2032
Table 33: MEA Instant Payments Markets Value (US$ Mn), By Application, 2015 – 2021
Table 34: MEA Instant Payments Markets Value (US$ Mn), By Application, 2022 – 2032
Table 35: MEA Instant Payments Markets, By Country, 2015 – 2021
Table 36: MEA Instant Payments Markets, By Country, 2022 – 2032
Table 37: Global Instant Payments Markets Incremental $ Opportunity, By Type, 2015 - 2021
Table 38: Global Instant Payments Markets Incremental $ Opportunity, By Application, 2022 – 2032
Table 39: Global Instant Payments Markets Incremental $ Opportunity, By Region, 2022 – 2032
Table 40: North America Instant Payments Markets Incremental $ Opportunity, By Type, 2015 - 2021
Table 41: North America Instant Payments Markets Incremental $ Opportunity, By Application, 2022 – 2032
Table 42: North America Instant Payments Markets Incremental $ Opportunity, By Country, 2022 – 2032
Table 43: Latin America Instant Payments Markets Incremental $ Opportunity, By Type, 2015 - 2021
Table 44: Latin America Instant Payments Markets Incremental $ Opportunity, By Application, 2022 – 2032
Table 45: Latin America Instant Payments Markets Incremental $ Opportunity, By Country, 2022 – 2032
Table 46: Europe Instant Payments Markets Incremental $ Opportunity, By Type, 2015 - 2021
Table 47: Europe Instant Payments Markets Incremental $ Opportunity, By Application, 2022 – 2032
Table 48: Europe Instant Payments Markets Incremental $ Opportunity, By Country, 2022 - 2032
Table 49: Asia Pacific Instant Payments Markets Incremental $ Opportunity, By Type, 2015 - 2021
Table 50: Asia Pacific Instant Payments Markets Incremental $ Opportunity, By Application, 2022 – 2032
Table 51: Asia Pacific Instant Payments Markets Incremental $ Opportunity, By Country, 2022 – 2032
Table 52: MEA Instant Payments Markets Incremental $ Opportunity, By Type, 2015 - 2021
Table 53: MEA Instant Payments Markets Incremental $ Opportunity, By Application, 2022 – 2032
Table 54: MEA Instant Payments Markets Incremental $ Opportunity, By Country, 2022 - 2032
Find your sweet spots for generating winning opportunities in this market.
Talk to AnalystList of Charts
Figure 1: Global Instant Payments Markets Value (US$ Mn) and Year-on-Year Growth, 2015-2032
Figure 2: Global Instant Payments Markets Absolute $ Historical Gain (2015 - 2021) and Opportunity (2022 – 2032), US$ Mn
Figure 3: Global Instant Payments Markets Share, By Type, 2022 & 2032
Figure 4: Global Instant Payments Markets Y-o-Y Growth Projections, By Type – 2022-2032
Figure 5: Global Instant Payments Markets Attractiveness Index, By Type – 2022-2032
Figure 6: Global Instant Payments Markets Share, By Application, 2022 & 2032
Figure 7: Global Instant Payments Markets Y-o-Y Growth Projections, By Application – 2022-2032
Figure 8: Global Instant Payments Markets Attractiveness Index, By Application – 2022-2032
Figure 9: Global Instant Payments Markets Share, By Region, 2022 & 2032
Figure 10: Global Instant Payments Markets Y-o-Y Growth Projections, By Region – 2022-2032
Figure 11: Global Instant Payments Markets Attractiveness Index, By Region – 2022-2032
Figure 12: North America Instant Payments Markets Value (US$ Mn) and Year-on-Year Growth, 2015-2032
Figure 13: North America Instant Payments Markets Absolute $ Opportunity Historical (2015 - 2021) and Forecast Period (2022 – 2032), US$ Mn
Figure 14: North America Instant Payments Markets Share, By Type, 2022 & 2032
Figure 15: North America Instant Payments Markets Y-o-Y Growth Projections, By Type – 2022-2032
Figure 16: North America Instant Payments Markets Attractiveness Index, By Type – 2022-2032
Figure 17: North America Instant Payments Markets Share, By Application, 2022 & 2032
Figure 18: North America Instant Payments Markets Y-o-Y Growth Projections, By Application – 2022-2032
Figure 19: North America Instant Payments Markets Attractiveness Index, By Application – 2022-2032
Figure 20: North America Instant Payments Markets Share, By Country, 2022 & 2032
Figure 21: North America Instant Payments Markets Y-o-Y Growth Projections, By Country – 2022-2032
Figure 22: North America Instant Payments Markets Attractiveness Index, By Country – 2022-2032
Figure 23: Latin America Instant Payments Markets Value (US$ Mn) and Year-on-Year Growth, 2015-2032
Figure 24: Latin America Instant Payments Markets Absolute $ Opportunity Historical (2015 - 2021) and Forecast Period (2022 – 2032), US$ Mn
Figure 25: Latin America Instant Payments Markets Share, By Type, 2022 & 2032
Figure 26: Latin America Instant Payments Markets Y-o-Y Growth Projections, By Type – 2022-2032
Figure 27: Latin America Instant Payments Markets Attractiveness Index, By Type – 2022-2032
Figure 28: Latin America Instant Payments Markets Share, By Application, 2022 & 2032
Figure 29: Latin America Instant Payments Markets Y-o-Y Growth Projections, By Application – 2022-2032
Figure 30: Latin America Instant Payments Markets Attractiveness Index, By Application – 2022-2032
Figure 31: Latin America Instant Payments Markets Share, By Country, 2022 & 2032
Figure 32: Latin America Instant Payments Markets Y-o-Y Growth Projections, By Country – 2022-2032
Figure 33: Latin America Instant Payments Markets Attractiveness Index, By Country – 2022-2032
Figure 34: Europe Instant Payments Markets Value (US$ Mn) and Year-on-Year Growth, 2015-2032
Figure 35: Europe Instant Payments Markets Absolute $ Opportunity Historical (2015 - 2021) and Forecast Period (2022 – 2032), US$ Mn
Figure 36: Europe Instant Payments Markets Share, By Type, 2022 & 2032
Figure 37: Europe Instant Payments Markets Y-o-Y Growth Projections, By Type – 2022-2032
Figure 38: Europe Instant Payments Markets Attractiveness Index, By Type – 2022-2032
Figure 39: Europe Instant Payments Markets Share, By Application, 2022 & 2032
Figure 40: Europe Instant Payments Markets Y-o-Y Growth Projections, By Application – 2022-2032
Figure 41: Europe Instant Payments Markets Attractiveness Index, By Application – 2022-2032
Figure 42: Europe Instant Payments Markets Share, By Country, 2022 & 2032
Figure 43: Europe Instant Payments Markets Y-o-Y Growth Projections, By Country – 2022-2032
Figure 44: Europe Instant Payments Markets Attractiveness Index, By Country – 2022-2032
Figure 45: MEA Instant Payments Markets Value (US$ Mn) and Year-on-Year Growth, 2015-2032
Figure 46: MEA Instant Payments Markets Absolute $ Opportunity Historical (2015 - 2021) and Forecast Period (2022 – 2032), US$ Mn
Figure 47: MEA Instant Payments Markets Share, By Type, 2022 & 2032
Figure 48: MEA Instant Payments Markets Y-o-Y Growth Projections, By Type – 2022-2032
Figure 49: MEA Instant Payments Markets Attractiveness Index, By Type – 2022-2032
Figure 50: MEA Instant Payments Markets Share, By Application, 2022 & 2032
Figure 51: MEA Instant Payments Markets Y-o-Y Growth Projections, By Application – 2022-2032
Figure 52: MEA Instant Payments Markets Attractiveness Index, By Application – 2022-2032
Figure 53: MEA Instant Payments Markets Share, By Country, 2022 & 2032
Figure 54: MEA Instant Payments Markets Y-o-Y Growth Projections, By Country – 2022-2032
Figure 55: MEA Instant Payments Markets Attractiveness Index, By Country – 2022-2032
Figure 56: Asia Pacific Instant Payments Markets Value (US$ Mn) and Year-on-Year Growth, 2015-2032
Figure 57: Asia Pacific Instant Payments Markets Absolute $ Opportunity Historical (2015 - 2021) and Forecast Period (2022 – 2032), US$ Mn
Figure 58: Asia Pacific Instant Payments Markets Share, By Type, 2022 & 2032
Figure 59: Asia Pacific Instant Payments Markets Y-o-Y Growth Projections, By Type – 2022-2032
Figure 60: Asia Pacific Instant Payments Markets Attractiveness Index, By Type – 2022-2032
Figure 61: Asia Pacific Instant Payments Markets Share, By Application, 2022 & 2032
Figure 62: Asia Pacific Instant Payments Markets Y-o-Y Growth Projections, By Application – 2022-2032
Figure 63: Asia Pacific Instant Payments Markets Attractiveness Index, By Application – 2022-2032
Figure 64: Asia Pacific Instant Payments Markets Share, By Country, 2022 & 2032
Figure 65: Asia Pacific Instant Payments Markets Y-o-Y Growth Projections, By Country – 2022-2032
Figure 66: Asia Pacific Instant Payments Markets Attractiveness Index, By Country – 2022-2032
Figure 67: US Instant Payments Markets Value (US$ Mn) and Forecast, 2022 - 2032
Figure 68: US Instant Payments Markets Share, By Type, 2021
Figure 69: US Instant Payments Markets Share, By Application, 2021
Figure 70: Canada Instant Payments Markets Value (US$ Mn) and Forecast, 2022 - 2032
Figure 71: Canada Instant Payments Markets Share, By Type, 2021
Figure 72: Canada Instant Payments Markets Share, By Application, 2021
Figure 73: Brazil Instant Payments Markets Value (US$ Mn) and Forecast, 2022 - 2032
Figure 74: Brazil Instant Payments Markets Share, By Type, 2021
Figure 75: Brazil Instant Payments Markets Share, By Application, 2021
Figure 76: Mexico Instant Payments Markets Value (US$ Mn) and Forecast, 2022 - 2032
Figure 77: Mexico Instant Payments Markets Share, By Type, 2021
Figure 78: Mexico Instant Payments Markets Share, By Application, 2021
Figure 79: Germany Instant Payments Markets Value (US$ Mn) and Forecast, 2022 - 2032
Figure 80: Germany Instant Payments Markets Share, By Type, 2021
Figure 81: Germany Instant Payments Markets Share, By Application, 2021
Figure 82: U.K. Instant Payments Markets Value (US$ Mn) and Forecast, 2022 - 2032
Figure 83: U.K. Instant Payments Markets Share, By Type, 2021
Figure 84: U.K. Instant Payments Markets Share, By Application, 2021
Figure 85: France Instant Payments Markets Value (US$ Mn) and Forecast, 2022 - 2032
Figure 86: France Instant Payments Markets Share, By Type, 2021
Figure 87: France Instant Payments Markets Share, By Application, 2021
Figure 88: Italy Instant Payments Markets Value (US$ Mn) and Forecast, 2022 - 2032
Figure 89: Italy Instant Payments Markets Share, By Type, 2021
Figure 90: Italy Instant Payments Markets Share, By Application, 2021
Figure 91: BENELUX Instant Payments Markets Value (US$ Mn) and Forecast, 2022 - 2032
Figure 92: BENELUX Instant Payments Markets Share, By Type, 2021
Figure 93: BENELUX Instant Payments Markets Share, By Application, 2021
Figure 94: Nordic Countries Instant Payments Markets Value (US$ Mn) and Forecast, 2022 - 2032
Figure 95: Nordic Countries Instant Payments Markets Share, By Type, 2021
Figure 96: Nordic Countries Instant Payments Markets Share, By Application, 2021
Figure 97: China Instant Payments Markets Value (US$ Mn) and Forecast, 2022 - 2032
Figure 98: China Instant Payments Markets Share, By Type, 2021
Figure 99: China Instant Payments Markets Share, By Application, 2021
Figure 100: Japan Instant Payments Markets Value (US$ Mn) and Forecast, 2022 - 2032
Figure 101: Japan Instant Payments Markets Share, By Type, 2021
Figure 102: Japan Instant Payments Markets Share, By Application, 2021
Figure 103: South Korea Instant Payments Markets Value (US$ Mn) and Forecast, 2022 - 2032
Figure 104: South Korea Instant Payments Markets Share, By Type, 2021
Figure 105: South Korea Instant Payments Markets Share, By Application, 2021
Figure 106: GCC Countries Instant Payments Markets Value (US$ Mn) and Forecast, 2022 - 2032
Figure 107: GCC Countries Instant Payments Markets Share, By Type, 2021
Figure 108: GCC Countries Instant Payments Markets Share, By Application, 2021
Figure 109: South Africa Instant Payments Markets Value (US$ Mn) and Forecast, 2022 - 2032
Figure 110: South Africa Instant Payments Markets Share, By Type, 2021
Figure 111: South Africa Instant Payments Markets Share, By Application, 2021
Figure 112: Turkey Instant Payments Markets Value (US$ Mn) and Forecast, 2022 - 2032
Figure 113: Turkey Instant Payments Markets Share, By Type, 2021
Figure 114: Turkey Instant Payments Markets Share, By Application, 2021
Need specific information?
Request CustomizationExplore Technology Insights
View Reports